
Producer Price Index May 2026: Too Many “Since 2022” References
The PPI bad news continues with Final Demand at +6.5%, the highest since Nov 2022 at +7.4%.

PPI provides useful leading indicator metrics for PCE and CPI trends ahead, so the May PPI results are bad news unless some major progress is made in energy this summer with an Iran deal that is real.
Lag times from the underlying PPI cost pressures as well as event risk complicate the potential range of outcomes in the days ahead with more tariffs rolling in and Iran and Trump apparently back in a more violent exchange of “ceasefire actions.”
The total Final Demand index of +6.5% was the highest since +7.4% in Nov 2022. Final demand “less food, energy, and trade services” MoM at +0.8% was the highest since March 2022 at 0.9%. The YoY metric for the same index was +5.1% or the highest since Oct 2022 (5.5%). Bottom line: that is too many 2022 comps except PCE growth and monthly payroll additions, which were higher in 2022 than 2026.
The “Final Demand Goods” metrics were especially grim with the +2.8% MoM in May, which was the highest since it was first computed back in Dec 2009. The 12-month rate was +10.4%. The +36.6% rate for “Final Demand Energy” was (as all expected) a major culprit. “Final demand goods less foods and energy” was a less daunting +5.1%.
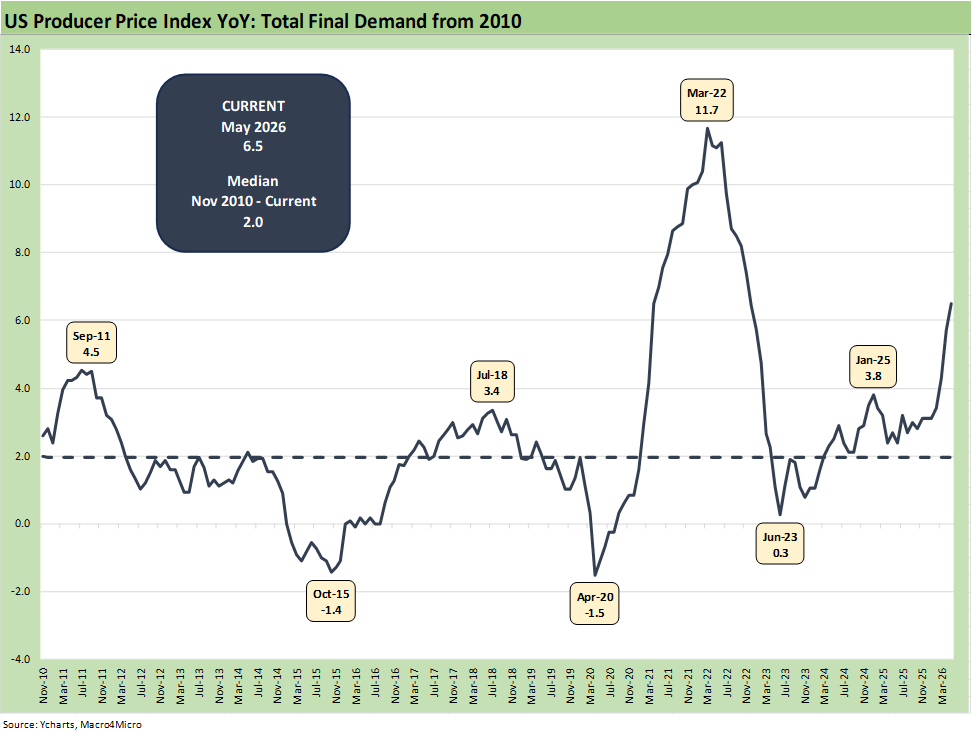
The above time series updates the running PPI line for “Total Final Demand.” The current 6.5% for May is triple the median since 2010 but the real test lies ahead with the questions of where energy markets could take this number. That wholesale effect will include raw materials across the supplier chains, and the pricing pressure at the end of those chains including impacts from freight and logistics costs to inventory costs.
To what extent tariffs might flow into goods pricing and services is also something that must still play out at a lag. Whether trade partners will respond to the latest barrage of tariffs or the US and Mexico will need to react to Trump’s threat to cancel the USMCA is among myriad possible decision points that tie more into geopolitical than rational economic decision making.
One thing is clear, and that is the reality there are no bragging rights in the PPI numbers even on a core basis. The same was true for CPI (see CPI May 2026: The 4% Rubicon 6-10-26).
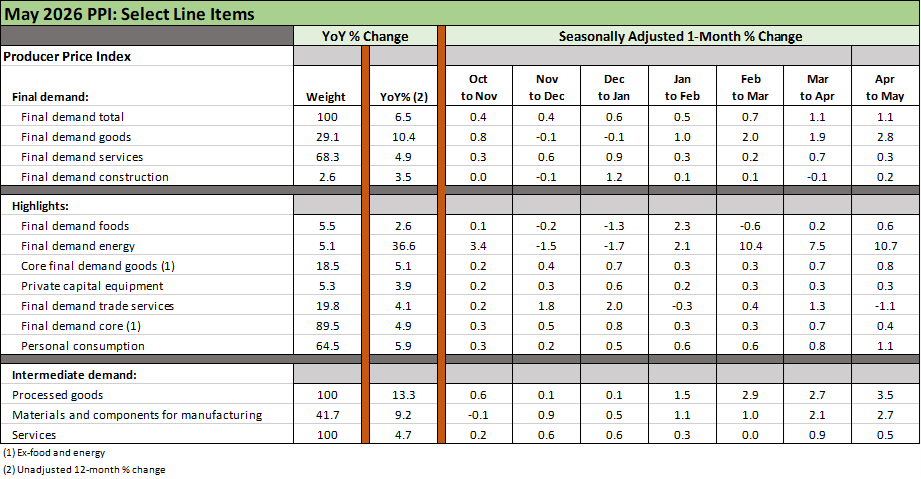
The above table breaks out some of the important PPI metrics that we monitor plus a few smaller line items we like to watch (Construction, Private Capital Equipment). The PPI provides a stunning and lengthy range of metrics across over 20 pages in the release tables.
The YoY column tells a story of deteriorating inflation trends. Total PPI Final Demand has again delivered 6% handle numbers with 6.5% for May. The trend underscores the distinctly negative direction of underlying cost pressures along the chain from PPI to PCE/CPI.
We now have a backdrop where the flow-through of the above cost pressures will lead to higher costs and this means either higher prices or narrowing margins. Protecting margins from PPI pressures or tariffs can also bring cost reductions (layoffs, store/plant closings, capex cuts, etc.). That is where the stories need to be researched at the industry and company level.
The equity and bond market reaction have been relatively muted in returns around these inflation threats as we cover in other commentaries (see Market Commentary: Asset Returns 6-8-26). The UST has been climbing over the trailing month and YTD as we detail in the asset return recaps. Iran and Trump escalating will not help UST prospects.
The “Vegas line” over at FedWatch has essentially wiped out the odds of a cut in 2026. The chance of the FOMC acting on 1 cut by the Dec 2026 FOMC meeting as we go to print is 0.5% while the odds of 3 hikes is at 4.6%. That is not pretty. The leaderboard shows 1 hike posting the highest odds at 43.3% followed by “no change” at 28.9% and 2 hikes at 22.4%.
Warsh is in for a ride. Trump may need plastic bottles for the ketchup.
See also:
CPI May 2026: The 4% Rubicon 6-10-26
Market Commentary: Asset Returns 6-8-26
Remembering D-Day: June 6, 1944
Employment May 2026: Big Rebound, Low Multiplier Bias 6-5-26
The Fall of CBS 6-3-26
JOLTS April 2026: A Modestly Positive Turn 6-2-26
Retail Signal Read Part Deux 6-1-26
Market Commentary: Asset Returns 5-31-26
New Home Sales April 2026: Slow Start to Spring 5-28-26
PCE Inflation: Income and Outlays April 2026 5-28-26
GDP 1Q26 Second Estimate: Shrunk in the Dryer 5-28-26
Retail Equity Comps: Looking for Signals 5-26-26
Housing Starts April 2026: Soft Starts in Single Family 5-22-26
D.R. Horton: Financial Powerhouse Despite Cyclical Softening 5-20-26