


Did Little Marco set me up?
The week saw a meltdown of an already struggling Trump-Iran MOU process that had been a cluster of circles from the outset. Oil has remained remarkably contained given the reality that framing the supply side of the ledger is a bit of a moonbeam at this point as is how the market will price the forward risk factors.
The week will bring CPI and PPI data with more eyes looking ahead to how oil might play out with the highly uncertain response of Trump to the Iran challenge and how the later summer supply-demand balances get handicapped and what it all might mean for the UST curve. Higher oil would in theory mean stubborn inflation expectations and steepening risk.
As of Sunday morning, the FOMC odds of fed funds easing per FedWatch CME models are not likely to make Trump happy. The odds of 1 cut by the Dec 2026 FOMC meeting date are at 0% while the odds of 4 hikes are higher than that at +1.6%. The odds of no fed funds actions stand at 14.6% while 1 hike is 37.8%, 2 hikes 33.7%, and 3 hikes 12.3%. The next leg of the oil journey with a theorical Iran deal will not make curve odds an easy exercise even if hikes will remain the consensus.
Housing remains under a cloud on mortgage rates while financing costs for consumer purchases will see little relief. The 30Y mortgage rate stood at 6.64% as of late Friday per the Mortgage News Daily survey with the Freddie Mac benchmark set at 6.49%. Seeing such funding costs set against negative real wage growth is not a friendly macro backdrop for the home stretch in 2026. Add in health care premium stress in a “low hire” market and the GDP relief on the PCE line is still hard to see.
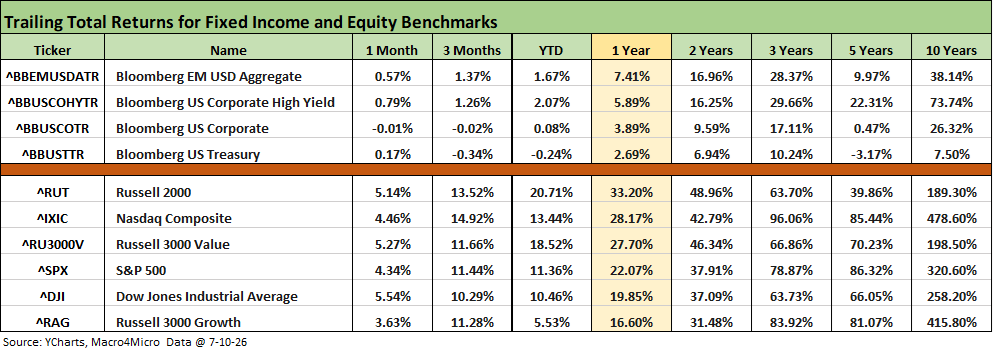
The above table updates the running timeline returns for the debt and equity benchmarks we monitor. We see the adverse duration effects of the UST curve action in the UST benchmarks and also the negative return impact on the long duration IG Corp index. The UST benchmark is negative for 3 months and YTD with only +2.69% for the trailing 1-year for UST. We break out the UST deltas in the next series of charts.
Equities posted very solid numbers for 1-month, and we see rolling 3-month returns that are better than many full years. The trailing 1-year has been well ahead of the long-term returns on the equity asset class but impressively so in the case of growth stocks and related benchmarks.
The Russell 2000 index has posted very strong returns for 3 months, YTD, and 1 year. The returns on the Russell 2000 benchmark are ahead of the large caps YTD and over the trailing 1 year despite some dazzling tech subsector returns. As we cover in the tech charts further below, tech has seen some massive winners in the semiconductor space and across the AI ecosystem broadly, but some major setbacks in software and SaaS services have undermined headline tech returns. The Mag 7 performance has generally been less than magnificent as we have covered in past commentaries.
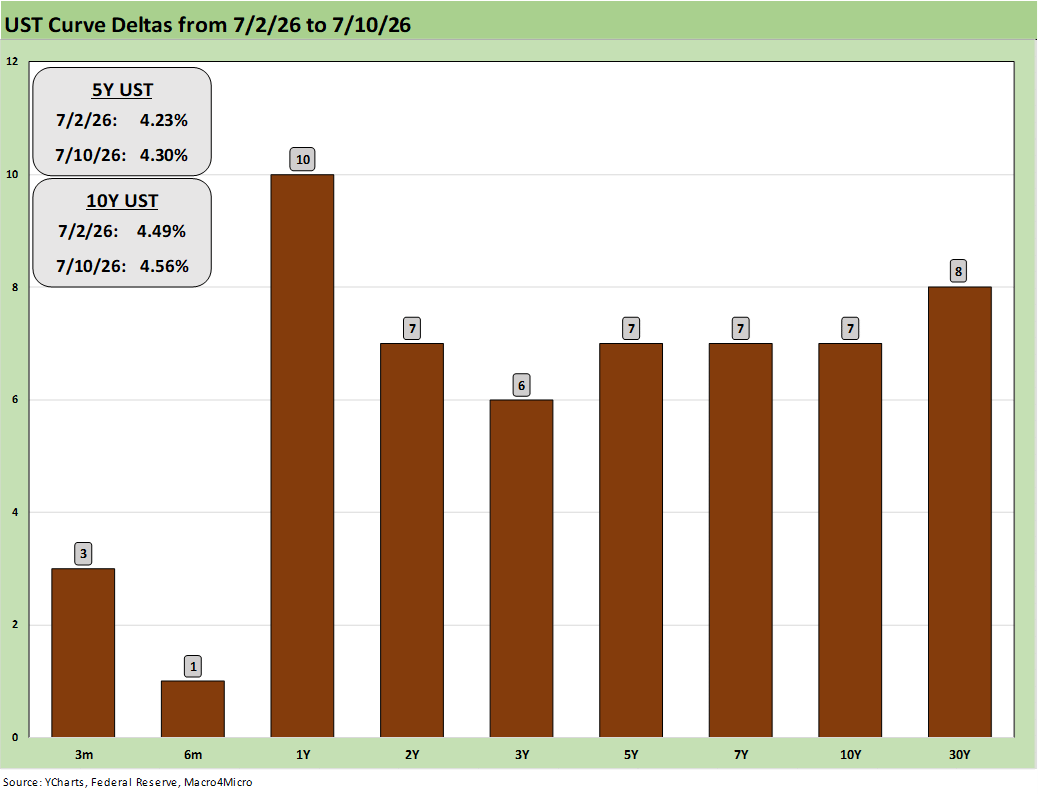
The UST curve had another challenging week as noted above with the yield curve move higher undermining bond ETF returns. With the Iran MOU in disarray and the “ceasefire over” (the term “ceasefire” has had a very loose definition so far), there will be a fresh round of handicapping around how the Strait will play out. There will also be considerable uncertainty on when crude and refined product inventory rebuilding (especially China demand) could ramp up ahead the fall.
This week we get fresh CPI and PPI data. The UST curve will get a fresh test. While the headline and core numbers dominate the conversation, the product line items are something we always like to focus on. Some CPI lines show very little connection to reality and the household cash flow experience (e.g. health insurance “deflation” and “owners’ equivalent rent”). Electricity will remain under scrutiny with all the power and data center headlines. It is about a lot more than oil and gasoline costs with raw materials and freight and logistics costs (see Producer Price Index May 2026: Too Many “Since 2022” References 6-11-26, CPI May 2026: The 4% Rubicon 6-10-26).
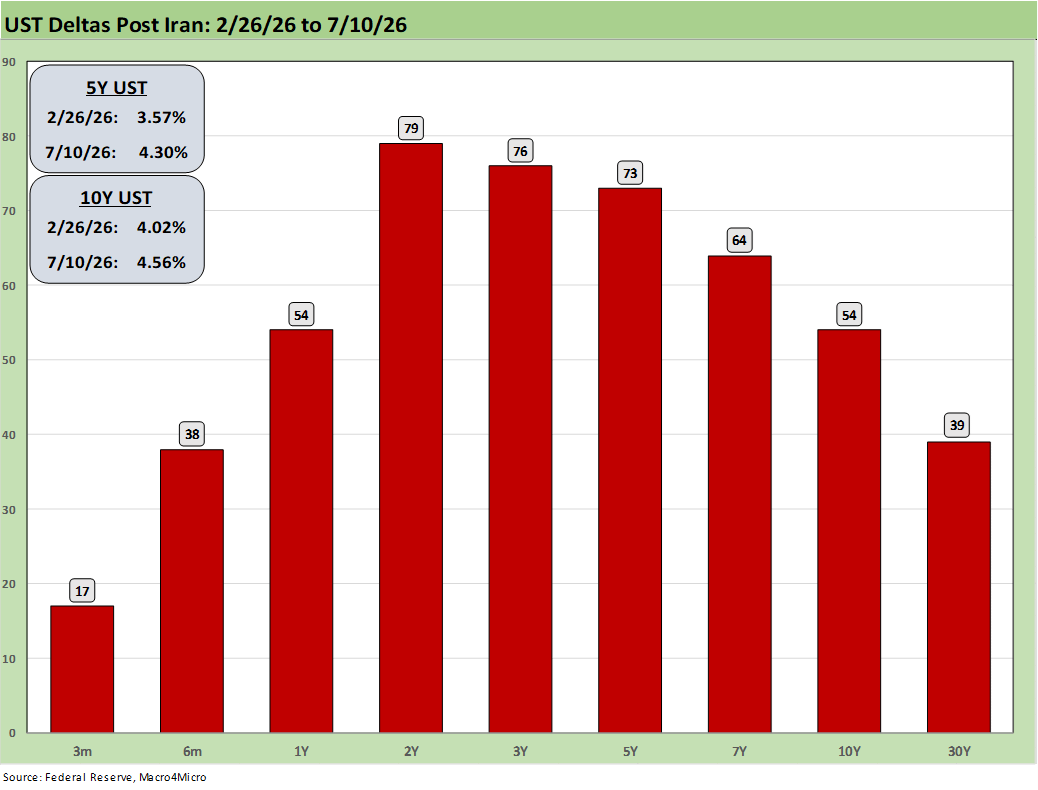
The above chart updates the post-Iran UST deltas and the ugly bear flattener that unfolded from 2Y to 10Y/30Y. The inflation that ensued and hit 4% handles makes a statement on incompetent governance in economics and geopolitics. We also see no shortage of disinformation out of Washington and the “talking econ heads” on energy and tariffs and what it all means in the unit cost and pricing transmission mechanism.
We cannot get factual and conceptual commentary on how this will all play out across the product and services lines when the President will not admit the buyer writes the check for the tariff cost. His policy and economist bobbleheads just fall into line denying simple facts and economic reality.
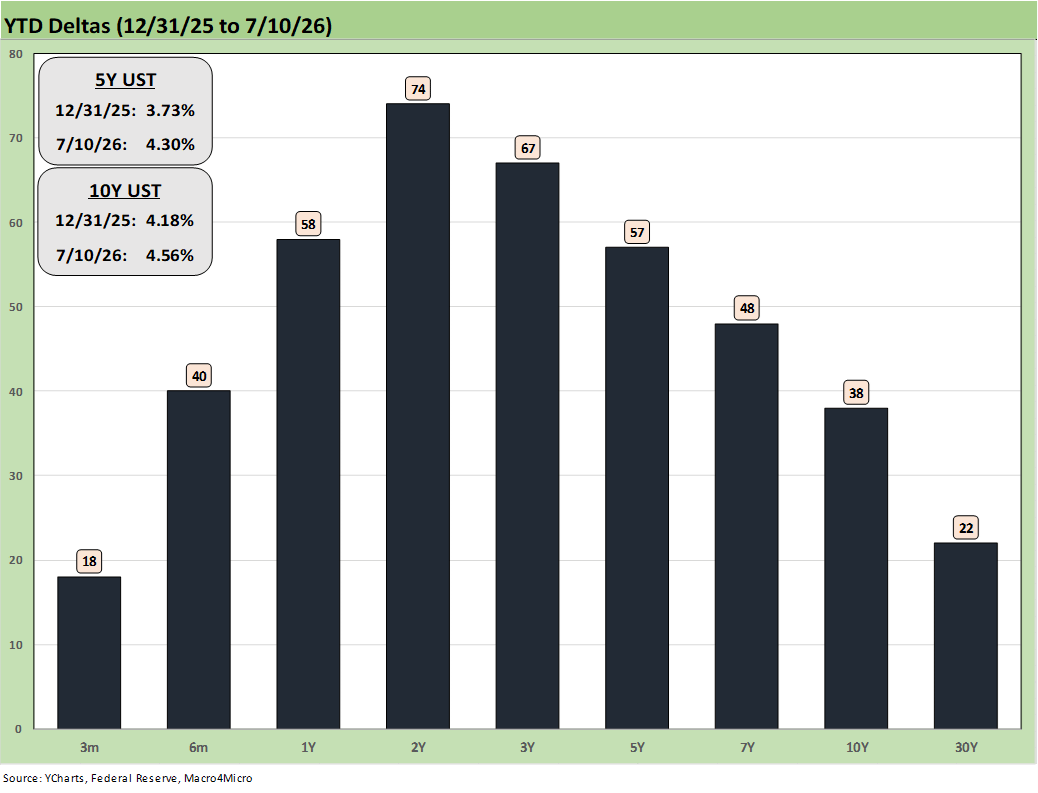
The above table updates the YTD numbers for the UST deltas. The bond ETF returns see 5 of the 7 bond ETFs in the bottom quartile as we cover further below in the charts. For YTD, we see 3 of the 7 bond ETFs have negative returns on the duration impact.
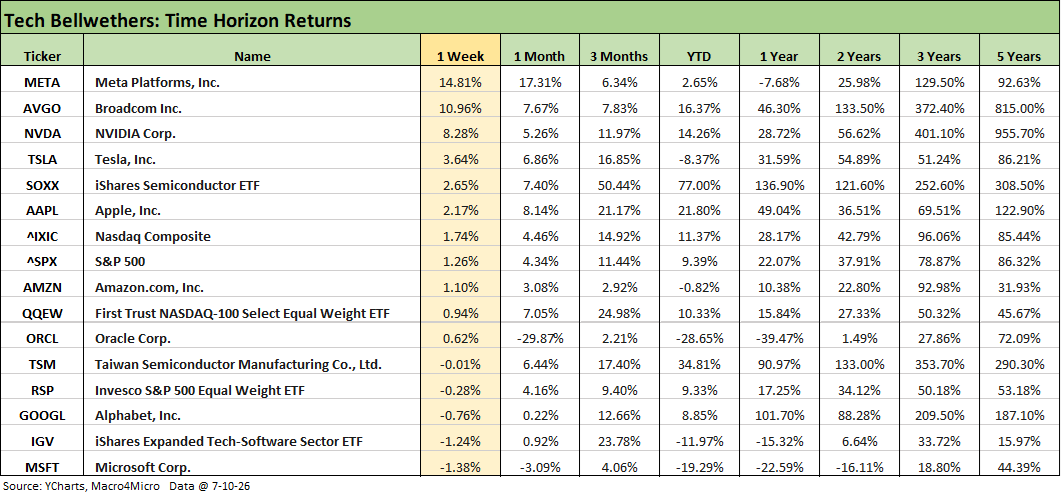
The above table updates the tech bellwethers and broad benchmarks. We add some more single names in the return tables further below, but the above table includes Mag 7 plus the volatile Oracle (ORCL) with Broadcom (AVGO) and Taiwan Semi (TSM).
The “Mag 7 +3” had a decent week with Meta turning in an unusual banner week in what has been a poor year vs. many bellwether tech names that we break out below in the ‘tech check” return timelines. The table shows META, AVGO, NVDA, TSLA, and AAPL ahead of the NASDAQ. MSFT continues to struggle with Alphabet (GOOGL) also in the red this past week. Taiwan Semi also lagged.
The following is a cut and paste of our LinkedIn post on Saturday with some edits:
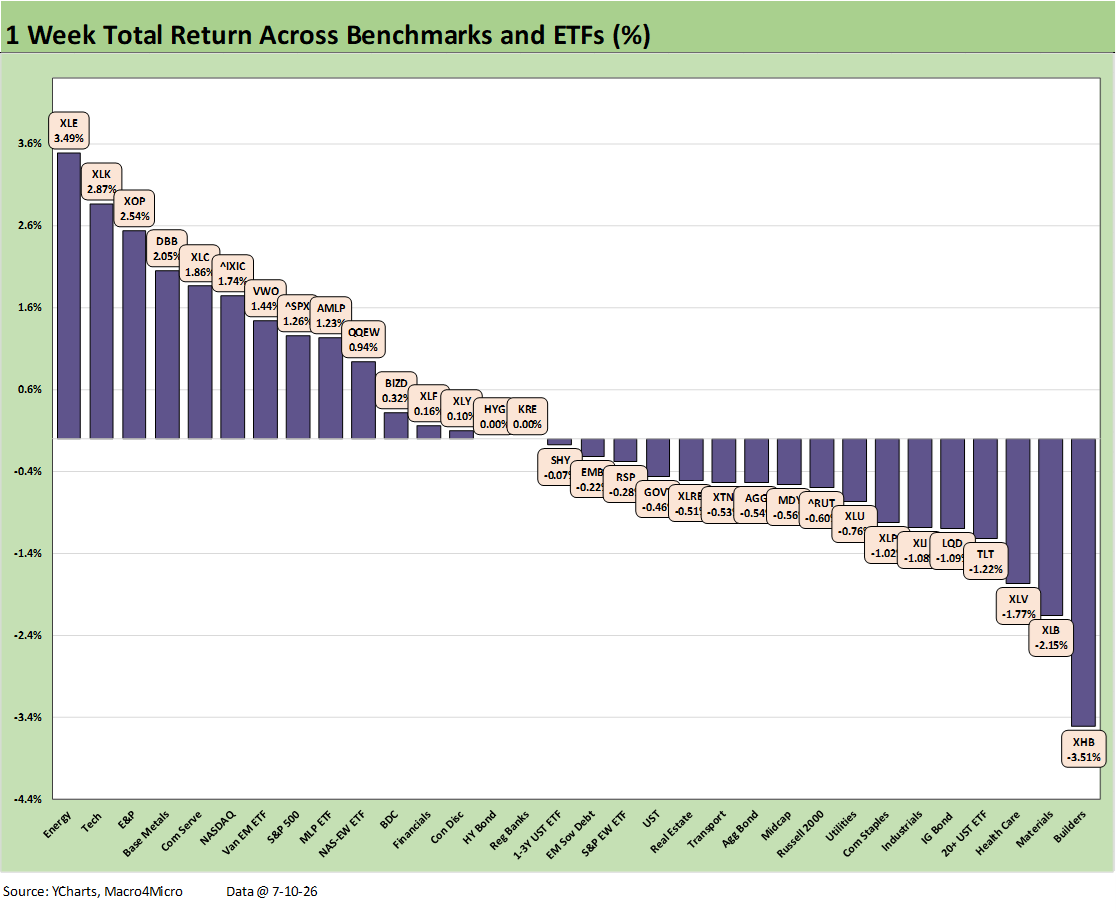
The chart updates the weekly total returns for the broader group of 32 benchmarks and ETFs we monitor. As we see in the chart, it was a mixed week with a score of 15-17 for positive-negative. That includes 6 of 7 bond ETFs in the red (only HY was positive) with duration taking a hit on an adverse UST move.
Both the S&P 500 and NASDAQ large cap benchmarks were positive and in the top quartile. The Russell 2000 small caps and Midcaps (MDY) were in the bottom of the 3rd quartile in negative return range. The S&P 500 saw 6 of its 11 sectors in the red with the critical larger sectors posting positive returns (notably Tech, Financials, Consumer Discretionary, Communications).
We see Energy (XLE) at #1 along with E&P (XOP) at #3 in the top 3 as oil rebounded modestly on the Iran setbacks. The Tech ETF (XLK) rallied to #2 on the partial tech rebound that saw semiconductors rally along with some AI ecosystem names in a partial comeback from the recent selloff. Meta (META), Broadcom (AVGO), and NVIDIA (NVDA) had very strong weeks.
Meta was caught up in AI headlines for a big week at +14.8%. First the big rally came in news around META AI model releases and new cloud initiatives. Meta reported to be launching a cloud business to sell excess AI capacity. Then on the weekend Meta pulled an AI offering back that would allow all types of privacy violation high jinks by tapping into Instagram. We will see how the market sorts that out in what has generally been a poor performer YTD in returns.
As we cover in our separate Tech Check return commentary, there were still plenty of bottom dwellers this week in the software and SaaS side of the subsector mix. The Software ETF (IGV) posted a -1.24% with the Semiconductor ETF (SOXX) at +2.65%.
Cyclicals and rate-sensitive ETFs dropped into the bottom quartile with Homebuilders (XHB) dead last as the UST curve backed up ahead of this coming week’s CPI and PPI numbers. Existing home sales were weak again as median home prices hit an all-time high and inventories declined. That is not going to help the affordability story as monthly payment strain is still tied to the UST curve. Mortgage rates ended the week over 6.6% (Mortgage News Daily survey) and 6.49% for the weekly Freddie Mac 30Y.
In the bottom quartile, we see duration hit with the long duration UST 20+Y ETF (TLT) in the bottom 4 joined by the longer duration IG Corp ETF (LQD). Interest rate sensitive sectors such as the dividend-heavy Consumer Staples ETF (XLP) and Utilities ETF (XLU) were also in the bottom tier. The cyclical Materials ETF (XLB) and Industrials ETF (XLI) also lagged in the curve and Iran news. Earnings season picks up with a wave of banks this week.
The following is a cut and paste of our LinkedIn post on Saturday with some edits:
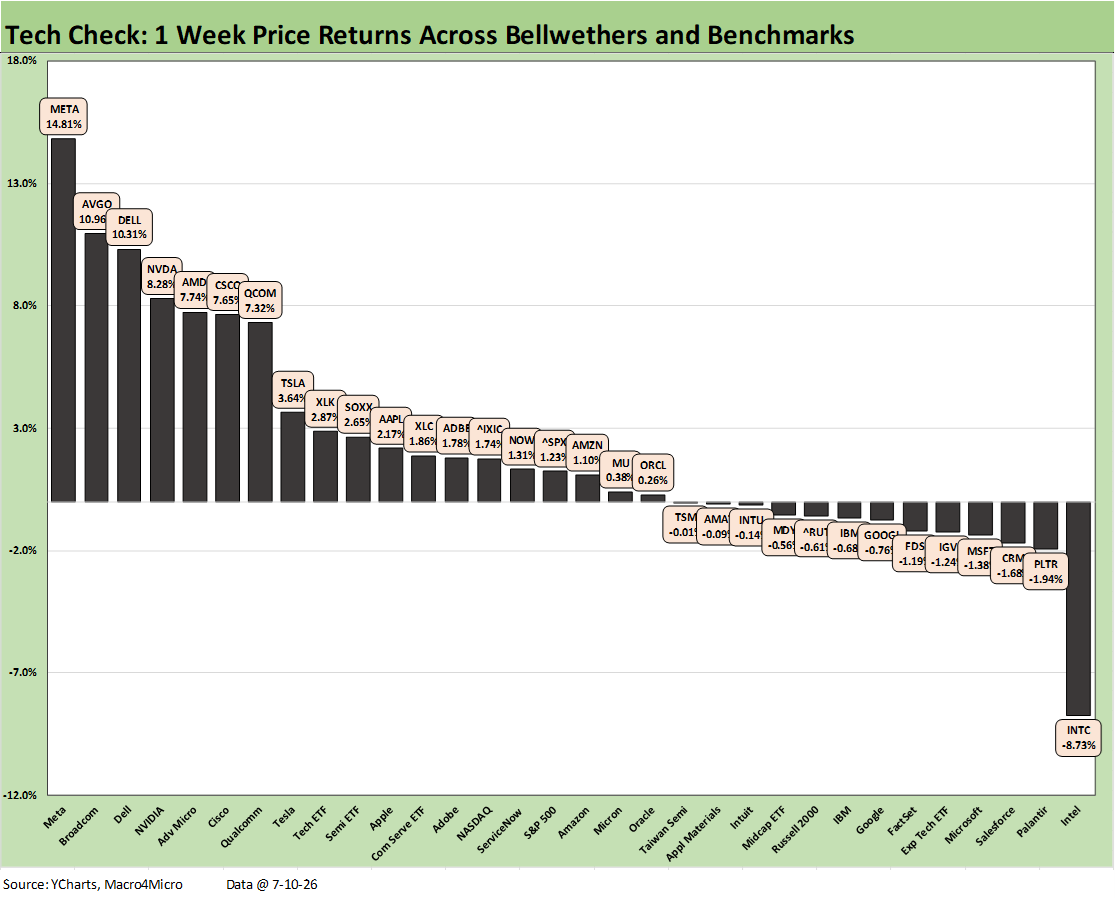
The chart updates the price returns for the “tech check” mix we monitor each week. The score for the week was 19-13 in a spotty performance for the bellwethers that are spread across the quartiles. That includes 3 of the Mag 7 in the top quartile. For the trailing 1-month period, only Meta and Apple are in the top quartile.
The volatile swings of June are entering July with a partial reprieve as both the Semiconductor ETF (SOXX) at +2.65% and the Tech ETF (XLK) at +2.87% were both positive while a modest negative for the Software ETF (IGV) at -1.24% saw more software and SaaS names leading the count in the bottom quartile.
The outliers on the week included Meta (META) at #1 in a rare banner week of +14.8% for a name that YTD sits in the middle of the 3rd quartile at +1.38% and well below the median return for the group YTD of just under +12%.
The other outlier on the rolling post-holiday week was Intel (INTC) at -8.73%. The good news for INTC holders is that the company still weighs in at #3 YTD at +197.7%. INTC is still positive for the rolling 1-month period at +2.62% after this week’s selloff.
The low quartile is still more heavily weighted in the software and SaaS-based services names that have been plagued by the AI displacement fears of recent weeks and months. Away from INTC as an outlier, the bottom quartile includes Palantir (PLTR), Salesforce (CRM), Microsoft (MSFT), the Software ETF (IGV), FactSet (FDS) and IBM as a mixed business line operator that has swung around in the weekly rankings.
For the Mag 7, we see MSFT and Alphabet (GOOGL) in the red in the bottom tier with the other 5 of the Mag 7 in positive range including Amazon (AMZN) at the top of the 3rd quartile, Apple (AAPL) in the 2nd quartile, and TSLA, NVDA, and META in the top quartile. Meta’s model announcements and cloud business headlines sent META to a rare big week.
As noted in our other comments, “Meta pulled an AI offering back that would have allowed all types of privacy violation high jinks by tapping into Instagram. We will see how the market sorts that out in what has generally been a poor performer YTD in returns.” META is still mired down in the low positive range YTD where it ranks #5 in YTD returns among the Mag 7.
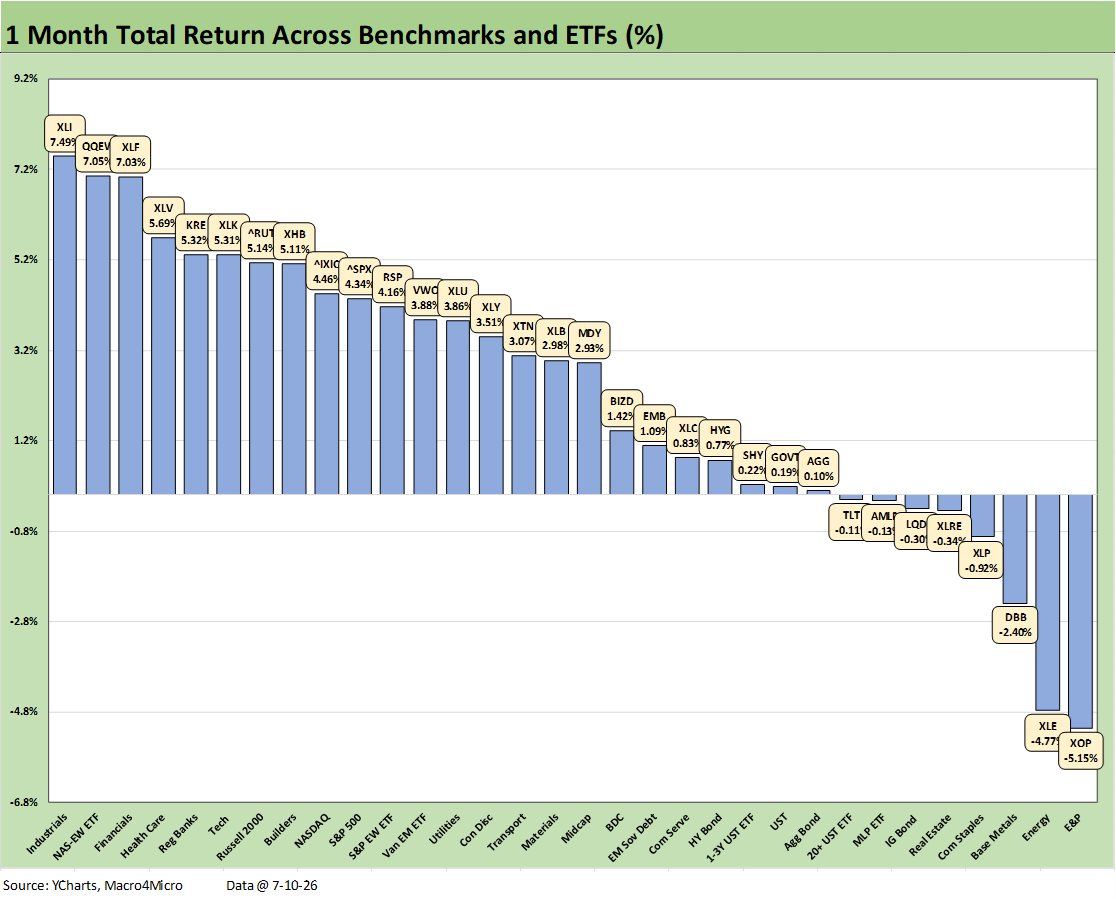
The 1-month score of 24-8 featured a diverse mix in the top quartile lead by Industrials (XLI) with both Financials (XLF) and Regional Banks (KRE) in the mix along with the Russell 2000 small caps. We take that as a constructive commentary on the cycle and asset quality despite the inflation headwinds and less supportive FOMC prospects.
We see E&P (XOP) and Energy (XLE) in the bottom tier along with Base Metals (DBB) facing some setbacks in commodity pricing. That could change quickly if the Strait disruptions get worse and the supply turmoil is sustained in coming days.
The UST curve has been a setback of late as evident in the bottom tier with dividend heavy equities such as Consumer Staples (XLP) and Real Estate (XLRE) getting treated as bond surrogates and the long duration UST 20+Y ETF (TLT) in the red along with the IG Corp ETF (LQD).
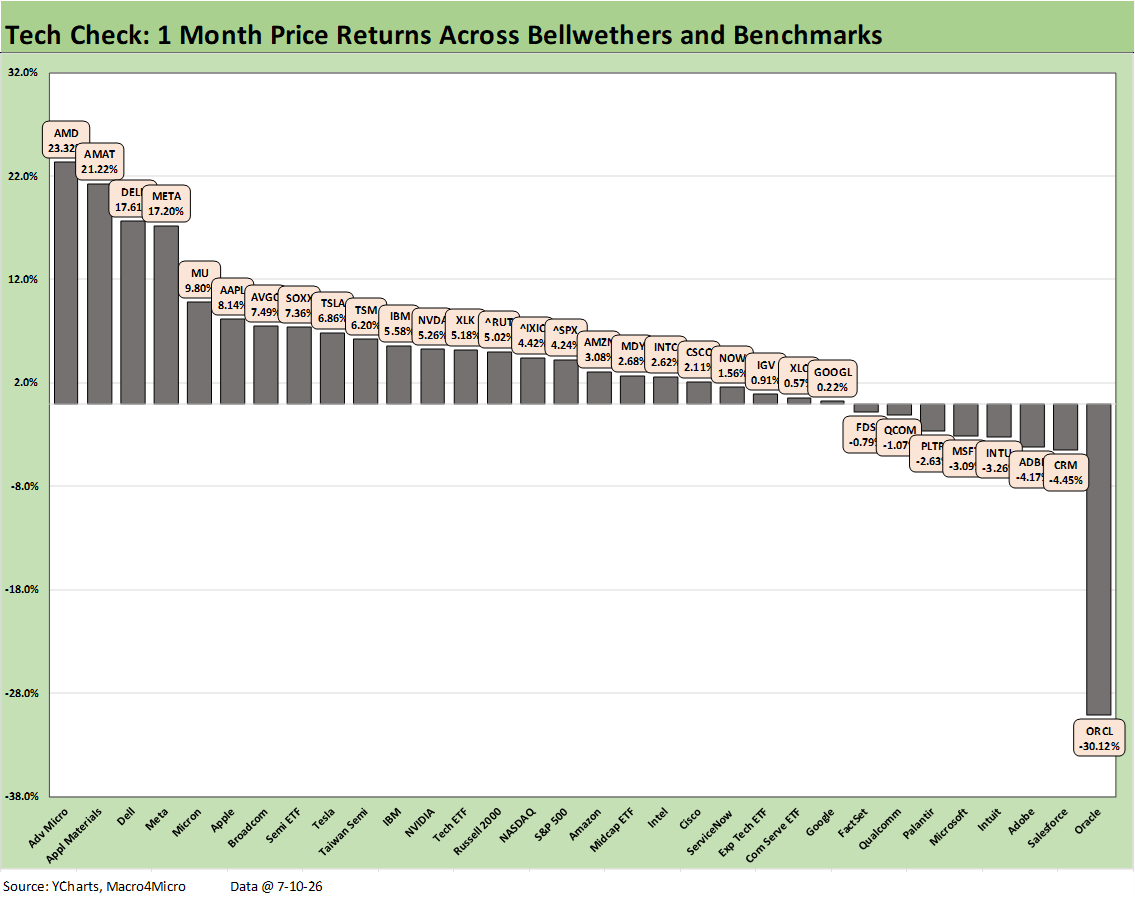
For the 1-month tech check mix, we see a 24-8 score with software and SaaS-based services names taking a beating again in the red zone. ORCL continues to get periodically pummeled with a -30.1% rolling month. ORCL remains mired in the bottom quartile YTD at -27.8%.
The 2nd to last return and those above were less troubling with Salesforce (CRM) at -4.45% in a crowded software mix. One outlier in the bottom tier was Qualcomm (QCOM) at a slight negative, but QCOM remains in the 3rd tier YTD at +10.6% in a tight group with the S&P 500, META, and AMZN.
The rebound in the semiconductor and AI ecosystem names keep the divergent subsector performance trend in place. Advanced Micro (AMD) took #1 and remains in the top 5 YTD as discussed below. AMD was followed by Applied Materials (AMAT), and Dell (DELL) with Meta (META) posting a banner week that pushed it into the top tier for the month. The Meta rally was in part tied to AI model news as discussed in the earlier 1-week recap above.
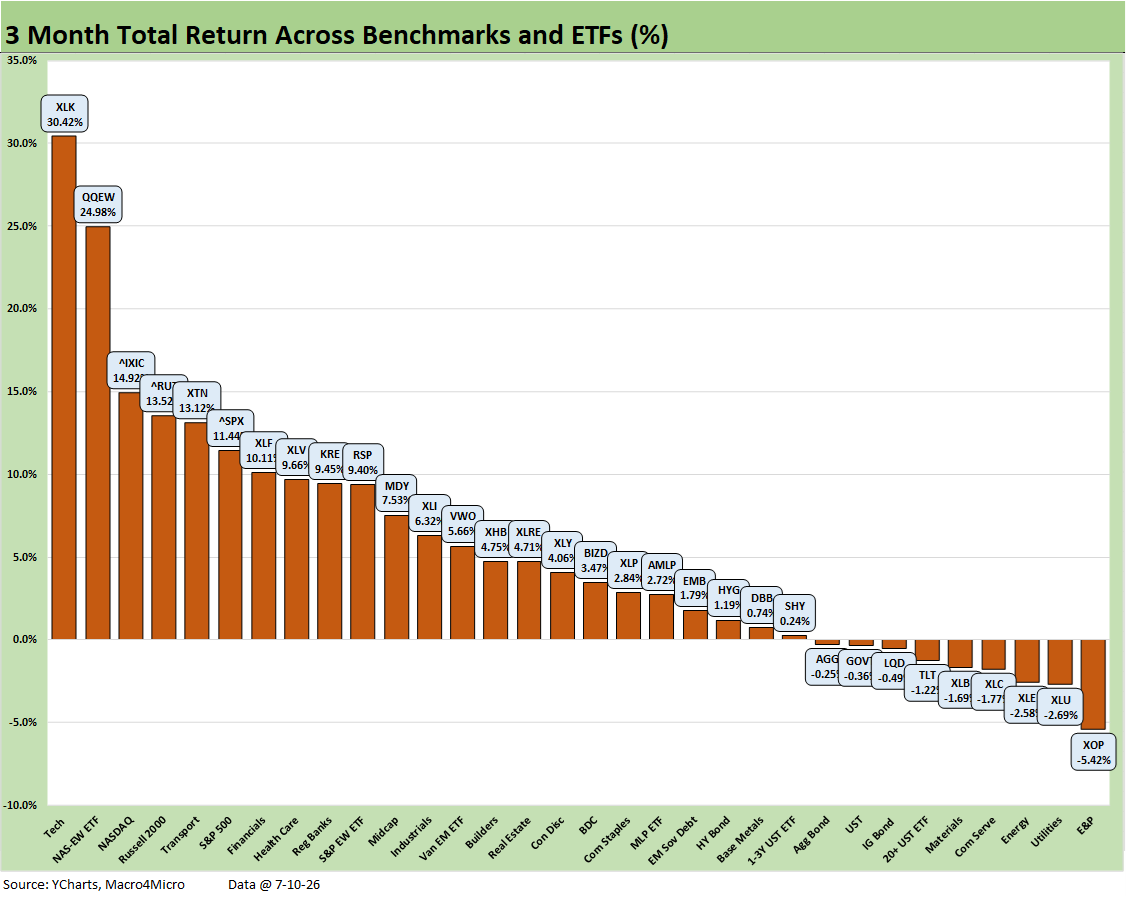
We include a rolling 3-month recap for the broader mix of benchmarks and industries, and we see a score of 23-9. E&P (XOP) and Energy (XLE) join some of the more curve-sensitive ETFs in the bottom quartile including 3 bond ETFs (TLT, LQD, GOVT) along with the Utilities ETF (XLU). The Communications Services ETF (XLC) presented a very mixed performance by single names with Meta and Alphabet performing well but names such as Netflix, Comcast, T-Mobile, and Warner Brothers dragging it down.
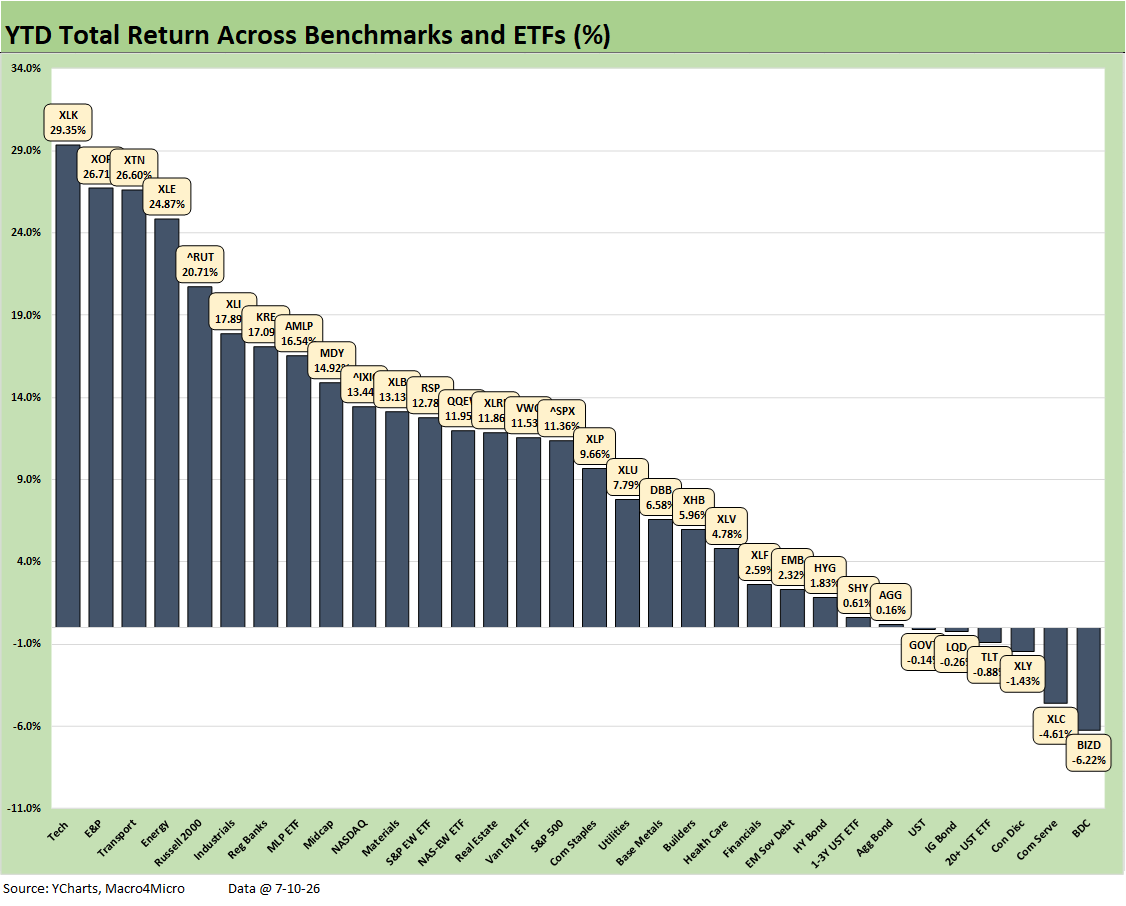
The YTD returns for the 32 benchmarks and industry groups posted a 26-6 score. That very favorable mix reflects the breadth of the positive performance even if the headline benchmarks were heavily wagged by semiconductors and AI related valuation trends. A median return along the asset lines of 10.5% for the period through July 10 is a very impressive run rate.
The weakness in Consumer Discretionary ETF (XLY) is notable and is partly evident in the very weak Personal Consumption Expenditure growth in 1Q26 and the consumer sector soft indicators such as sentiment metrics. There is no hiding from the very grim PCE growth in services as well as goods at +0.5% (see GDP 1Q26 Final: PCE Growth Plunge 6-25-26).
Consumption has been in better balance in the recent monthly Personal Income and Outlays releases, but the plunging savings rate and a broad mix of consumer borrowing metrics are flashing signs of trouble. The health care setbacks in ACA premiums and even loss of health care coverage or shift to higher deductible plans combined with negative real wage increases constitute bad news.
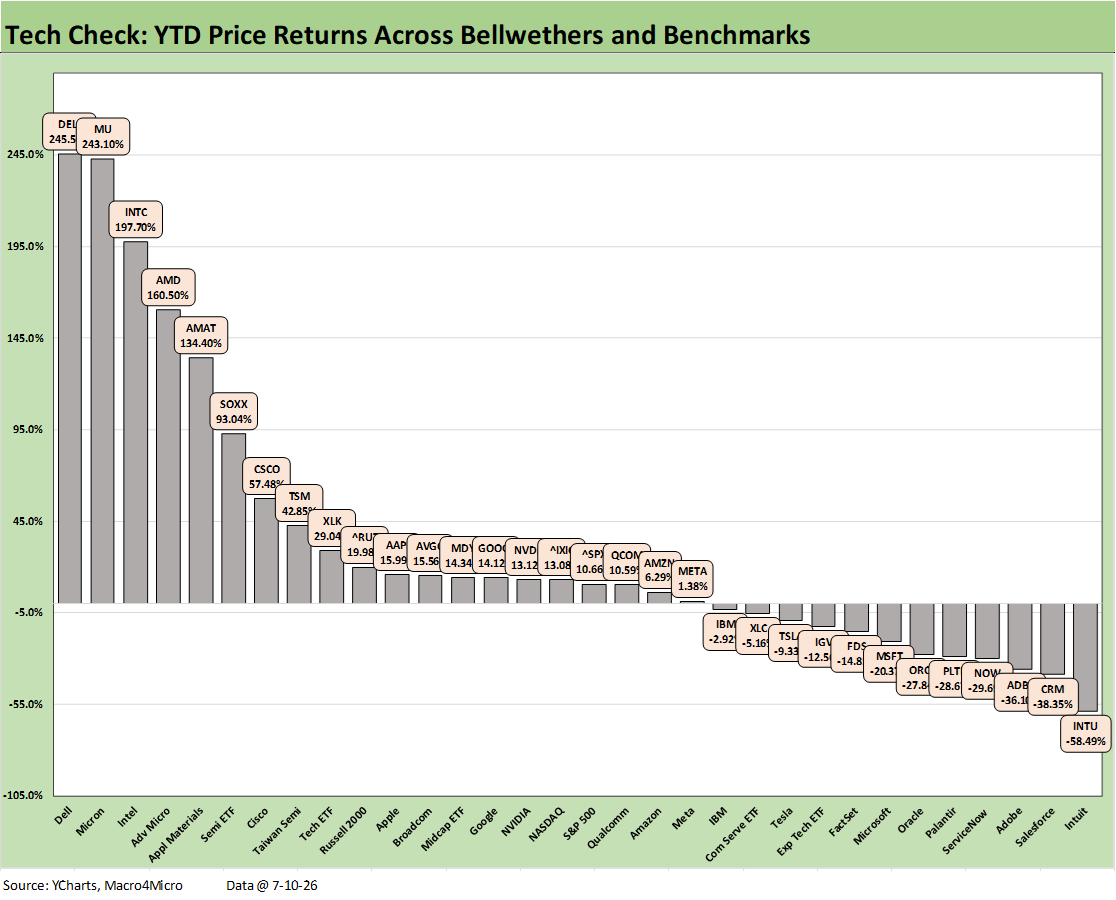
The YTD tech check returns post a score of 20-12 with the entire bottom quartile comprised of software and SaaS-based service operations. We also see the Software ETF (IGV) in the red in the third quartile along with Tesla, Communications Services ETF (XLC), and IBM.
The big winners are the usual suspects with the semiconductor and AI infrastructure beneficiaries. DELL at #1 was not likely to be on many “most likely” lists to start the year for a Top 5 slot in this lineup.
The Semiconductor ETF (SOXX) at #6 and +93.0% boasts a return differential of over 105 points relative to the Software ETF (IGV) at -12.5%. It took a YTD return of +42.8% (Taiwan Semi) to make the top quartile and +134% (Applied Materials) to make the top 5.
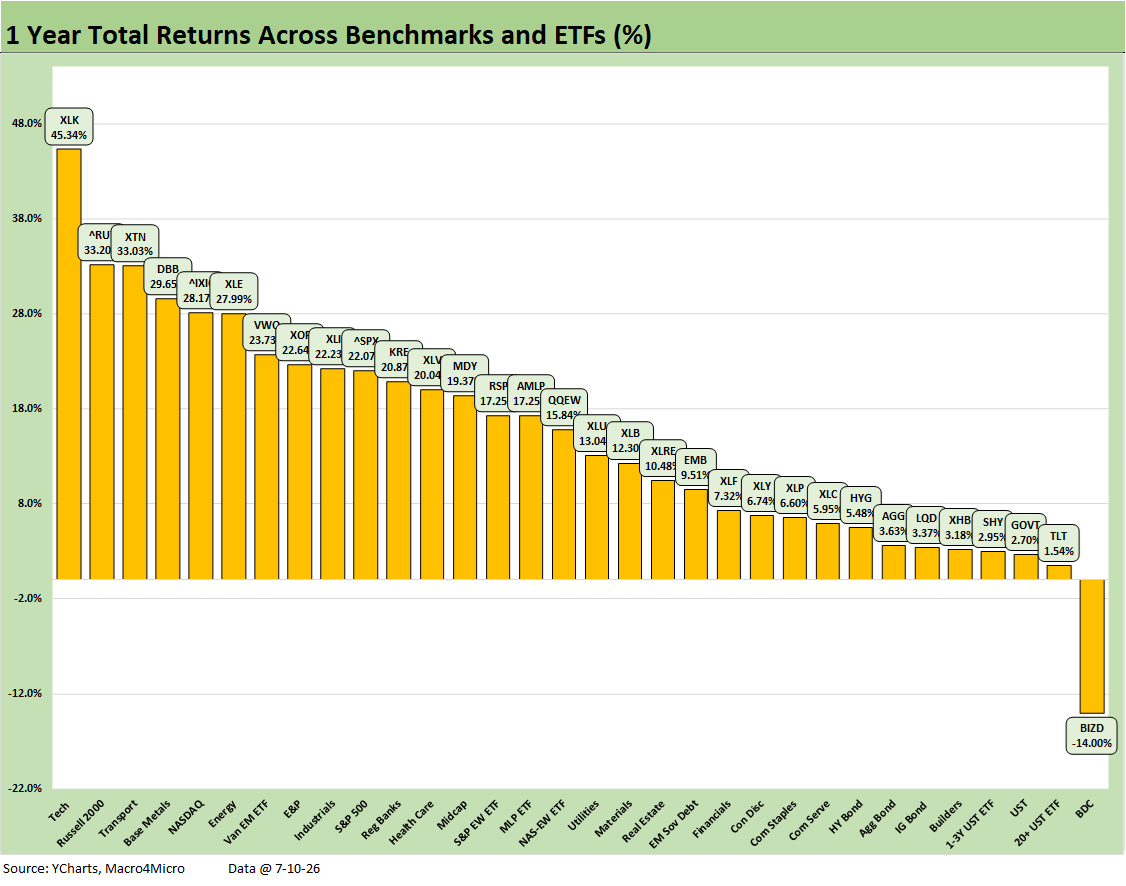
The trailing 1-year return has been holding at a score of 31-1 with only the BDC ETF (BIZD) in the red at -14.0%. We see the Tech ETF (XLK) on top by a material increment at +45.3% vs. the Russell 2000 at #2 with +33.2%. It took 22.6% to make the top quartile while the median for the asset lines was over 14%.
See also:
Existing Home Sales June 2026: The Stall is On 7-11-26
Market Commentary: Asset Returns 7-5-26
Happy 250th Birthday America 7-3-26
Employment Situation June 2026: Back to a Crawl 7-2-26
JOLTS May 2026: Openings Flat, Hires Down, Layoffs Up 7-1-26
Music to Ponder: Hope Rising or Blood Simmering? 6-30-26
The Election Gambit: Economic Risk and Policy Uncertainty 6-29-26
JD Vance and Nixon History: Clueless 6-27-26
Personal Income & Outlays May 2026: Bad Inflation, Balanced Spending 6-26-26
New Home Sales May 2026: Weak Volumes, Stable(ish) Prices 6-25-26
GDP 1Q26 Final: PCE Growth Plunge 6-25-26
Trade Deficits: The Moving Parts and Macro Goals Matter Most 6-24-26
The FOMC Dance: Will Warsh and Trump Find a Rhythm? 6-17-26
Housing Starts May 2026: Weaker for both Single Family and Multifamily 6-16-26
Industrial Production May 2026: Steady, Balanced Utilization Levels 6-15-26
Geopolitical risk: Trump’s Nuclear Saber Rattling? 6-14-26
Producer Price Index May 2026: Too Many “Since 2022” References 6-11-26
CPI May 2026: The 4% Rubicon 6-10-26
Remembering D-Day: June 6, 1944
Employment May 2026: Big Rebound, Low Multiplier Bias 6-5-26
The Fall of CBS 6-3-26
Retail Signal Read Part Deux 6-1-26