
Employment May 2026: Big Rebound, Low Multiplier Bias
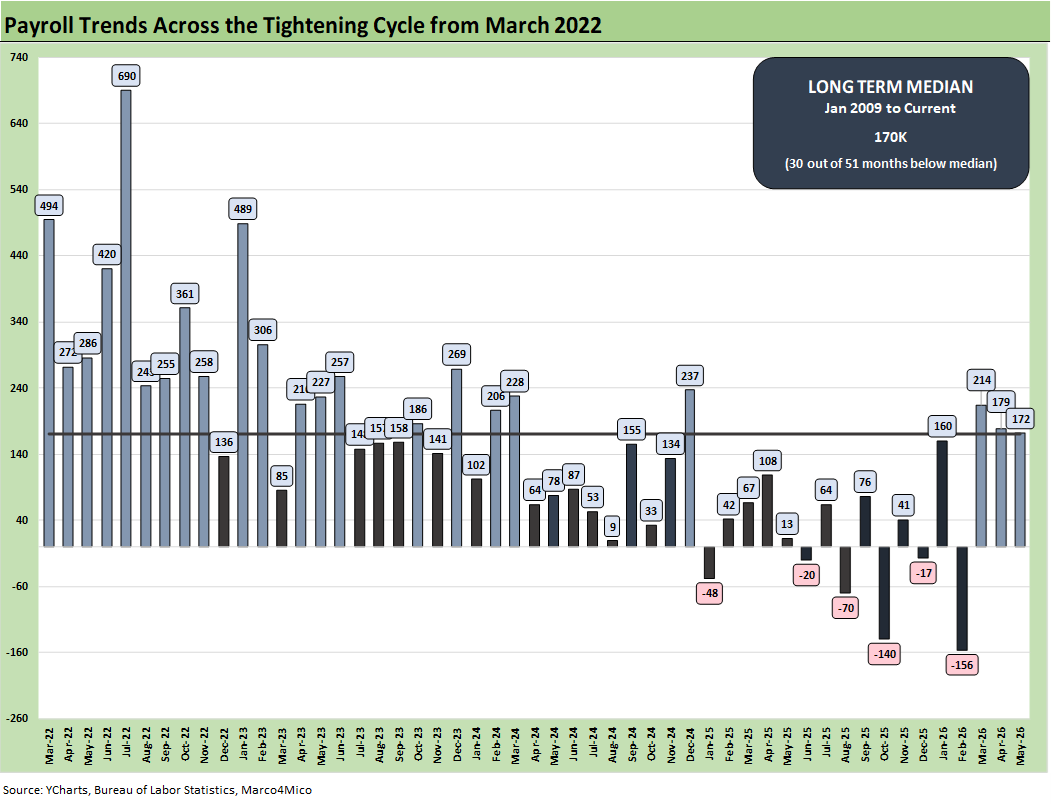
Payrolls crush forecasts on Health Care and Social Assistance, Leisure and Hospitality, and Local Government totaling 172K.


Not the prime-time economic multiplier effects? OK for now.
The massive “beat” vs. consensus on job adds weighed in at +172K for May. The release includes major upward revisions in March (+29K to +214K) and April (+64K to +179K). The unemployment rate was flat at 4.3%.
The payroll additions are dominated by Leisure and Hospitality at +70K, Local Government at +55K, and Health Care and Social Assistance of +47.2K for a total of over +172K just on those three occupation lines. Those are not in the high “economic multiplier effect” category but more paychecks are intrinsically positive.
“Goods” payroll additions of +28K included +17K in Construction, +7 in Manufacturing, and +4 in “Mining and Logging” (primarily E&P). An important note is that Manufacturing was lower YoY by -46K, which for now means the Golden Age onset for manufacturing has not arrived yet. Services rose by +92K, and Government by +52K for the Establishment Survey total payroll additions of +172K (92 Services + 52 Government + 28 Goods).
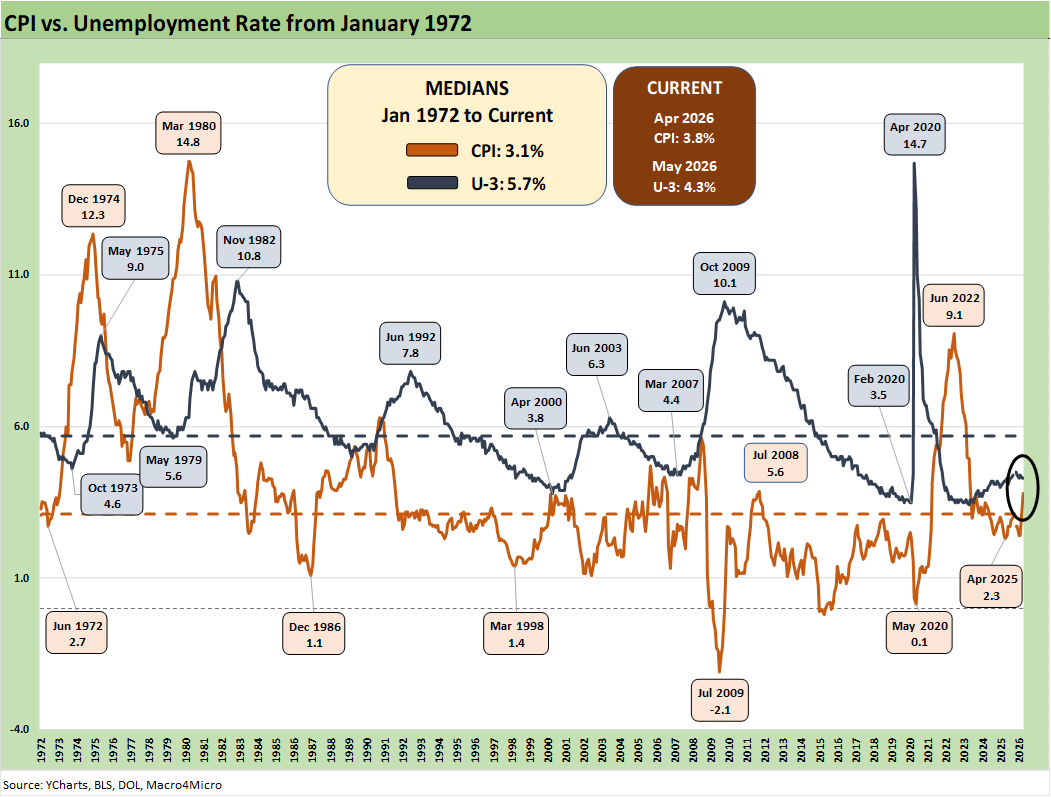
The average hourly earnings increase of 3.4% is not stacking up well vs. the 3.8% CPI in April. Real earnings are also looking grim vs. recent PCE inflation numbers including +3.8% headline PCE and core PCE of 3.3% (see PCE Inflation: Income and Outlays April 2026 5-28-26). The 1Q26 GDP release posted a headline PCE price index for 1Q26 at +4.5% while the core PCE price index ticked slightly higher to +4.4% from +4.3% (see GDP 1Q26 Second Estimate: Shrunk in the Dryer 5-28-26). The story is ugly for real earnings.
In the Household Survey, the report details a decline of -66K unemployed for a total of 7,307K (7.31 million) and a 4.3% unemployment rate (7.31 unemployed/170.1 mn labor force). The number of total employed rose by 149K to 162.77 million.
The JOLTS openings as detailed earlier this week show more of those openings getting filled as we move closer to the summer (see JOLTS April 2026: A Modestly Positive Turn 6-2-26). That is good news for the “paycheck count.” One can make qualitative assessments on the mix of occupations reporting increases in payrolls, but the reported number meet the “MO jobs, MO money” rule to support consumer spending volumes.
Consumer sentiment/confidence has been very low, but the material decline in savings rates can mean a range of things with either (or both) a desire to spend or “a need to borrow” on the list (See PCE Inflation: Income and Outlays April 2026 5-28-26). More jobs always help the backdrop. As of now, inflation exceeds wage growth. That is by definition bad.
The monthly payroll adds/declines chart above starts in March 2022 with the end of ZIRP and the start of the tightening cycle. The bar chart tells an objective data story. The revised +214K for March, revised +179K for April and May print of 172K along with the 4.3% unemployment rate are not only “not easing friendly” for the FOMC but the direction of oil and Iran and Gulf chaos could determine whether the backdrop is “hike friendly.”
As we go to print, the odds of 1 hike by the Dec 2026 FOMC meeting is 43.3% vs. 28.7% for no change. The odds of 2 hikes are up to 22.4%. The odds of 1 cut are +0.8%.
The payroll addition numbers in 2025 and 2026 include the only negative deltas on the chart since March 2022 with 6 months in the red during Trump 2.0. We are now at least seeing some numbers above the post-Jan 2009 median of 170K. That long-term median of +170K includes a slice of the longest recession since the Great Depression, so it is not a high bar to clear.
A glance back at the 2022 numbers offer a reminder of what a high rate of job adds looks like. Of course, the labor backdrop and immigration issues change the overriding variables.
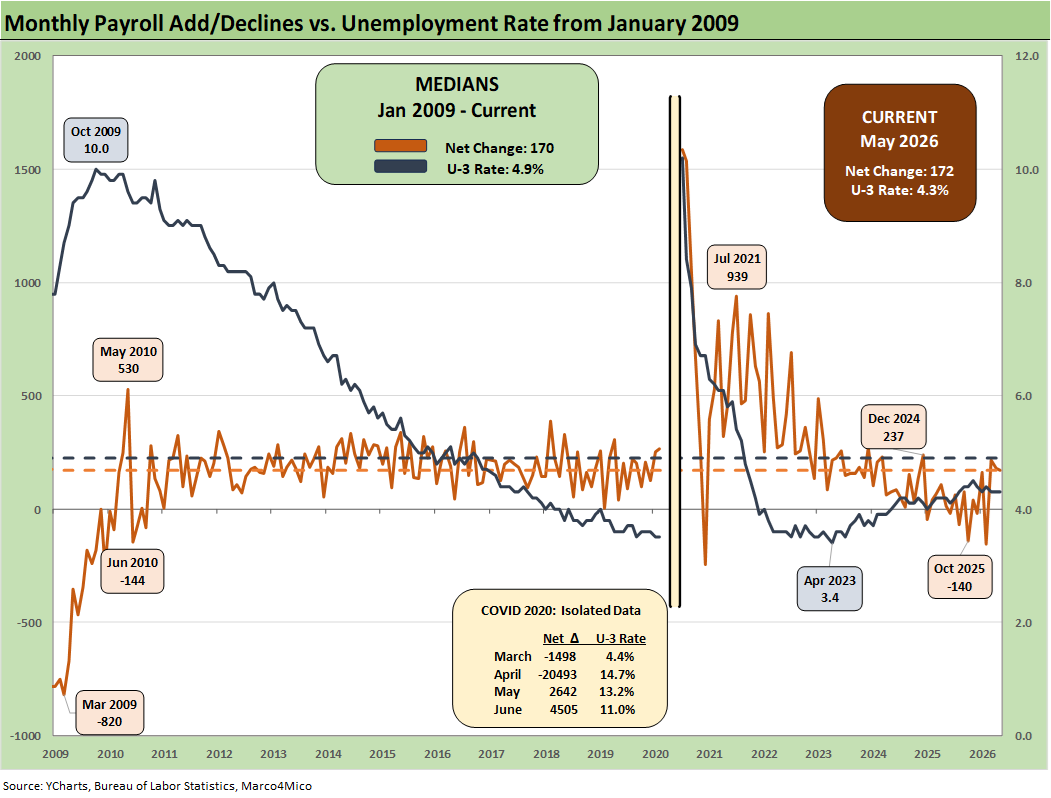
The above chart plots the running job adds/declines since Jan 2009 against the unemployment rate, which at 4.3% would be considered full employment in past cycles. In the chart, we isolate the worst months of the COVID dislocations in the box for better visuals to capture the other periods.
The 4.3% U-3 is below the long-term median from Jan 2009 of 4.9%. Payroll has been struggling somewhat in relative terms, but history is very kind to 4.3%. If the 2025-2026 frame of reference for payroll additions is 2024 (not a good jobs year) then the 2025-2026 numbers are solid (not great). If we compare 2025-2026 monthly adds to the 2022-2023 period, the current job add run rates are weak.
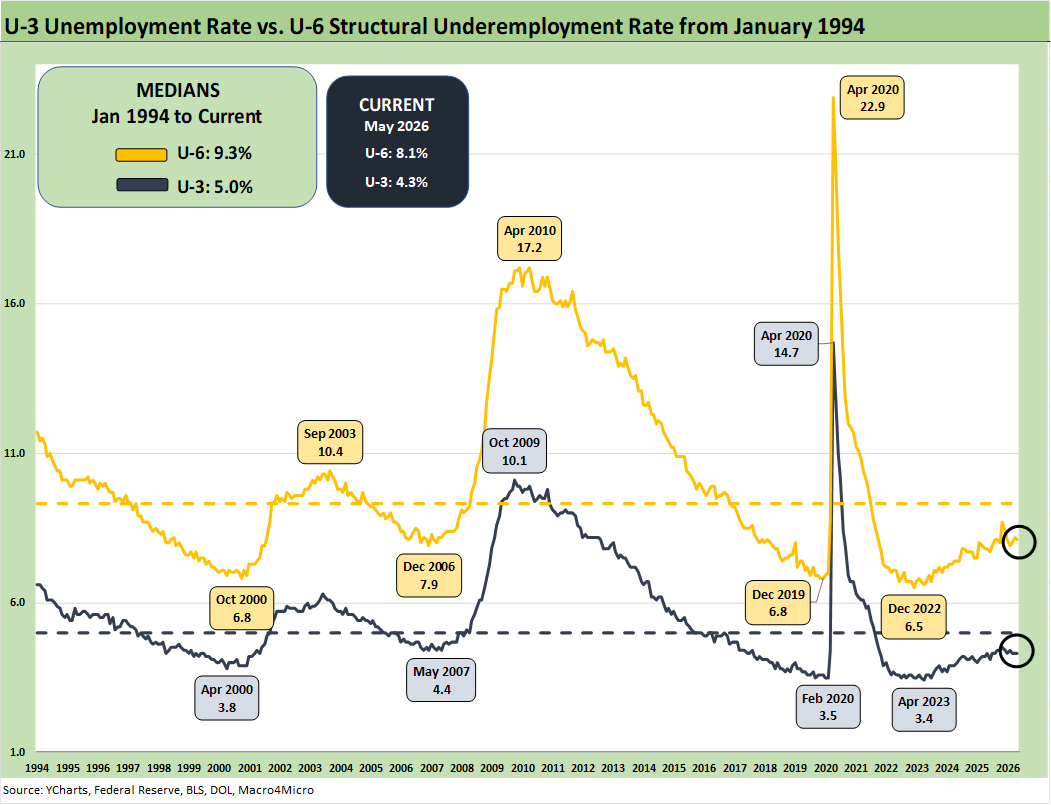
The above chart updates the time series for the U-3 unemployment rate and U-6 structural underemployment rate across the years from 1994.
As a reminder, the U-6 metric is defined with the numerator as “total unemployed + persons marginally attached to the labor force + total employed part time for economic reasons.” The denominator is “civilian labor force + workers marginally attached to the labor force.”
The U-6 is the structural underemployment metric that is always useful to watch. To start 2025, the U-6 rose sharply in Feb 2025 to 8.0% from 7.5% in Jan 2025. The U-6 jumped to 8.7% in Nov 2025 from 8.1% in Sept 2025.
The current 8.1% marks a decline from 8.2% in April but an increase from 7.9% YoY vs. May 2025. The U-6 is well above the 6% handles seen in spring of 2023. The U-6 is still below the median from 1994 of +9.3%, which notably includes the post-crisis shock and the longest recession since the Great Depression.
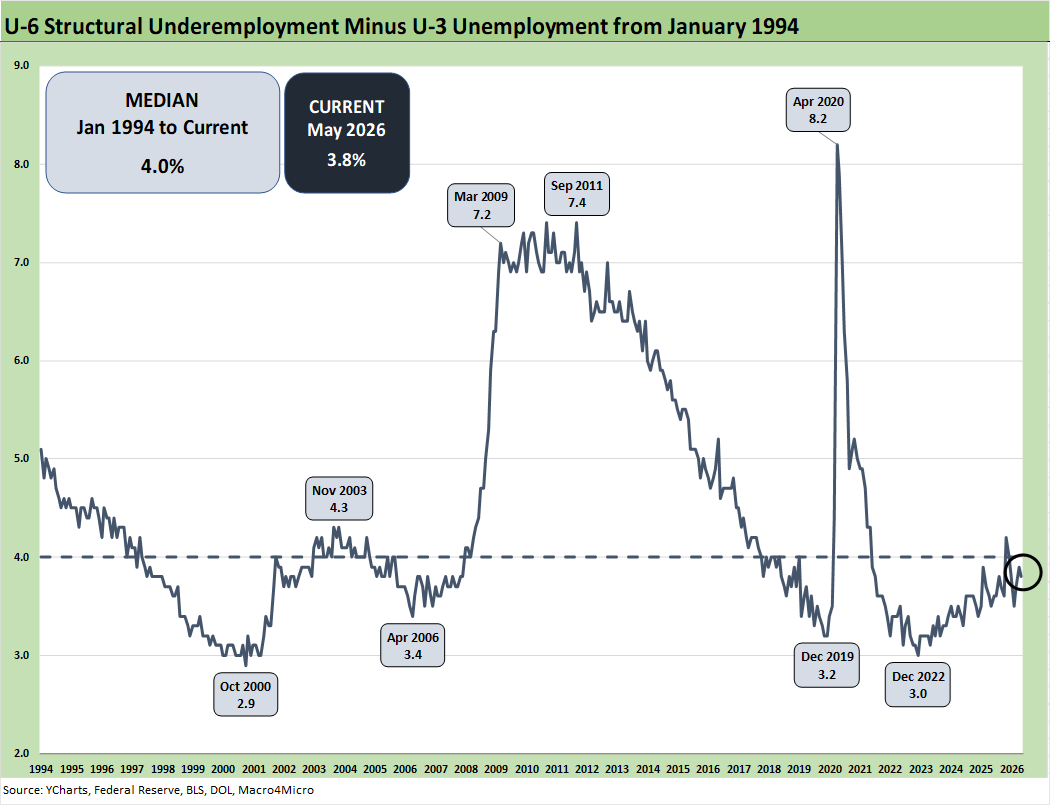
The time series above updates the U-6 minus U-3 differential as a measure of relative employment quality and to flag risks of major dislocations in large swaths of the economy (think oil patch collapse in the late 1980s, tech bubble imploding into a weak 2001-2003, and financial services and automotive meltdown in 2009).
The current 3.8% differential is just below the long-term median of 4.0%. The job ranks are still vulnerable now with the Iran war effects flowing into hiring decisions, industry fundamentals, and FOMC policy planning. The recent rising rate of adds is clearly favorable but do feature some of the occupations in services where major swings come easily. The AI wildcard will remain a critical X-factor on where payrolls head in Services especially.
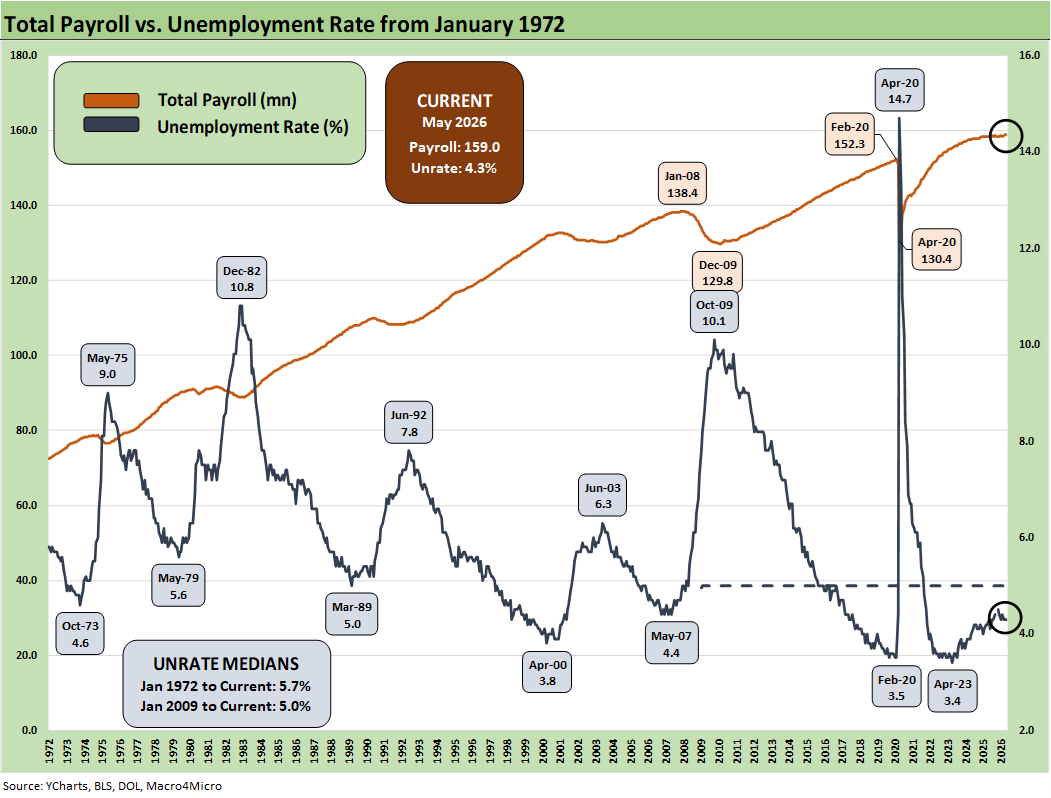
The above chart updates total payroll vs. the unemployment rate. The trend needle has not moved much in 2026 and has been in a narrow range. More bodies with more paychecks are always a good thing. The trick from here is how the consumer deploys that paycheck and whether the zero-sum realities of household budgets undercut spending. The PCE line in the GDP accounts is a critical driver of growth and negative real wage reality a soft leading indicator either on spending or on wage demand pressure.
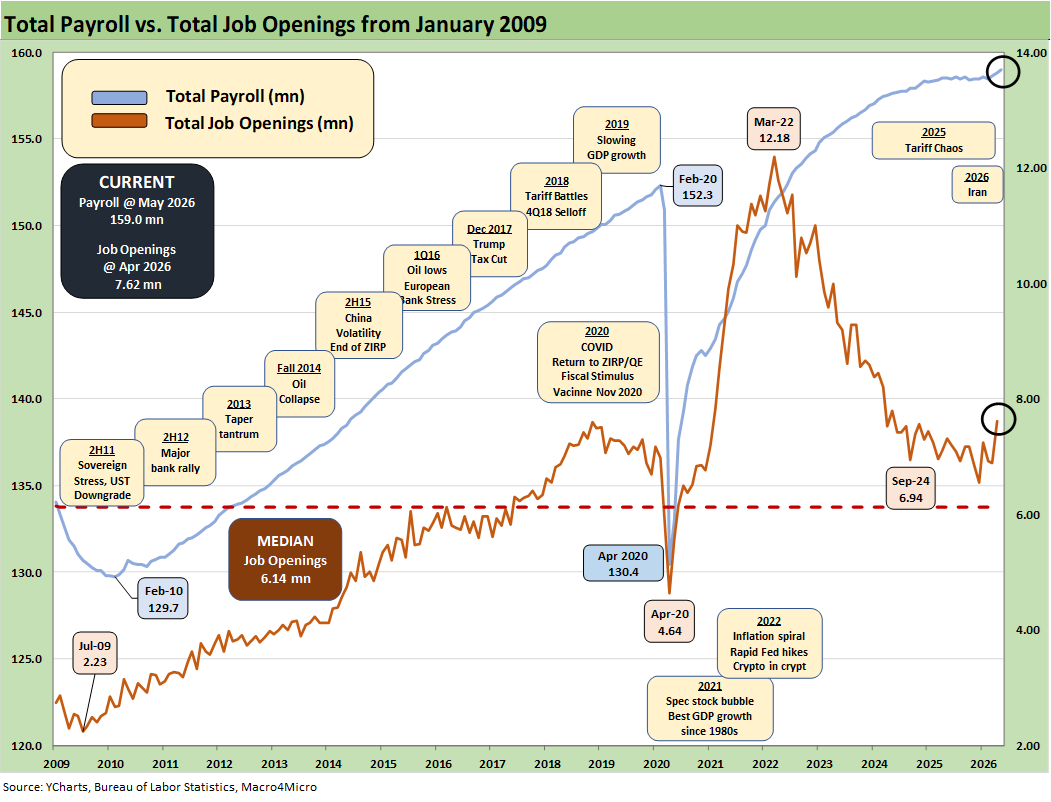
The above chart updates the total payroll number vs. job openings. JOLTS data had been recovering with banner job openings this past week even though hires were weak. We see some of those openings being filled in the May payrolls (see JOLTS April 2026: A Modestly Positive Turn 6-2-26).
Management teams have a lot of moving parts to factor into planning whether quantitative or qualitative. The final IEEPA decision from SCOTUS came in against Trump, but he was prepared to start slapping on tariffs under Section 122, 232, and 301. That is well underway on Section 301 tariffs with a range of announcements this week. Those tariff actions will create more trade partner strife with the EU and Asia.
The USMCA is up for review and that is already starting out ugly with Trump bringing out his “51st state” trash talking even as MAGA stokes the fires for Alberta secession. The EU diplomatic setbacks and trade relations are downright ugly at this point after Iran. NATO appears to be in the crosshairs.
The trade flows have been looked at in many past commentaries (see Meanwhile…Back in Economics and Tariffs 3-2-26, US Trade with the World: Import-Export Mix 2-25-26). The US has a goods trade surplus with Canada ex-oil. Canada is also the leading export market for almost 3 dozen US states.
The FOMC and the market both have much to digest, and Trump is making it clear to the domestic audience that there is a ceasefire and the “war is over.” This is hard to reconcile with a full blockade (an act of war by international law) and ongoing Iranian actions against both the US and Gulf nations.
The headlines around multiple supplier chains have been covered in other research, but fertilizer is one that aims directly at food while oil aims at just about everything from the gas pump to delivery costs, raw materials, and leisure and travel (airfare). The headlines highlighted the threat to semiconductor production while some customers could see IT budgets slammed. With so many bad headlines in private credit, the idea of financial stress and the need to be cautious on spending/capex will be an issue to be played out. That means the consumer sector is likely to be facing more risk ahead even with these good payroll numbers. Inflation and the lowest savings rate since the inflation peak of 2022 is a metric that needs to be watched over the summer.
The overall economic impact of tariffs had been far less than feared given the reality that most trade partners backed down in 2025. That still could change in 2026 with the latest wave of Section 301 attacks on supplier chains and trading partners.
See also:
JOLTS April 2026: A Modestly Positive Turn 6-2-26
Retail Signal Read Part Deux 6-1-26
Market Commentary: Asset Returns 5-31-26
New Home Sales April 2026: Slow Start to Spring 5-28-26
PCE Inflation: Income and Outlays April 2026 5-28-26
GDP 1Q26 Second Estimate: Shrunk in the Dryer 5-28-26
Retail Equity Comps: Looking for Signals 5-26-26
Housing Starts April 2026: Soft Starts in Single Family 5-22-26
D.R. Horton: Financial Powerhouse Despite Cyclical Softening 5-20-26
Taiwan: Stakes are High, US Awareness is Low 5-17-26
Industrial Production April 2026: Bringing a Lift 5-15-26
Existing Home Sales April 2026: Steady or Clinging? 5-14-26
Producer Price Index April 2026: Heat Rising on Cost Inputs 5-13-26
CPI April 2026: 4.1% All Items Less Shelter, 30Y UST 5% 5-12-26