
Carvana: Counterattacking in Style
We update the migration of CVNA into the financially viable zone after a remarkably good quarter in a struggling used car market.


Tools for framing digital retail valuation models...
Carvana 1Q24 put up numbers that include solid revenue growth, an extremely positive move in EBITDA, and a surprising uptick in retail unit prices.
The stand-alone financial viability case for CVNA is much better today than it has been since the distressed debt exchange impaired bondholders and put CVNA in somewhat of a box to “make it work” or face the consequences.
The potential to achieve a single B tier quality balance sheet by the end of 2024 is now looking better with positive EBITDA covering interest expense and a bare bones capex program even if adverse trends in affordability linger and used car supply sourcing will remain a major challenge.
For CVNA, some proof was badly needed and notably some growth in revenue and more sustained upside in the EBITDA run rate since the company cannot be priced like a hot growth stock expecting 30-handle forward EV/EBITDA multiples without showing the model translates into reality. The 1Q24 numbers shift the debate again.
The 1Q24 revenue growth and EBITDA numbers just gave CVNA new life in attaching its talking points to some hard numbers in their financials. To believe that CVNA has a great handle on where the economics of their business will head from here, one has to buy into the pitch that the same management team that took on billions of debt immediately before slamming right into a debt restructuring and massive goodwill write-off within months can now get back on a growth track from here.
CVNA will need that revenue and EBITDA growth to justify sustained high 20-handle EV multiples (using FY 2024-2025 EBITDA estimates) while other auto retailers are only posting single digit multiples. That takes a lot of faith. At least 1Q24 and the EBITDA forecast pep talk gives CVNA all new life with the hope of a billion-dollar EBITDA in FY 2024. That would take total debt leverage down to a 6x handle or dramatically above the public dealers with their BB tier weighted ratings.
The bullish theory on avoiding dilution is that the free cash flow generation can be deployed to debt reduction while holding onto high EV multiples. That would entail taking down leverage organically from both a rising EBITDA denominator while free cash flow allows net debt reduction to shrink in the numerator. Rather than dilution, the less certain and greedier plan (no new stock issue to play defense) seems to be the one in the near future. That is the “damn the torpedoes school” so soon after a distressed debt exchange.
The bondholders hope for no execution problems or adverse macro market moves (e.g. Fed tightening), but a bird in the hand of debt reduction via a stock offering would be reassuring to a broader group of lenders/bondholders and open up more avenues in 2024-2025 for other liability management plans and capex flexibility.
The comparative stock journey…
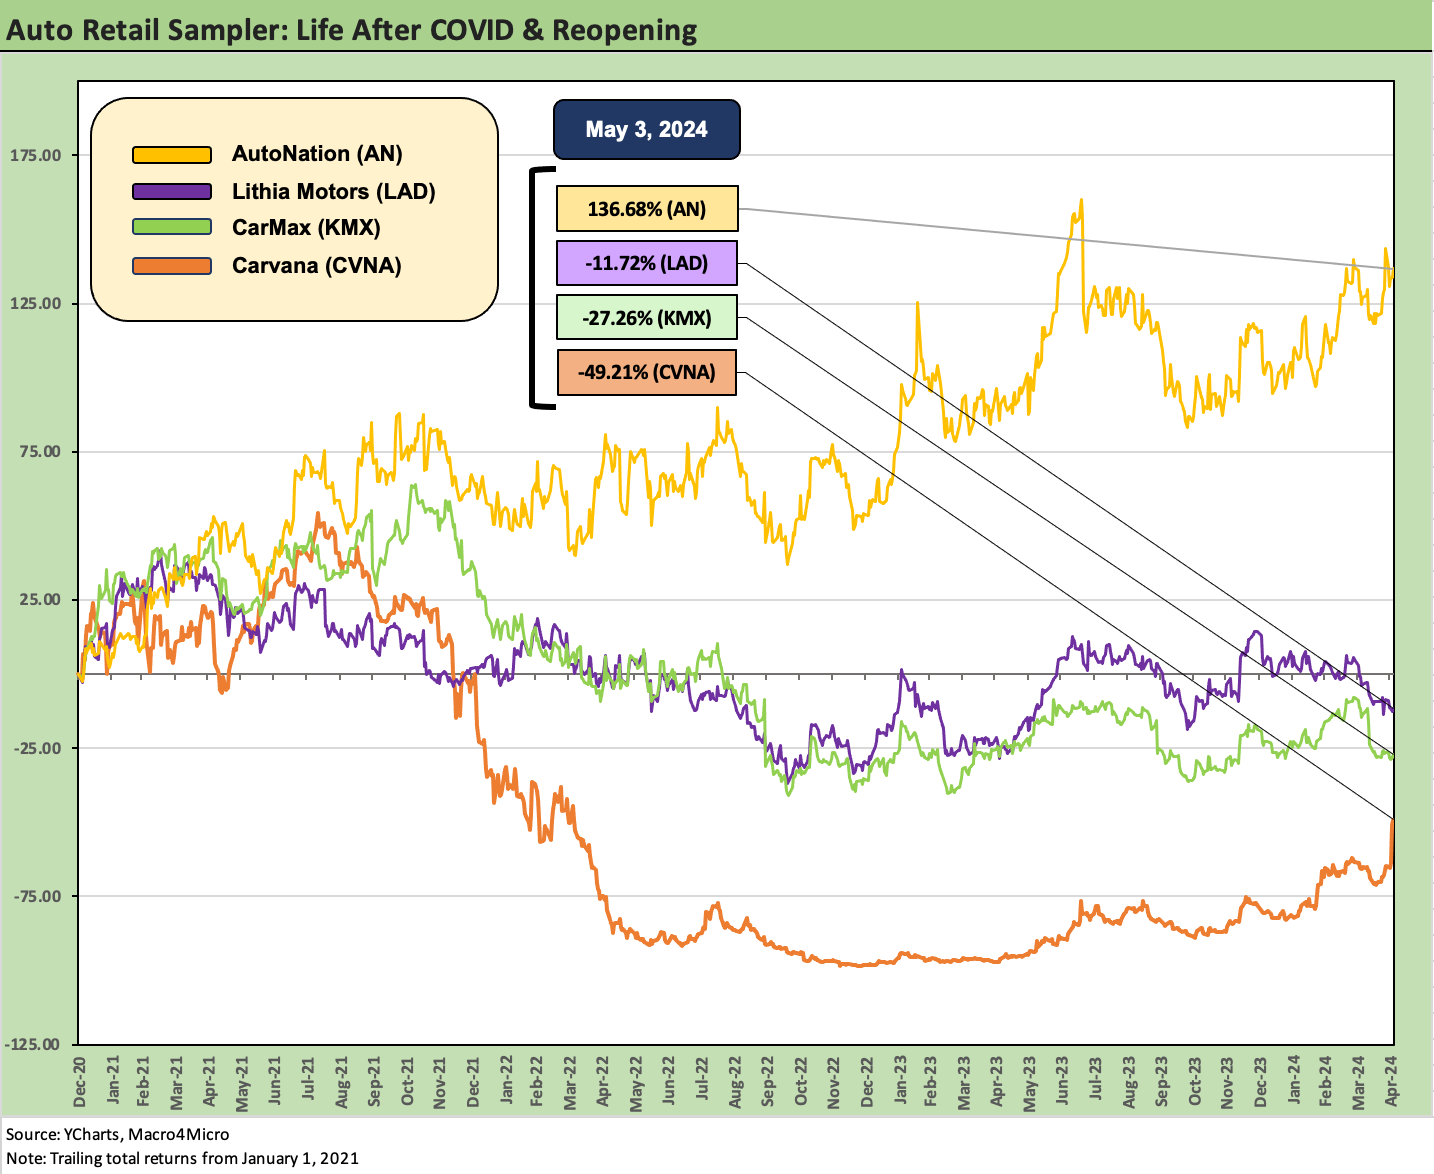
The stock chart above follows the journey of a few distinctive auto retail business models from the start of 2021 into the immediate post-COVID period as stimulus and vaccines reopened the economy and sent markets soaring. The rallies came alongside major disruptions in automotive supplier chains that reverberated along the new and used car chain and caused various supply-demand imbalances.
That mix of factors made the year 2021 an anomalous period in the context of new vs. used car pricing differentials as the scramble for mobility sent used prices soaring. That rattled the CPI index (example: June 2021 posted 45% used car inflation, Dec 2021 over 37%). Supplier chain turmoil for new vehicles (suppliers to OEMs) set off the scramble for used vehicles. That in turn got all the traditional dealers very interested in expanding used operations and all the investment that entailed. For some, that included stand-alone used vehicle branding and a more aggressive focus on digital used retailing.
Then came 2022 with the tightening cycle kicking into gear and sending monthly payments much higher for auto buyers with new and used vehicle prices higher and lag times and financing more costly. The overall distortions in Auto CPI across 2021 spilled into early 2022 with 40% handle CPI levels for used autos in Jan-Feb 2022 just ahead of the end of ZIRP (see Automotive Inflation: More than Meets the Eye 10-17-22).
The auto retail subsector mix…
The mix of names in the above stock chart were chosen for a reason. We selected AutoNation (AN) as the “old school” public retailer. We could have gone with Penske as one of the premier dealers, but they are dominated by luxury brands and not the usual mainstream US vehicles. Lithia (LAD) was chosen for its size and since it has been one of the most aggressive franchise dealers in M&A and in used car expansion and digital strategies. LAD is on a bold course.
We include CarMax (KMX) as the leader in dedicated used car retail with its extensive brick and mortar presence and omnichannel strategy (see links at bottom). KMX is a good used car proxy and helps in gauging how quickly the old-time players can push into digital as KMX builds out its omnichannel digital sourcing and sales capabilities. KMX also has a very strong financial profile and will not be standing still as CVNA pushes ahead.
CVNA is the aggressive pure play in digital used retail. That comes with the asterisk that CVNA also jumped in with both feet into the infrastructure side of the business. That was notably the case with the purchase of the ADESA physical assets in 2022 ($2.2 bn in cash completed May 2022) that saw debt levels spike. When you take on that much debt, your in-house forecasting skills better be good.
The 4 year time horizon in the chart shows AutoNation on top in stock performance vs. the group with Lithia struggling with its aggressive expansion in used car and digital operations. Meanwhile, CarMax (KMX) equity has been dragging on volumes and pricing in used cars. For its part, CVNA was a case study in volatility, and the debt burden immediately became a crisis. CVNA wrote off $847 million in goodwill in the same year in only 7 months after the deal closed. You sure don’t see that very often.
Lesser business models than the CVNA digital retail plan might be dead and buried by now (VROOM, etc.). The transaction that saved CVNA was a bondholder bailout that was a de facto CVNA default in the form of a distressed exchange. It was a deal where all parties won since the risk symmetry was grim for all without a deal. Bondholders saw the longer-term asset value merits and gave CVNA time to find their way back. That comeback will take more than a few quarters to get EBITDA up to peer run rates, but it is starting to unfold the past two quarters while showing upside in cash flow.
The headscratcher in recent quarters was the absence of revenue growth. At least that is changing now. The CVNA bondholders include some very well-capitalized private equity players and asset management firms that know the space and know how to do due diligence. So that is another benefit for the direction of financial risk.
CVNA 1Q24 brings market celebration…
CVNA’s bullish earnings brought a 33% handle spike on the first trading day after release. An ugly short squeeze remains in process as CVNA fans hold the line. The fact that CVNA had just restructured its debt in 2023 to avoid a financial crisis added another element of “strange” to the scale of the rally in recent quarters, but the rate of progress in EBITDA breaks the debate out of the status quo.
With a fresh game clock coming out of 1Q24 numbers, CVNA now is at least back in the game to be a stable “HY Classic” name in the credit markets. Bonds rallied sharply after the earnings release (5/1 after close). That release fed a strong rally and initially added another 4 points or so to the various bonds (2028s, 2030s).
We checked out our data providers for actual trades (7 Chord, BondCliQ) before/after the release, and the reaction was very favorable. In a very tight HY market, CVNA’s bond mix was able to chase B tier spreads, but CVNA remains well down in the B tier OAS ranks even at par plus pricing. The credit market is not worried at this point, and holders can wait out peak selling season and what capital structure plans might unfold – if any. There is no challenging the fact right now that CVNA is very risky and grossly overleveraged, but at least now the model is showing up in the results.
Whether before or after earnings, the equity valuation is still a world apart from current run rates and based on extremely optimistic, speculative, supporting assumptions to get there over longer time horizons using inflated multiples. Once you stick to a radically high multiple in street coverage, it is hard to back off for many who follow the company.
CVNA retail volume and price perform well against market struggles…
We looked at used vehicle unit pricing (retail and wholesale) across the quarters since late 2018 in a recent CarMax piece given KMX’s role as the industry leader (see CarMax FY 2024: Secular Neutral? Or Cyclical Gear Shift? 4-16-24). It is easy enough to see how affordability has become a major problem for both car prices and financing costs as monthly payments swing materially higher.
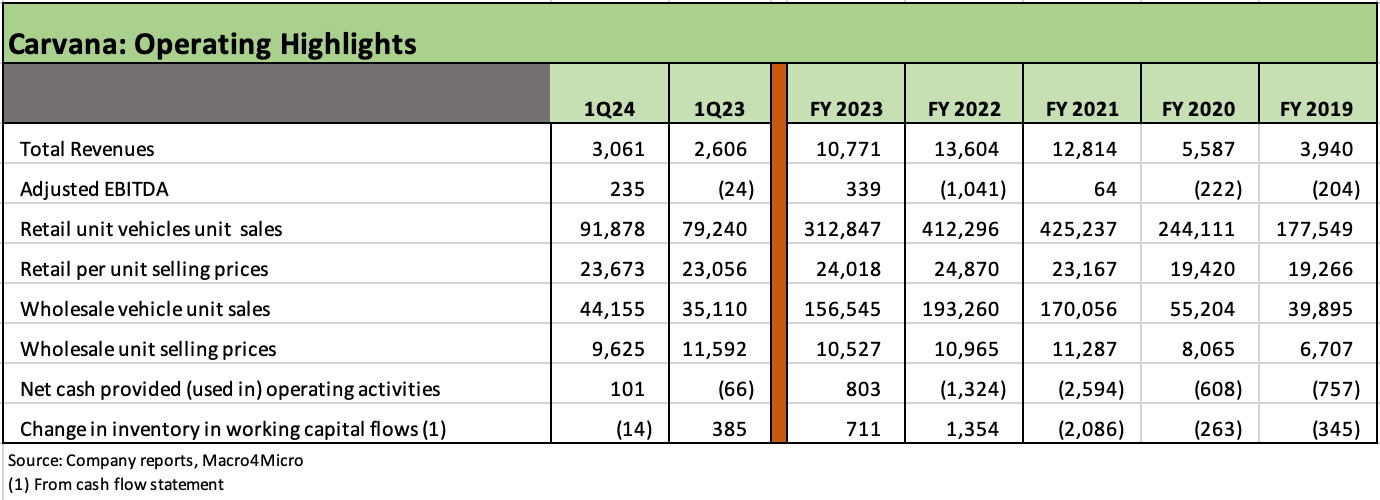
In a table further below, we include the retail and wholesale pricing for CVNA. The move in retail since 2019 from $19.3K per unit to $23.6K for retail and from $6.7K in wholesale for FY 2019 to $9.6K in 1Q24 is consistent with the affordability challenge. Financing rates have undermined volumes or shifted product price points. The longer some purchase/sale decisions get postponed on the new or used side, the more sourcing is a challenge for CVNA and KMX. The transaction volumes need to pick up, and the Fed posture on rates will not help. That makes the 1Q24 performance by CVNA especially impressive.
EBITDA optimism now achieving some reality…
CVNA certainly pushed back on some of the bears that see a grossly overleveraged company being valued like a hot tech stock. The multiple implies that extraordinary growth is assured on the top line and on the EBITDA line. High financial risk is supposed to temper multiples but that has not been the case with CVNA. At least now the leverage is getting “less gross” from the denominator level (EBITDA).
The fact that the company was comparing its EBITDA margins on its conference call to auto retailers that have single-digit EV multiples is relevant to the valuation metrics assigned to CVNA. After all, if CVNA is basically in a “peer group of one” as other pure digital used car retailers faded, then their comparisons to the other auto retailers undermines their case for an outsized tech multiple. Either auto retailers are comps or not. Which is it? On a positive note, CVNA did finally see EBITDA exceed interest (post-restructuring) and its minimal capex program. That is good news.
For CVNA, the peak stock price in August 2021 ($370 on 8-10-21) was way outside the extreme optimism zone. Those who invested in the IPO in April 2017 at $15 and a $2 bn valuation have done well, but obviously the opportunities to take profits were impressive along the way.
For stockholders, the question will remain how high a multiple does the market want to assign to a company such as CVNA. Keying off what year? One can argue CVNA lacks a peer group on the digital side but still is one that operates in a very mature retail business (used car retail). That makes for some confusion when the franchised dealers are valued in the high single-digit range for EV/EBITDA multiples.
Credit risk has now stabilized even if it came the hard way…
It is much easier to get comfortable with CVNA credit risk at this point, but CVNA would be in a much easier position if they did take more aggressive action to issue equity and reduce debt. The equity dilution risk is something that can be overstated since less financial risk also should translate into higher comfort in equity market multiples. The market cap at this point is once again off the charts at more than 2x the largest auto retailers.
Some companies that plunged into distress in the past but bounced (think Chrysler in 1990-1991) issued equity (or equity linked) securities to fortify their balance sheet and they saw their stock rally right through it. In the case of Chrysler, the rally in both credit quality and equity into late 1991-1992 came on their way to becoming the most profitable auto company by 1998 (that did not end well with the Daimler merger and later problems).
I pick the Chrysler example as I was ringside for that one and Chrysler being in the same broad group of “distressed auto related” (see Autos: War Stories and Anecdotes 9-22-23). CVNA had been issuing equity into its expansion program, so now it is time for balance sheet repair. If the 2024 billion-plus EBITDA holds, CVNA leverage will still be double that of the auto retailer peer group.
A modestly dilutive stock deal could put a big dent in debt, fortify balance sheet liquidity, and cement CVNA’s financial position for later regardless of the cyclical trends. The potential sources of those bonds for a major redemption transaction could be found in the bondholder group.
CVNA might also be able to buy themselves some financial latitude to push growth initiatives if the market turns favorable. For now, the used vehicle market remains a dog fight, and the $1+ bn EBITDA line for 2024 as a first step toward more sustained growth into 2025 is hardly assured. That said, the market is clearly pricing it in and more down the line.
The above chart revisits the price and volume trends for CVNA across a very wild and volatile period for the company and for the used car markets broadly. The timeline starts before COVID (2019), across the pandemic turmoil of 2020, into the rebound and “reopening” period of 2021, and on into the tightening cycle of 2022 and the new vehicle upturn of 2023.
That time horizon saw a lot of moving parts with some of the most dramatic swings in used car prices ever seen. In addition to what we look at with CarMax in a recent report, we also address the residual swings for late model used cars in the Avis 1Q24 earnings commentary (see Avis: Gearing Up for a Transition Year in Fleet Costs 5-2-24).
The year 2021 was the year of years for CVNA as addressed in earlier reports (see links at the bottom). The chart above shows volumes, prices and thus revenues soaring during the reopening. Activity was booming on the retail and wholesale line. During 2021, growth stock stories and tech-centric anything (think Peloton) were giving flashbacks to the late 1990s with respect to forward valuation excess.
The idea that a used car retailer with intrinsic sourcing challenges and later taking on so much financial risk would be afforded tech-boom multiples was hard to fathom then and now. That is especially the case when there are so many low multiple players in the space with comparable gross margins and higher net margins who have ample free cash flow to keep chipping away at digital strategies.
Even CVNA took pains on the call to compare its EBITDA margins to that auto retailer peer group and dub itself the most profitable retailer for one quarter. That comparison begs one to frame their valuation against those others in relative value for bonds and stocks. That is not a favorable reference for CVNA.
We would point out that the public franchise dealers all have better net margins and adjusted net margins (ex-gains). CVNA was negative in the quarter if we adjust for gains. The gross profit line at CVNA was very strong, and that is worth bragging about. There is a lot of action from gross profit to the net margin line. For what in substance is a retailer equity, that matters.
Diversification of revenue streams is also a risk factor, and auto retailers have a good story there also (new vs. used, parts and services, finance and insurance products, warranties, etc.). The digital play is what lights up growth equity interest. From a credit risk standpoint, you can’t pay debt and interest with market cap as the market saw at the end of 2022 as CVNA sprinted toward a debt restructuring in 2023.

The above chart highlights the evolution of the left and right side of the balance sheet since 2019 as the debt-financed funding of CVNA’s M&A and increased asset intensity (see property and equipment line) almost sent CVNA into bankruptcy. CVNA came under the cloud of an unfolding cash flow crisis where the company would not be able to pay its interest. The private equity players had entered the game and the bondholder groups saw the value in the CVNA franchise and struck a successful deal (see links at bottom).
The timeline in the chart shows the asset mix evolution and heavy fixed asset shift. We see net debt and total debt both up over 4-fold from 4Q19 to 1Q24. Inventory is down from FY 2022 and FY 2021, so that means speedy inventory turns better be the reality in a used car market that has been slowing down on rates/affordability and supply.
Used car volumes are well below the peak of over 40 million with used cars weighing in for FY 2023 at under 36 million (Source: Cox). At that size with very small shares held by the leaders (around 3.7% share for CarMax in the 0 to 10-year used bracket), that can mean more players can enter the market and be absorbed with ease just given the minimal share of the leaders. That is the spin on the bull side of the stock.
The bond side is easier to address than equity valuation. The bonds are now in good shape, rallied materially last week into the weak B tier zone on 1Q24 numbers. HY felt better about CVNA even if just watching the equity soar. We looked at a few of our HY OAS pricing sources (ICE, 7 Chord) for this name, and we see some dislocations around where the CVNA collection gets marked, but the clear direction of CVNA OAS was materially tighter.
The ability to protect par recovery (or par plus accrued) and even make a case for a return on equity under a “Hertz Part Deux” scenario is very much alive for the bondholder group. They are well protected at this point and have an easier sail from here.
The challenge now for CVNA is stringing together more quarters that get EBITDA north of $1 bn and under a theoretical 6x net debt to EBITDA number. For the traditional dealers with the single digit EV multiples, that 6x would be way too much leverage.
Auto retail is still in a rapid evolution stage…
With a 1% share of a highly fragmented used car retail sector that generated 35 to 40 million “tickets” a year, there is a lot of room for growth at CVNA. That is supposed to mean more market entrants and notably from incumbents. That will keep playing out.
The sustained horizontal expansion by classic auto retail into digital is not going away, and we always point out they have captive trade-ins, lease roll-offs, an established customer base, and old school local dealer ties (Note: as a kid, I remember the “Ford pass, punt and kick” contest at the local Clark Ford dealer in my hometown of Brockton, MA every year. Sad to say, the Clark Ford history ended with Ford’s protracted restructuring and dealer network downsizing. The Clark family continued but with Volkswagen. Say it ain’t so…). Many dealers across the US have tight community ties and name recognition.
The dealers also offer parts and services operations and an extensive array of warranty capabilities to tap into during the age of the Certified Pre-Owned (CPO) product offerings. The mix of auto retail segments and service offerings clutters up the playing field. KMX will be the wildcard with respect to a “petri dish” on how well omnichannel investment can perform along the inventory sourcing to sales chain in used cars.
Gauging the value of a digital retail player in a classic, mature business line (selling new and used cars) is tricky when we see single-digit multiples in classic auto retailers staying the course on trade-ins and CPOs, ancillary business opportunities in used vehicles (warranty products, parts and services, etc.).
After 1Q24, CVNA is making its case for high current earnings run rates and debt service ability, a stronger balance sheet ahead, and even stable cash flows. The dealers have all of that as well, yet their EV multiples are mired in single digits.
The intrinsic limitations on used car growth trends, secular trends in competition (vs. classic retailers, CarMax as incumbent and omnichannel player, direct-to-retail platforms by car rental operators, where Amazon heads, etc.), and the lasting reality of an ugly balance sheet will keep the debate alive.
See also:
Carvana:
Carvana: Solid EBITDA, but Does Not Cover GAAP Interest 2-25-24
Carvana: Quick Read, Long Road 11-2-23
Carvana and Uncertain Used Car Dynamics 10-5-23
Carvana: Smoke Signals Get Smokier 6-9-23
Carvana 1Q23: Company Comment 5-4-23
Carvana: Prisoner’s Dilemma, Used Car Getaway 3-22-23
Carvana: Credit Profile 3-5-23
Carvana: Wax Wheels 12-8-22
The Used Car Microcosm: Industry Comment 11-29-22
CarMax:
CarMax FY 2024: Secular Neutral? Or Cyclical Gear Shift? 4-16-24
Credit Crib Note: CarMax 2-21-24
CarMax: Credit Profile 7-9-23