
Credit Crib Note: Avis Budget Group (CAR)
We look at the operating and financial fundamentals of Avis.


CREDIT QUALITY TREND: Negative. The credit ratings are stable but most of the market sees that financial metrics are likely to erode in 2024 after an extraordinary period of distortions in the used car market and air travel patterns. From here, normalization of depreciation rates (a cash expense) and a dramatic rebound in travel will be trading off negative and positive impacts but with the end result being lower margins and higher leverage.
The wild volatility of the car rental market from 2019 to 2023 started off with a pandemic-driven collapse in airport travel and rental volumes, a Hertz bankruptcy, and a radical car rental fleet downsizing during COVID. That was followed by a rapid fleet rebuilding process that drove record inflation in used vehicles on supply-demand imbalances. That backdrop was set against a supplier chain crisis for new vehicles that further complicated car rental fleet economics and set off major dislocations challenging fleet planning into 2021-2023.
The turmoil challenged how to apply the word “trend” in analyzing car rental financial metrics with earnings so high and leverage (Net debt/EBITDA) so low in historical context across the 2021-2023 margin spike. The forward-looking pressures of “normal” fleet cycles are arriving in 2024-2025, however, with corporate debt now well above historical levels.
Since COVID, Avis saw record earnings, record free cash flow, and record shareholder rewards (buybacks and special dividends). The mix of financial performance measures for 2023 presents a stable picture with very low leverage for the company’s credit ratings, but reality is already flowing into the numbers in the seasonally slow 1Q24 period (see Avis: Gearing Up for a Transition Year in Fleet Costs 5-2-24). We see leverage ticking higher and margins moving lower.
OPERATING PROFILE: Avis has moved comfortably ahead of Hertz as the #2 car rental operator but remains a very distant #2 to Enterprise as the clear industry leader in the broader car rental sector. Avis weathered the volatility of the 2016-2019 period well enough to be prepared for the COVID crunch. Then the peak of the crisis in 2020 drove some painful cash bleeding tied to collapsing volumes and high fleet payments. The additional lien capacity gave Avis the financial flexibility to sustain its ABS structures in the face of a liquidity crisis. Those demands quickly swamped Hertz, who lacked the lien capacity and liquidity sources while Avis was able to bridge the gap.
The perception of Avis as the better operating company was played out across 2014 to 2019 as Hertz had numerous setbacks across multiple CEOs. Blindsiding the market on sudden, dramatic shortfalls from guidance (fall 2016), inferior execution by Hertz in fleet management (notably fleet mix and depreciation estimates), and recurring CEO changes further spooked the debt and equity markets. If you wanted to play car rental in stocks or bonds, Avis was quickly seen as the superior risk reward.
The earlier overpriced, debt-financed Dollar Thrifty deal (DTG/2012) by Hertz also revealed an inability to successfully manage M&A integration. In contrast, Avis had an easier time with the less challenging task of integrating the acquisition of its European franchises and Zipcar (which added more short-term cachet than the minimal, fleet, revenue and EBITDA it brought). The fact that Hertz outbid Avis in a two-year takeover fight and regulatory process to buy DTG was a “win by losing” moment for Avis that mitigated the operational challenges that Avis faced. The execution gap plaguing Hertz was recently highlighted again with the Hertz “misfire” in its Electric Vehicle fleet strategy.
FINANCIAL TRENDS: With net debt leverage at 1.7x at 12-31-23 (2.5x at 1Q24) and EBITDA margins still well above pre-COVID levels in FY 2023, financial metrics are vulnerable in 2024. The good news is that Avis enters 2024 from a very strong financial starting point after a few years of extraordinary profits that should also remind investors of the volatility of some key operating variables (pricing, fleet costs). The period of dazzling fleet gains is over, and both Avis and Hertz found ways to return the windfalls to shareholders. Once they did that, the overriding priority is “stay out of idiosyncratic trouble.” Avis is passing that test – again. Hertz already whiffed – again.
Free cash flow is still likely going to be about shareholder rewards more than debt reduction for Avis. Leverage will rise as unit costs flow into auto depreciation and competition picks up in pricing with some lingering fears of fleet capacity excess. Auto depreciation will climb materially relative to recent years, and that will eat into the EBITDA line.
Rising depreciation per unit has already been flowing into margin pressure in 1Q24 and that will continue even as fleet interest costs take their toll with “higher for longer” likely to keep pressure on fleet costs. Per unit fleet costs were 52% higher YoY for 4Q23. For 1Q24, fleet unit costs were 123% higher vs.1Q23. That all adds up to lower margins and higher leverage in 2024.
The dazzling rebound of Hertz debt from a 26-handle price tag in the CDS auction to a par-plus Chapter 11 exit still offers a telling reminder of the value of the daily car rental franchises and notably in the US market. That Hertz recovery in valuation offers some support to the perception of asset coverage at Avis, who has proven itself the superior operating company vs. Hertz before the crisis and since then in terms of fleet management practices and financial prudence. Avis has already proven to be the better operator again (so far) as the normalization period unfolds. Avis remains very shareholder oriented as evident in the scale of the stock buyback programs, but they have stayed inside the lines on fleet practices even if their EV plan remains a bit murky on disclosure.

The annual results of operations detailed above highlight the wild swings from the pre-COVID period of high single digit margins (2016 to 2019) to as high as 34.5% in FY 2022 and 20.7% in FY 2023.
Those pre-COVID Avis margins were around half those posted by Enterprise with Hertz facing similar challenges, so there was always hope for upside (Note: we no longer have access to the financials of Enterprise as a private company). Enterprise has always set the bar on what is possible.
We remember an older pre-COVID Investor Day with Hertz that targeted 15% to 18% margins over the intermediate term. That obviously never happened before the Chapter 11 and COVID distortions.
The big two public car rental operators were playing catch-up in the pre-COVID period in systems and technology from internal fleet management to external customer analytics for pricing, inventory management, and the mix of locations. Those investments were expensive and designed to bring higher margins. That will get tested from this point.
The timeline above shows the plunge into the pandemic in 2020 and then across an extraordinary rebound never seen before in rental pricing and in residual value gains on soaring used car values.
Peak EBITDA margins during FY 2022 were around 4x the 2019 levels while annual net income in 2022 rose by over 9x vs. 2019 before COVID. The fear from here is the “equal and opposite” reaction effects on the cost line is likely to be “opposite” even if not “equal.” Those margins were in no way sustainable even if just on the fleet gains.
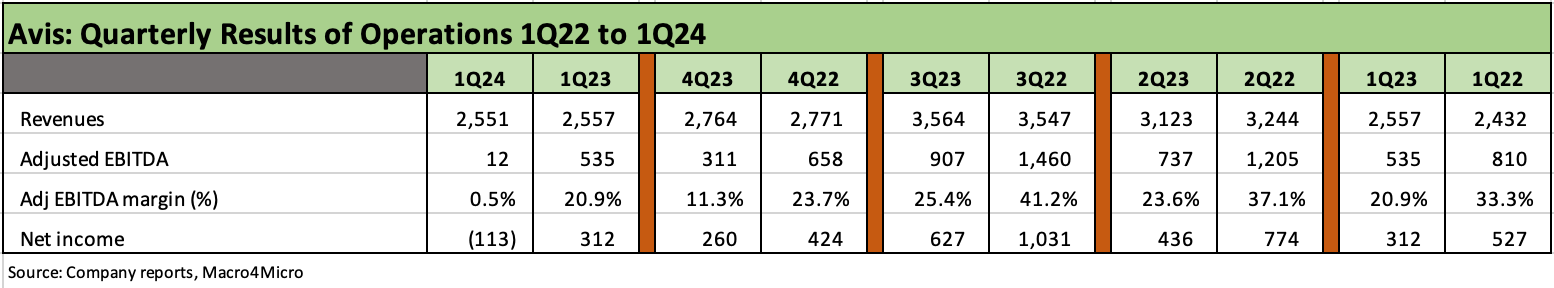
We already discussed the swings across quarters in our recent Avis 1Q24 commentary (see (see Avis: Gearing Up for a Transition Year in Fleet Costs 5-2-24). The time period in the above chart starts in 1Q22, which marks the start of the tightening cycle, through 1Q24. The following chart details 1Q20 to 4Q21.
The period from 1Q22 to 1Q24 saw waves of high gains on vehicle disposition and improved pricing power as travel and services demand rebounded in the great reopening period. The most recent period in 1Q24 saw losses and not gains from vehicle sales.
We look at the narrow quarterly “operating metrics” for those periods in other charts below, and the combination of fleet expansion, stronger pricing, lower depreciation and fleet gains sent margins and cash flow soaring.
The quarterly numbers are especially revealing on how pricing and major swings in depreciation costs can flow into profitability trends for car rental operators.
We see peak EBITDA margins of 41.2% in 3Q22, which is the peak season for air travel and car rentals. The year 2022 was a year of supplier chain stress and recession level new car sales.
Avis saw the first record Adj. EBITDA in 3Q21, then another record quarter in 2Q22, and then one more record EBITDA in 3Q22.
Earnings sensitivity also means being on alert for weakness in prices from any systemwide over-fleeting or signs of material used car price weakness.

We added some more back history into the above quarterly chart to underscore how volatile and dislocated the financial metrics were from the onset of COVID in 1Q20 across the last full year of ZIRP in 2021 as the reopening and stimulus sent GDP soaring, the consumer sector into overdrive, and set the stage for a services (and travel) boom.
As a reminder, Hertz filed Chapter 11 in May 2020 (5-22-20) as its cash and liquidity options were quite literally bleeding out. Hertz emerged from bankruptcy in June 2021.
The immediate impact of COVID was a collapse in travel and an urgent need to scale down and liquidate fleet size in an orderly fashion since the payments were due to the ABS and bank line structures. That meant selling vehicles.
The fleet downsizing through the seasonal trough date for the industry fleet of 12-31-20 was underway as vaccines were rolling out, stimulus was soaring both under the old and new President, durables were in demand and service demand (travel and leisure) was ready to skyrocket.
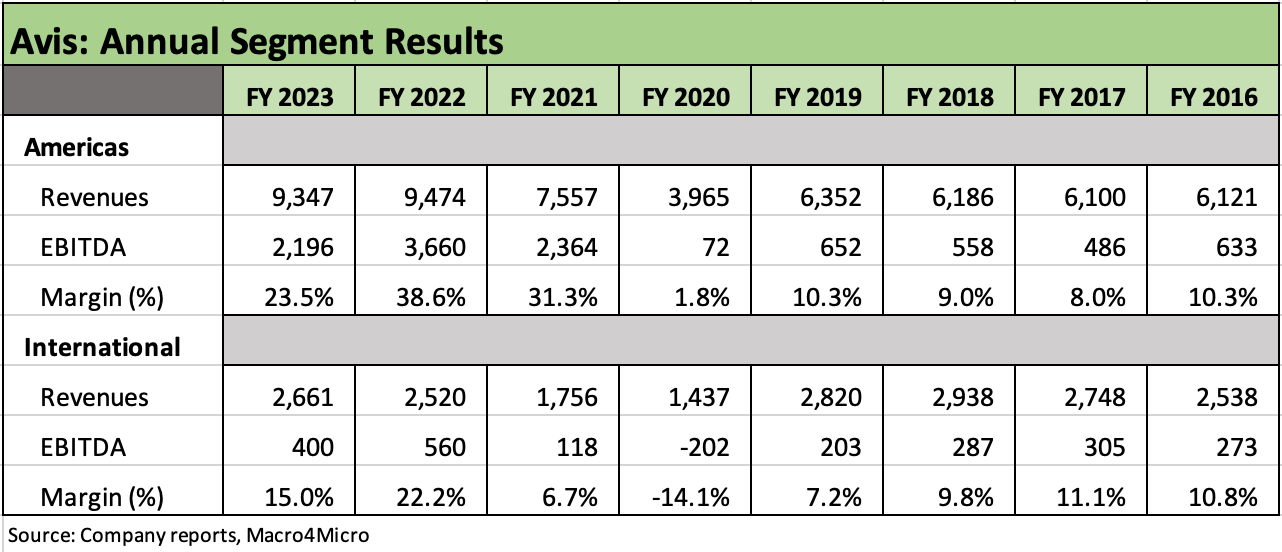
The annual segment results above cover the period from FY 2016 through FY 2023. The 2016 to 2019 pre-COVID period shows a high single digit EBITDA average in the Americas.
The history underscores the strength of the Americas segment during the 2021 to 2023 stretch with the outsized, unprecedented EBITDA margins for 3 straight years. The Americas segment revenues were 3.5x that of the International segment in the FY 2023 period.
The period before COVID ran from 8% to 10% area segment margins for the Americas before multiplying by 3-fold and 4-fold in FY 2021 and FY 2022 and over 2-fold in 2023 from the peak shown in the chart for the pre-COVID period.
The evolution of the US car rental business over the decades and notably since the radical auto sector capacity restructuring during the 2009 Chapter 11 process at GM and Chrysler (the downsizings were seen at Ford as well even though Ford avoided Chapter 11) saw the de facto end of “program vehicles” (OEM buyback deals at guaranteed depreciation rates).
The end of “program cars” meant the car rental companies take the residual risk and thus they had to buy high quality vehicles that could hold value. That in turn meant “learning new tricks” and development of all-new and effective remarketing channels. That is ongoing.
The need to buy high quality vehicles and have resilient, predictable residual values became a priority with Avis and Hertz taking the residual value risks. That explains the high margin volatility seen in the Americas segment with less than 1% of Avis fleet in program cars and the full upside accruing to Avis on fleet turnover.
In contrast to the Americas, the International segment saw program cars at 40% of total for FY 2023.
In the age of the EV, a major factor in fleet risk management and pricing strategies could be a function of how the car rental companies can protect their earnings and downside risk from residual values in emerging technologies and what role they will play. That is anything but clear on where the market will trend from here in residual value risk and fleet mix around EVs.

The quarterly segment results show that most of the big moves in margins were rooted in the Americas car rental operations, but the International segment did manage to post a 34.5% EBITDA margin in 3Q22 with the Americas segment at a 43.8% EBITDA margin that same quarter. The 3Q22 period is during the peak season and came at a time when summer travel was booming (as it was again in 3Q23).
The 3Q quarters in 2023, 2022, and 2021 highlight that Avis can win big through high pricing (reflected in revenue per day in the Operating Metrics charts below), with its high flow-through into EBITDA. Avis also can win big through lower depreciation on strong residuals and lower unit costs as detailed below in operating metrics. During 2024, depreciation is going in the other direction.
The 3Q22 Americas segment margin peak continued a 6-quarter streak where segment EBITDA for those quarters was a record high (in a seasonal business) as summer travel boomed and vehicle depreciation rates declined on strong residual values and asset gains. Those trends in turn translated into several quarters of extraordinarily low unit fleet costs (covered below in Operating Metrics).
The combination of record fleet size, very strong travel, and favorable vehicle depreciation rates made for a formidable combination of factors that generated high rates of free cash flow for shareholder rewards.

The operating metrics above present an intuitive checklist across the scale of the earnings asset base (fleet size), the efficiency with which those assets are deployed (utilization), volumes (rental days), prices (revenue per day), and per unit fleet costs (heavily tied to the cost of fleet and the rate of depreciation). The financing/interest costs associated with the fleet funding have to be repaid to the funding entities, and those costs are rising.
The concept of vehicle depreciation as a cash expense was hammered home during the COVID crisis and the financial collapse of Hertz in Chapter 11, and we include both net vehicle depreciation and lease costs (from the income statement) above as well as per unit cost metrics furnished by Avis each quarter.
In this current market (see 1Q24 quarterly metrics in the next chart), we are seeing some reversion to higher depreciation rates. That adverse trend is consistent with higher transaction prices to purchase new cars for the fleet. Also, we see a weaker used car market from a shift in supply-demand balances with new vehicles bouncing off the recession level volumes of 2022 into higher new vehicle sales in 2023.
We note there is always a lag effect on used prices from new car sales given lease roll-offs for late model used cars and the gradual recovery of car rental companies from the initial fleet downsizings during the 2020 COVID peak.
Our recent report on CarMax has some interesting quarterly timelines on used car pricing at the retail and wholesale level (see CarMax FY 2024: Secular Neutral? Or Cyclical Gear Shift? 4-16-24). There are ample benchmarks in the market (Manheim, etc.), but CarMax is also a good proxy at the actual company level. Used prices overall have been headed lower.

Quarterly metrics since the COVID period are worth a drilldown to highlight the volatility of pricing and costs with such wild swings on used car prices.
A glance back at CPI rates in 2021 on used vehicle prices show levels that will be hard to repeat in the 30% and 40% range (see CPI Wrap for 2022: Befinning of the End? 1-12-23).
There is no shortage of benchmarks and data sources tracking used car markets, which are deep, transparent, and liquid from wholesale to retail with every week jammed with transaction volumes.
Among notable quarters in the chart we highlight 1Q22 and 3Q22 per-unit fleet costs per month in the $60 range. The 1Q24 per unit costs are more than double 1Q23 and 5x 3Q22 and 1Q22.

For FY 2023, Avis grew its Americas fleet to record average size, and that growth brings risks of how other car rental operators will react in terms of fleet planning and what that means for pricing risk as a key driver of EBITDA.
The global fleet is now back above where it stood in FY 2019 despite a smaller average fleet size in International.
Avis cited record sales of vehicles in 1Q24 to get its fleet size back down after some distortions from late deliveries of vehicles in 2023. Hertz also stated their goals to scale back fleet size, which we assume is part of the subtle signaling in this sector to others saying, “let’s not over-fleet like the old days and hurt pricing.”
As we detailed above in the metrics tables, revenue per day climbed to extraordinary levels during the post-COVID rebound in travel as tight new vehicle supply and a spike in air travel and consumer “experiences” saw demand increase dramatically in 2022 and into 2023.
RPD in the 70-handle range during 2Q22/3Q22 and 2Q23/3Q23 tells a bullish story in those periods for revenue flow-through into EBITDA. Strong pricing together with lower unit depreciation and gains-on-sale made for outsized margins across numerous quarters as detailed earlier.

Leverage (Net Corporate Debt/EBITDA) is unrealistically low as of FY 2023 given the lower depreciation of the post-COVID period, but vehicle depreciation will now start to normalize and drive leverage higher from the denominator level (i.e. Adjusted EBITDA) as vehicle costs (notably depreciation) climb in 2024 and vehicle financing costs take a toll.
Avis faces a new vehicle cost backdrop flirting with the upper tiers of record prices during the current fleet replacement cycle. That comes at a time when used car prices are no longer riding the used car inflation wave tied to high demand and a constrained new car supply that sent unit depreciation costs plunging in recent years.
Fleet funding activities and vehicle debt programs in the ABS market are much better understood in the market now after the Hertz Chapter 11 dramas and the threats by Hertz to devastate the ABS structures by challenging the legal structure and the asset coverage in those funding vehicles. The industry dodged that bullet and an orderly fleet downsizing ensued in 2020 with the ABS markets and banks breathing a sigh of relief.
We saw SAAR rates at recession level volumes in 2022, but that period is further behind the industry and more lease roll-offs and trade-ins will help the supply of used cars but offer less potential for lower unit depreciation. We are already seeing this in Avis and Hertz numbers in 1Q24 although HTZ numbers included massive EV setbacks.
The higher level and shape of the UST curve in the tightening cycle has raised the cost of fleet funding, but ABS markets remain cost-effective funding structures. More rapid easing by the FOMC would be a positive risk factor in 2024 if that can in fact take place given the pace of Fed easing now facing more doubts.

The above chart details the main uses of cash flow on an annual basis as broken out in the funds flow statement since 2015.
Capex and investment have been an important part of the Avis story in upgrading its technology and analytics, but stock buybacks were a dominant part of how cash was deployed.
We compare the buyback and capex lines in a bar chart below.
The dividend in FY 2023 was a one-time special dividend of $10 per share declared in Dec 2023.

The above chart delivers a stark visual on how much cash flow has been directed toward shareholders over the years. Shareholders have little reason to complain.
While the pattern may seem to leave the bondholders unloved and less inclined to expect Avis to prioritize more conservative financial policies, the history of deployment clearly demonstrates the cash flow resilience of Avis across a wide range of markets.
The post-2016 period was a rough backdrop for car rental fundamentals given the challenges from Hertz as it wrestled with a fleet mismanagement problem that hurt used car values at the time. Avis had more than its share of activist noisemakers during that period.
HISTORY AND HIGHLIGHTS
Avis has an interesting history looking back across its mixed ownership and M&A timeline for each of the Avis and Budget brands, the Cendant 4-way split and spin-offs of 2006 (Avis is the surviving legacy entity with the other three units spun off), the Avis acquisition of its European franchise in 2011 ($976 acquisition price for capital stock and repayment of $649 mn in debt), and the acquisition of Zipcar in 2013 ($473 mn).
Avis was in a protracted, competitive takeover battle in competition with Hertz for Dollar Thrifty (DTG) that saw the price of DTG soar and end up as an all-cash deal eventually double in price from 2010 to $2.6 bn in 2012. That deal ended up as a merger integration disaster for Hertz as well as stretching the HTZ balance sheet beyond repair once COVID kicked in. Avis was lucky to miss out on that DTG deal.
Avis (like Hertz) is in substance somewhat like two companies, one with the rental operation on one side and a fleet/ownership operation on the other. The corporate bonds and bank loans have as their obligor a branded asset-lite, tech-centric service operation (car rental).
The separate car ownership and funding business rents the vehicle to the service operation who rents those to leisure and corporate drivers. The job of the Avis Budget Car Rental consumer business is to price the rental vehicle at a level where the consolidated entity gets an economic return on the vehicle cost and related expenses, net of depreciation and sale of each vehicle.
Avis and Hertz corporate bondholders have no claim on the cars other than on the residual value net of vehicle funding debt. If you get to the point where you are looking at residuals on vehicles in potential ABS amortization events or a fleet liquidation, you are in deep trouble since it can feed into a downward spiral in secured claims from the bank lines supporting the overcollateralization.
Many investors were schooled on that mix of risks during the Hertz Chapter 11 process as they adapted to the concept of vehicle depreciation as a de facto cash expense over the life of the vehicles in the fleet. There was also an increased awareness of how the secured bank lines flow into the LOCs to support the ABS structures and overcollateralization criteria.
The quasi-variable nature of the fleet size allows car rental operators to liquidate fleet and generate cash across travel seasons, but the travel shock seen during COVID came on suddenly as the fleet became the world’s largest, most-expensive parking lot. In such a backdrop, the “rental service business” still was required to pay the “car ownership business” to service the ABS and vehicle funding debt. Otherwise, the structures can unwind and exacerbate the crisis.
What Avis lacks for excitement relative to the LBOs, IPOs, M&A excess, bouts of fleet mismanagement, and Chapter 11 filings over at Hertz, Avis also had a wild ride to the #2 position it holds today behind Enterprise. LBO rumors, shareholder activism and takeover battles also factored into the Avis history including an ESOP leveraged buyout deal back in the 1980s.
The theoretical direction of car rental companies includes the evolution of the service mix toward integrated mobility and fleet management services as EVs and AVs become a major part of the global fleet. That theme added long term valuation upside to the talking points of Hertz and Avis long term value, but those benefits are having a very rough time now, especially on EVs.