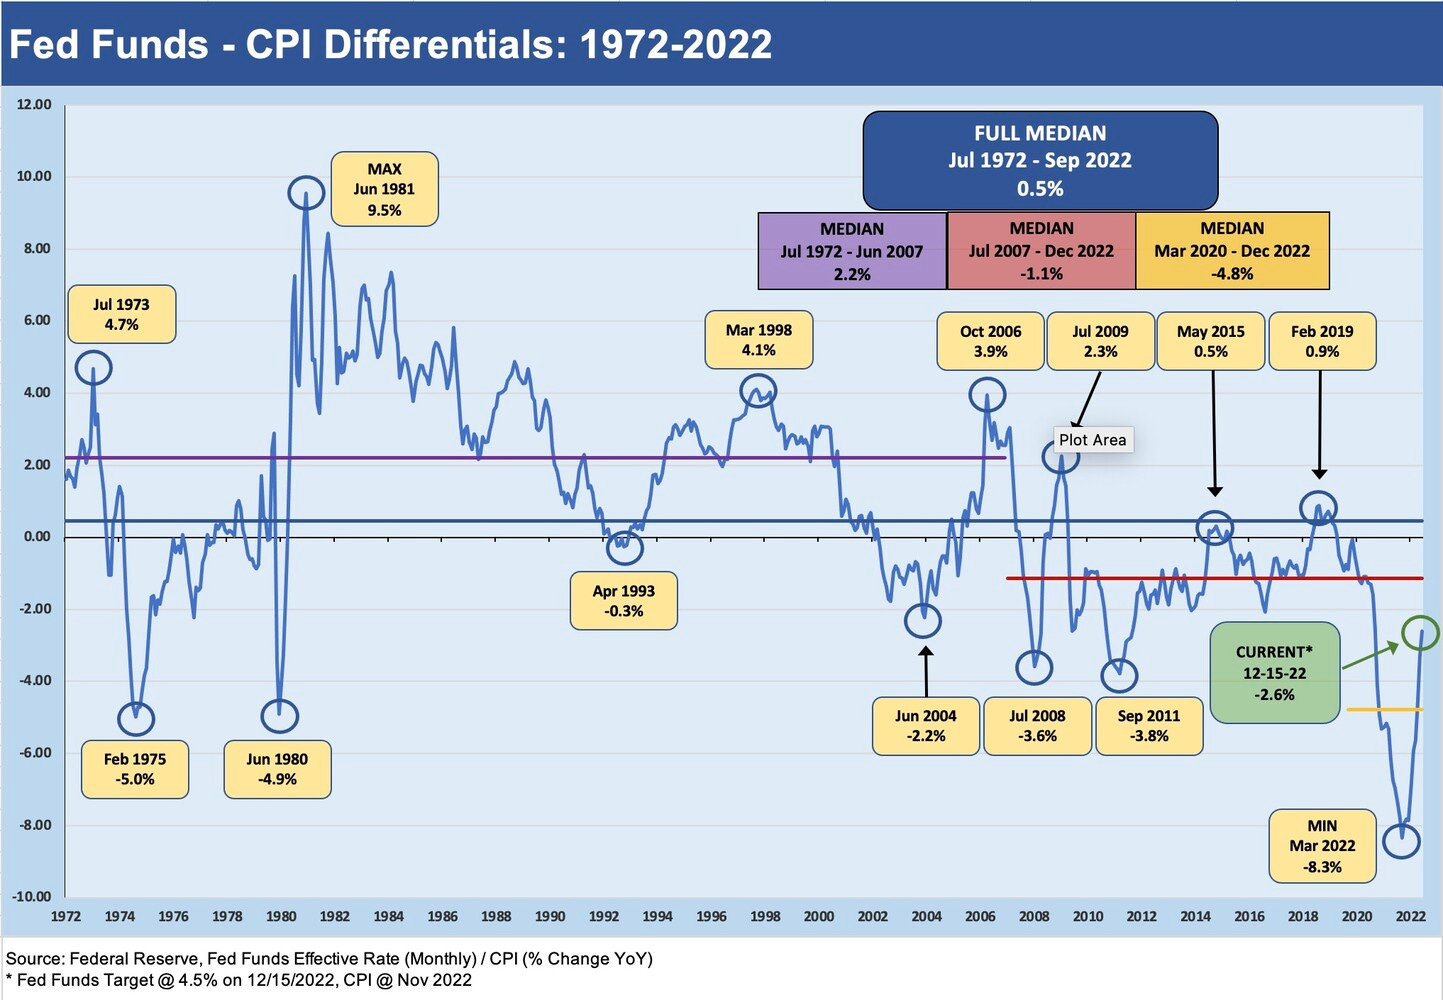
Fed Funds vs CPI: Narrowing of the Gap
After the expected 50 bps, higher dot plots started new angst on Fed predictability with 17 of 19 above 5.0% for 2023.
The 50 bps hike in fed funds after four 75s plus a pep talk on being really, really serious about inflation made for a less volatile equity market response while Powell was talking - even if it wavered a bit at the start.
One key takeaway was an increase in the FOMC median forecasted 2023 fed funds rate to 5.1%, up from 4.6% projected in the last meeting.
The dot plot saw 17 of 19 FOMC respondents above 5.0% for 2023 and only 2 below, so the dots are not signaling easing in 2023.
The Fed press release day and Powell’s press conference showed a less anxious market than the last one (see Fed Funds: Language and the Wicked), but a helpful CPI number this week likely contributed to the relative calm. The Fed hike of 50 bps was widely expected, but the Fed dot plot and forecasts surprised some with a projected fed funds median for 2023 of 5.1% vs. the 4.6% at the September meeting.
While few in the market set their GDP growth sundial by FOMC GDP forecasts, the 0.5% projected real GDP growth for 4Q23 qualifies as a soft landing and no recession. The market’s view on the UST curve appears to be signaling otherwise. Recession fears are alive and well, and the 4Q22 earnings seasons is going to be a key sentiment driver around the time the Fed meets again in 1Q23.
Our own take on the relationship of fed funds vs. CPI is that differential between the two is still out of line with history. The historical median as detailed in the charts herein show fed funds historically posting a positive differential for the median between fed funds and CPI. The post-crisis and COVID period had material distortions related to ZIRP, but history says positive real fed funds are the median – not negative. Right now, fed fund is 2.6 below the CPI at a 4.5% fed funds upper target vs. 7.1% CPI. The -2.6 points is a dramatic narrowing from -8.3 points in March, when inflation was rising with the Fed just getting off ZIRP.
The positive differential was notably the case in the Volcker Inflation years (see Fed Fund – CPI Differentials: Reversion Time?). The same positive differential holds true for fed funds vs. PCE inflation (see Fed Funds vs. PCE Index: What is Normal?). We refer you to those earlier detailed commentaries for some discussions of the histories, but our main point is that history tells a story, and the relationship begs an explanation. Volcker engaged in the protracted tightening for a reason.
We cover Fed histories in other commentaries and will be doing more on the 1970s and Volcker period of the 1980-1982 double dip in future write-ups. Please note that the chart above plots monthly averages for fed funds, so the 19% handle max in the Volcker years does not include some brief crosses into 20% handle rates along the way on some days.
We have not seen 7% inflation since the early 1980s and the same for 6% handle Core CPI, so the logical comps are the Volcker years despite the radical difference in the economy and market structure. That has made the handicapping a real challenge since most in the market have not seen inflation. On the other hand, that time gap helps in making inflation expectations stay sticky in the survey. Powell made it clear that he does not want the expectations support to weaken. For many, stagflation is a history lesson, and the FOMC does not want it to infect market sentiment for the new generation. The CPI trend has been friendlier with energy prices down, but the wage inflation and employment wildcard has not been helpful (see Jobs Conundrum: Good is Bad, Bad is Good).
The running time horizon across these charts for the 1970s through 2022 shows the wide range of market backdrops. Inflation horror stories abound, and the wage-price spiral is going to be major fear into 2023 unless job openings get dialed back. The FOMC median forecast for unemployment in 2023 is 4.6%. That is a pretty strong number in historical context. In the “old days” that could qualify as full employment. Getting inflation down and wage demands lowered could mean demand destruction and hiring headwinds are both needed. That usually means recession, and that is where the UST curve and Fed forecasts diverge.
The point is that inflation needs to come down more quickly or interest rates need to keep heading higher. The most recent CPI print of 7.1% (see Inflation: November Big 5 Buckets and Add-Ons) is still materially above the fed funds upper target forecast for 2023 of 5.1%. The two will need to meet there sooner rather than later. Median PCE inflation (the Fed’s inflation metric of choice) is forecasted at 3.1% in 2023 by the FOMC. Fed funds since the early 1970s ran +1.1 points ahead of PCE. CPI ran around 0.4 points at the median above PCE over that time horizon. They are just cyclical histories and defined economic indicators, but there is a logic to fed funds being slightly higher than inflation (positive real fed funds). The question is “When do we get there?”
The worry in the market is that the Fed will not move aggressively enough to break inflation’s back and that the market will see a replay of the 1970s as we frame in the above chart. The 1973-1975 recession started off with the Arab Oil Embargo and first oil shock (see Inflation: Events ‘R’ Us Timeline). The historical lookbacks often say the Fed did not do enough to reel it in once and for all. They tried to finesse a knife fight. That is not the way history looks back at the later Volcker regime and his approach to fighting inflation. The Volcker approach had the nuance of a Viking raid and it ruffled feathers on the Reagan team. But he won.
The above chart drives home the effect of Volcker’s monetary growth targeting program, which saw fed funds float and hit 20% on multiple occasions. Fed funds started high after he arrived in August 1979 (oil shock #2), and his inflation battle and the very high fed funds rate vs. CPI ran well into the next recovery. We would highlight there were a few major swings down in fed funds under Volcker that were incidental to the monetary growth targeting (i.e., fed funds allowed to float), but the theme was still all about tightening liquidity.
Without saying “past is prologue,” some forecasters have called for a similar scenario although at much lower Fed funds rates to battle the much lower inflation of today vs. what Volcker faced. The low confidence scenario is that Powell will battle inflation back with a mild recession and then ease. Then the market will face a fresh inflation spike and a more severe downturn later. This may be somewhat of a Back to the Future risk of a 1970s/early 1980s replay from some bears, but it is a debate to have. The globalization of trade combines with geopolitics and a lot of stress in the world and supply chain risks to make for a wide range of scenarios (see Risk Trends: The Neurotic’s Checklist).


