

The new home sales data show declines on a SAAR basis MoM (-6.2%) and YoY (-11.3%) volume declines even as the spring season is rolling in. The market saw another one of those “higher prices with high inventory” backdrops. Total inventory was up +1.7% MoM and down -2.2% YoY. On a Not Seasonally adjusted basis, the YTD 2026 sales decline stands at -6.5%.
The volumes show 3 of 4 regions down MoM and YoY with only the West higher. The South region at 59% of total sales was down -9.8% MoM and -14.7% YoY. That mix shift by region presumably explains the higher median prices with the pricier West being the region that saw material increases in sales.
The $422.5K median price bucks the trend seen in the 1Q26 reporting season with numerous major builders reporting lower ASPs.
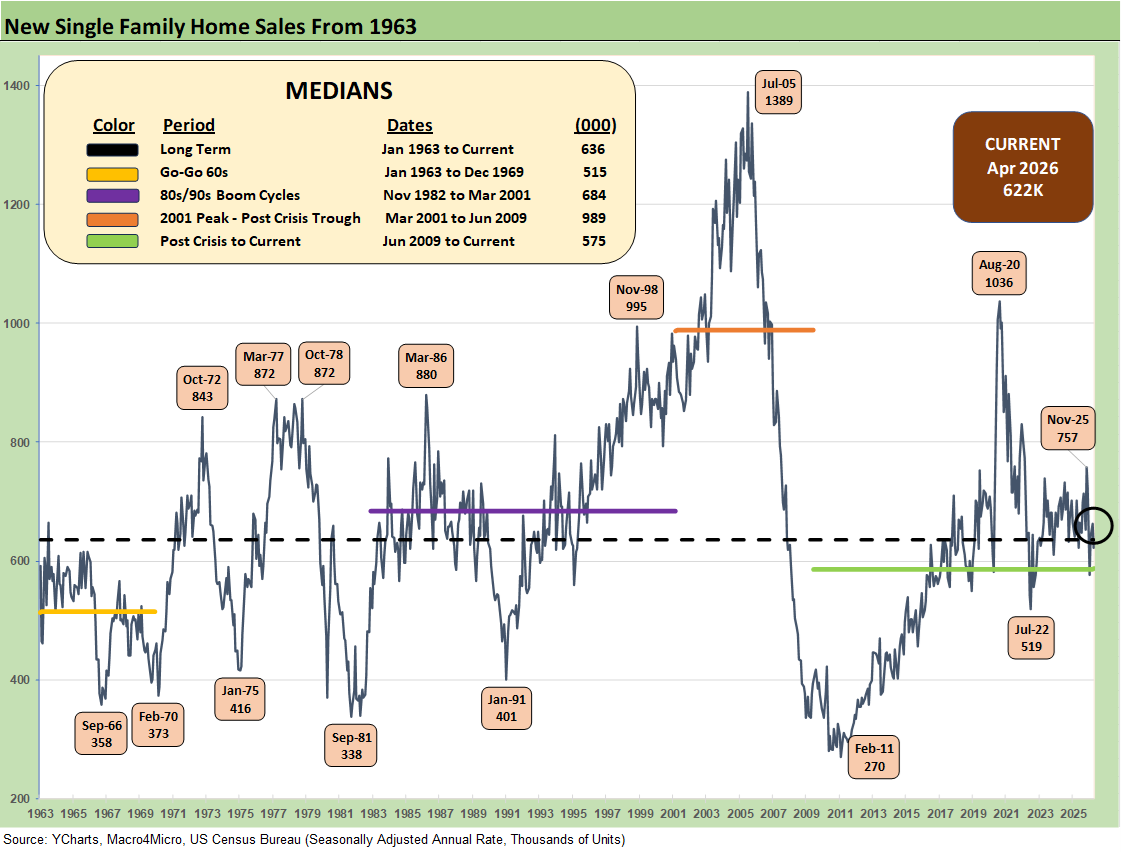
The above chart updates the new single family home sales series from 1963, and the current 622K (SAAR) still marks a healthy rebound relative to the grim Jan 2026 number (576K revised). That said, the 622K is still weak in the context of 2025. The volumes are in the range of the long-term median but well below the 1980s/1990s.
The median of 989K in the housing boom/bust cycle from 2001-2009 is almost 60% higher. As we look back to the peak of the housing bubble, we see 1389K in July 2005 at over 2x the April 2026 volume. The COVID panic buying and relocation spree in Aug 2020 saw sales of 1036K as a wild period for new home sales and home starts in a ZIRP market with very low mortgage rates.
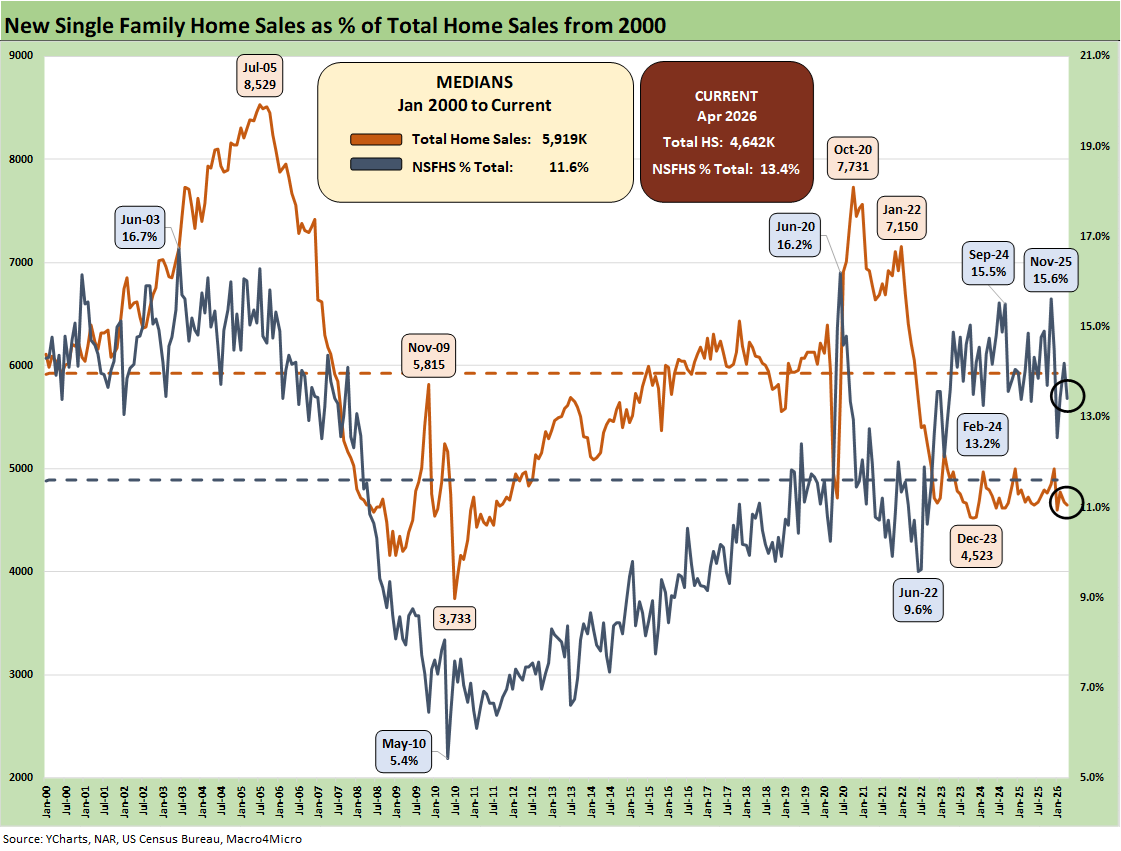
The above chart plots the share of total home sales (new + existing) that were captured by the “new home” builders. We see the share is now at 13.4% vs. the long-term median of 11.6%. When inventory is scarce, the right home at the right price wins. The challenge overall for new home sales has been mixed for builders by region. Major buyers generally report gross margin compression in 2026 and guided to similar expectations.
The market edge favors builders vs. existing home sales (note: existing is still the vast majority of volume). The homebuilder has the ability to use incentives and financing support (see Existing Home Sales April 2026: Steady or Clinging? 5-14-26).
Given the headwinds for volume in the existing home sales market in mortgage refinancing (golden handcuffs,” etc.), the shortage of existing housing inventory at economic all-in costs (price and mortgage rates) has been a recurring drag (see Existing Home Sales March 2026: New Beginnings or New Ends? 4-15-26).
D.R. Horton as the #1 US homebuilder offers a useful microcosm of the new home challenges (see D.R. Horton: Financial Powerhouse Despite Cyclical Softening 5-20-26). The 6% handle mortgage rates have been a struggle and had moved briefly as high as 6.75% before easing back to 6.6%.
The new home sales volumes are softer overall, and that can vary by region and product tier. On the other hand, the higher prices posted this month are not consistent with some of the color we hear from major builders on prices and narrowing gross margins.
Incentives are still a material part of the builders’ selling strategies, but the bias on ASPs should be downward extrapolating from some of the major builders. For example, the average selling prices in the recent quarter for DR Horton, Lennar, Pulte, and NVR among the biggest names all posted lower average selling prices. The census release points in the other direction for April.
The mid 6% handle mortgage rates are not offering relief on monthly payment pressures and affordability. The past week shows the 6.6% area in surveys as reported by Mortgage News Daily. The 10Y UST is the key benchmark for the direction of 30Y mortgages.
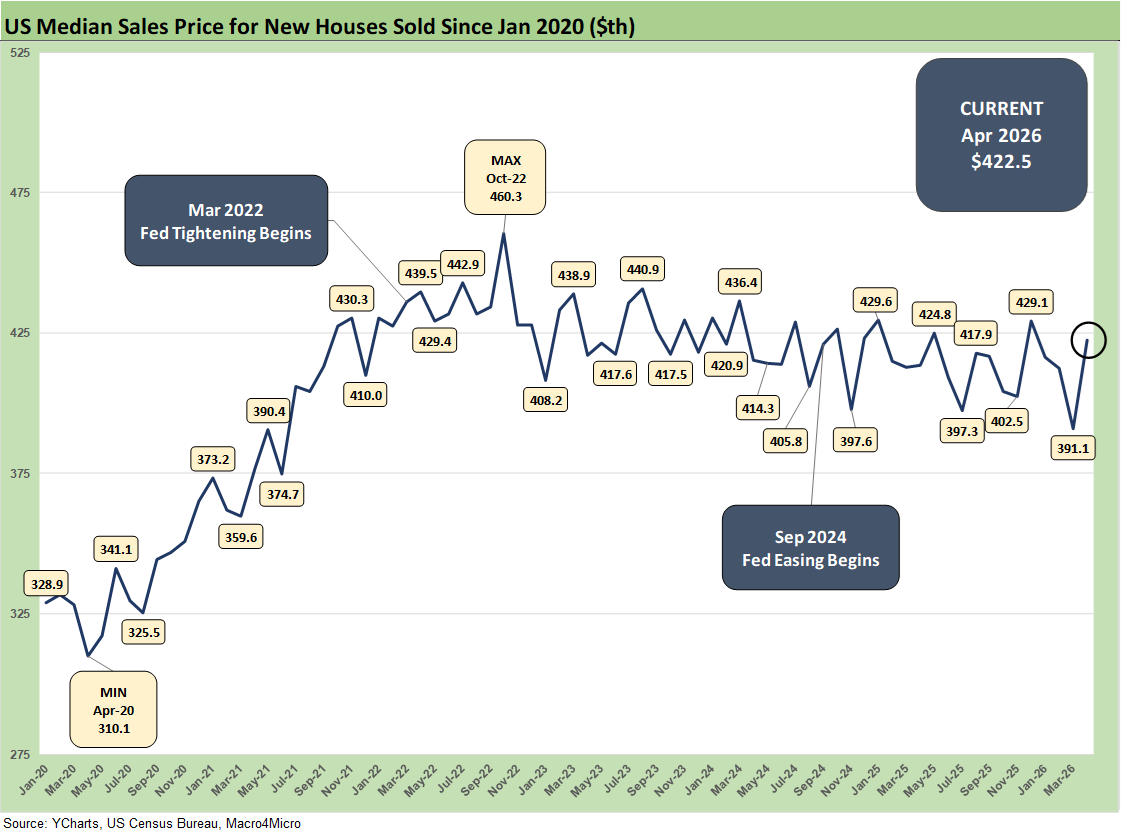
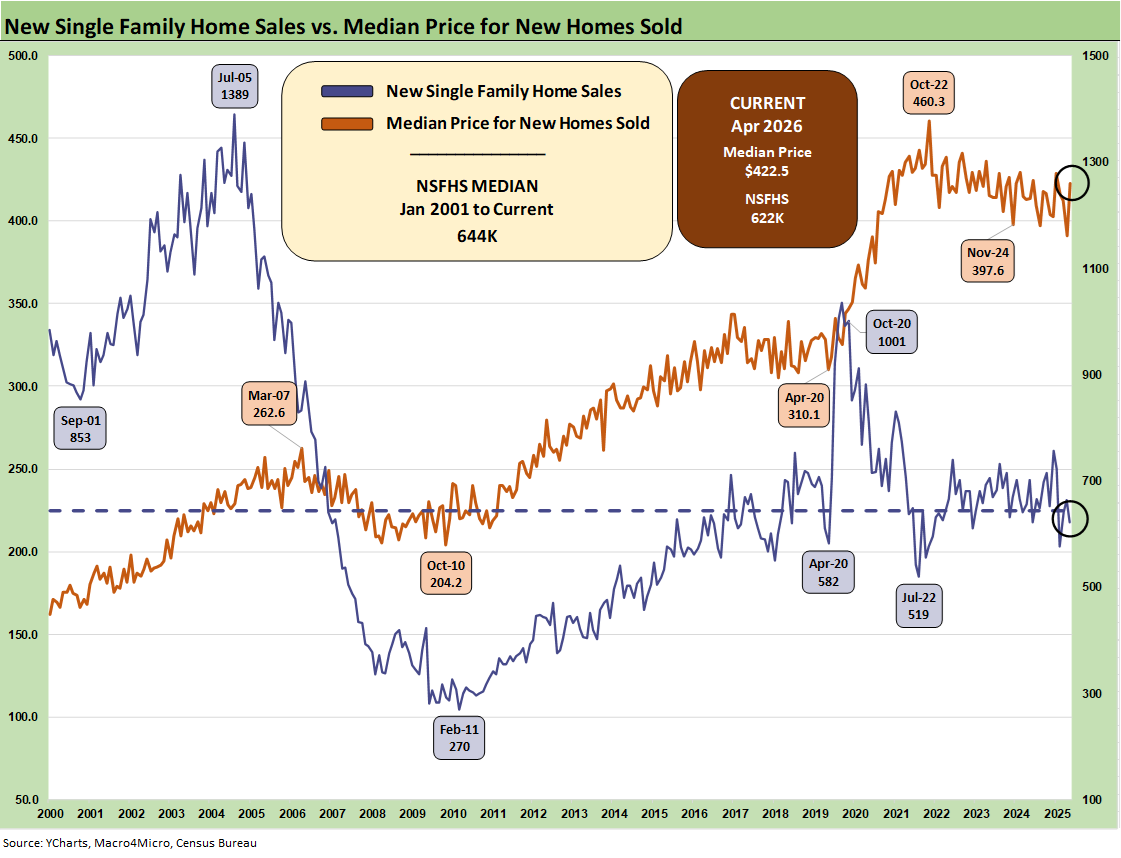
The median price time series above tells a simple story that prices had been under modest pressure after a period of record highs and a long stretch over the $400K threshold with a few dips below the $400K line.
As noted above, the move higher to $422.5K in April 2026 is bucking the trend after $391.1K last month. Lower average selling prices have been seen in the first quarter for a sampling of major builders. The trend could be explained as a matter of geographic mix with the volume declines in such regions as the South with its lower ASP mix. Meanwhile, the West rose with its traditionally higher ASP mix.
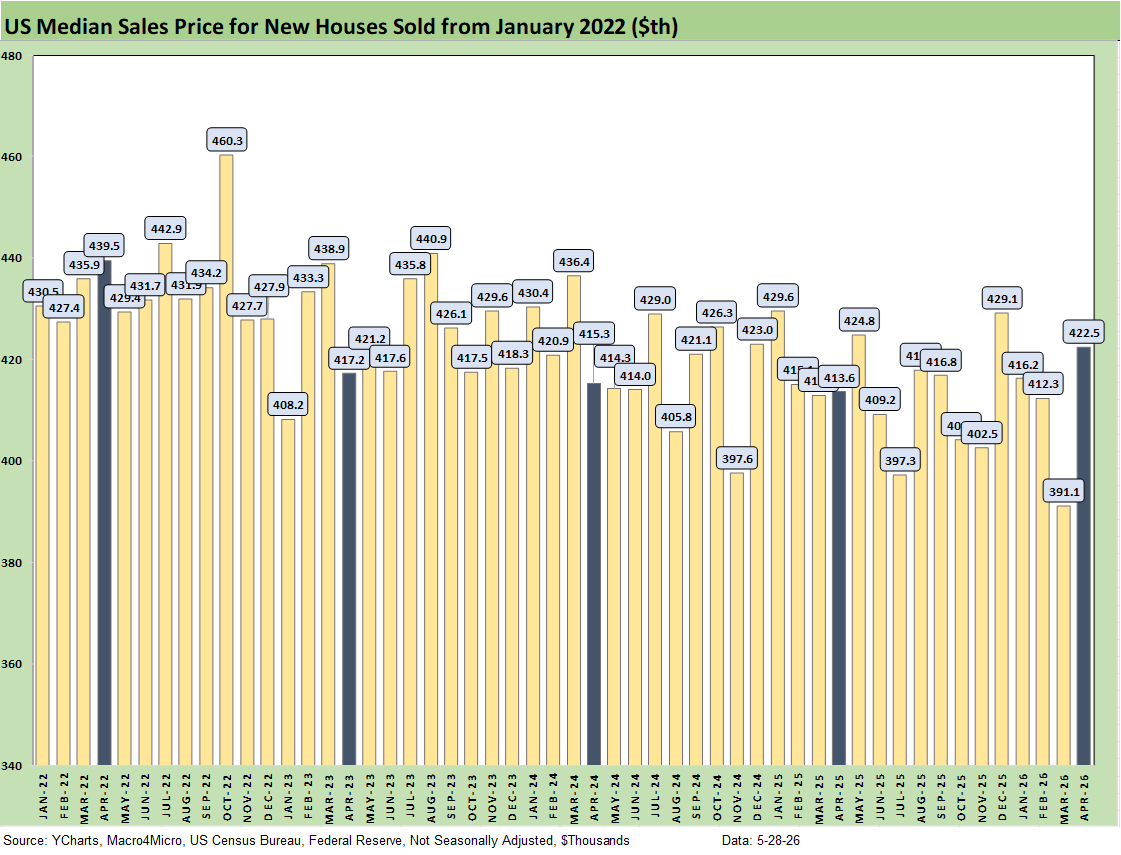
The above chart gives a different visual angle on the median new home sales prices from early 2022. That is a lot of $400K handles with some sub-$400K outliers. The current $422.5K posted a sharp rebound from $391.1K. The price metrics can shift with regional mix as well as home price tiers and related supply issues. The affordability question is still intertwined with the monthly payment pressures from mortgages. It is about more than price.
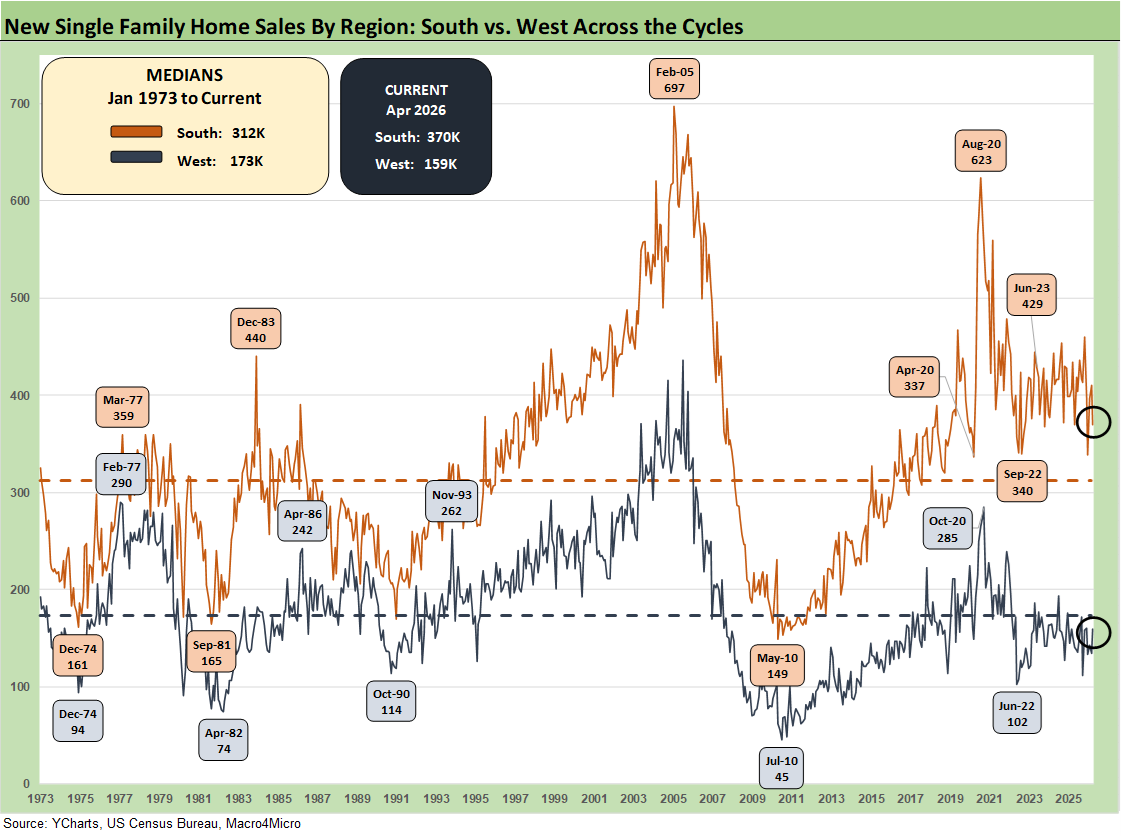
The time series above updates the new single family home sales across the cycles since 1973 for the #1 and #2 regions of the South and the West. The 370K for the South is around 59% of the total of all single-family new home sales (SAAR) and marks a sequential decline of -9.8% from March 2026 and is down by -14.7% YoY. The West at 159K is 26% of the total. For the month, the West was +18.7% sequentially and +4.6% YoY.
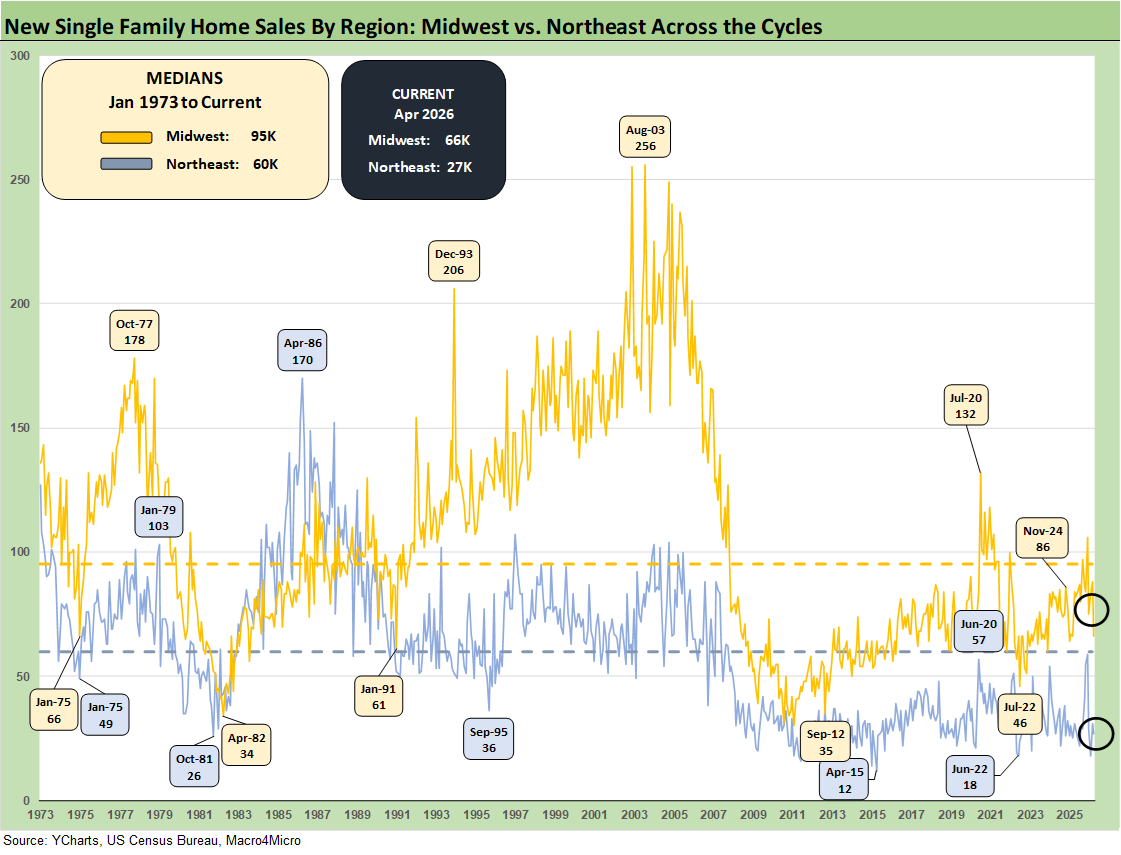
The timeline for new home sales for the smaller Midwest and much smaller Northeast market is detailed above. The Midwest (11% of total) was -25% sequentially and -21.4% YoY. The Northeast market (4% of total) was -12.9% sequentially and -12.9% YoY.
See also:
PCE Inflation: Income and Outlays April 2026 5-28-26
GDP 1Q26 Second Estimate: Shrunk in the Dryer 5-28-26
Market Commentary: Asset Returns 5-26-26
Retail Equity Comps: Looking for Signals 5-26-26
Housing Starts April 2026: Soft Starts in Single Family 5-22-26
D.R. Horton: Financial Powerhouse Despite Cyclical Softening 5-20-26
Taiwan: Stakes are High, US Awareness is Low 5-17-26
Industrial Production April 2026: Bringing a Lift 5-15-26
Existing Home Sales April 2026: Steady or Clinging? 5-14-26
Producer Price Index April 2026: Heat Rising on Cost Inputs 5-13-26
CPI April 2026: 4.1% All Items Less Shelter, 30Y UST 5% 5-12-26
Employment Situation: April 2026 5-8-26
JOLTS March 2026: Openings Down, Hires Up, Layoffs/Discharges Up 5-5-26
Synchrony Financial: Favorable Consumer Credit Signals 4-24-26
The US as an Aspiring Emerging Market: Fiscal SNAFU, Political FUBAR 4-6-26
Market Lookback: Confusion Reigns, Dislocation Pours 3-22-26
Market Lookback: The Gulf of Cause and Effect 3-15-26