
May 2024 CPI: I Feel Good, Not Sure That I Should
The plot is always thick, and a good CPI in May keeps it that way even as a very stubborn total Services CPI at a 5% handle follows a strong jobs number.


A broad mix of zero and negative monthly numbers rolled up to progress on CPI as some headline-oriented consumer focal points drove a headline CPI downtick to +3.3% in May from +3.4% in April alongside a Core CPI decline to +3.4% from +3.6%.
In the tailored benchmarks, we see “All Items less shelter” tick slightly lower to +2.1% while Durables deflated more to -3.8%, but multiple cuts of Services that we watch all came up with 5% handles the week after the Services payroll counts were strong.
The volatile Energy line was up YoY during May to +3.7%, but the MoM metrics posted some key negative lines in overall Energy (-2.0%), Gasoline (-3.6% for May), and Energy Services (-0.2%).
Food inflation remains in check with Food at Home at +1.0% YoY (0.0% MoM), but as we have covered in past commentaries (see Inflation Timelines: Cyclical Histories, Key CPI Buckets 11-20-23) Energy can deflate materially whereas across history food overall (as opposed to narrow product line items) does not have a history of repricing back to where it started.
The market was celebrating already with stocks sharply higher as we go to print while the 10Y UST is down over -13 bps with the 2Y UST down by -15 bps. The FOMC dot plot and Powell will hit the screens this afternoon.

The above chart is from Table 3 of the CPI release, and the news is good in some areas and stubborn in others. The “All items less shelter” line at +2.1% YoY (-0.2% MoM) and “All items less food, shelter, and energy” line at +1.9% (0.0% MoM) are both down sequentially.
The various cuts of Services CPI we like to watch with each release are coming up at all 5% handles in this mix as noted above. That has to be respected in the equation given that we live and breathe in a Services economy. We see Durables deflating and this month showed some more YoY deflation in used and new vehicles. The good news in these 5% handle services lines is that they were all lower sequentially on a MoM basis. So that takes some of the edge off the stubborn 5% optics.
We can leave the faculty club food fight to figure out the merits and shortcomings (or to some the perfection) of the housing inflation measuring sticks they use. We have commented on that enough. There are a lot of real time data services and experts out there commenting on apartment and single family rental trends that signal the lag effects are supposed to flow into the shelter CPI numbers with favorable results. The sound economy, record payroll counts, and rising wages and how that will flow into digesting the multifamily (and dedicated single family rental) supply is still being battled out.

The above chart looks at the Big 5 we use each month. We already cited food and energy in the bullets and those have been a better part of the story. These 5 buckets above add up to over 75% of the CPI index.
We include a tailored Automotive category that extends beyond the new and used vehicle lines (see Automotive Inflation: More than Meets the Eye10-17-22) since the cost of owning a vehicle has a heavy weighting in household budgets when you add in those single line weightings. The rising interest costs of borrowing to buy a new or used car and auto insurance get more headlines of late. Dealers make a lot of money on their parts and services businesses for a reason.
We look at the Shelter details in the chart above, and that 5% handle level is hard to shake. Shelter rolls up to over 36% of the CPI index in a seriously outsized impact. Imputed metrics have been getting a lot of debate time from the Nobel Laureates and armchair economists of late.
With respect to OER within Shelter, we still go with the view that it violates the “consumer checkbook rule.” Those of you who have no mortgages and a home sharply higher in value over the past few years should not feel guilty about causing inflation under the Owners Equivalent approach used by economists. You can peacefully go back to no monthly mortgage payments and owning a much more valuable asset.
We note that Medical Care is heading the wrong way with the Medical Care Services CPI index rising sequentially to +3.1% from +2.7% and Medical Care Commodities up to +3.1% from +2.5%. With Trump determined to erase Obama from history and cancel the ACA, the critical drivers of health care costs and their role as a consumer and household financial health variable should be back on everyone’s radar screens. This past week, the move by the CFPB to remove medical debt from consumer credit reports is worth pondering if medical inflation continues on this path. Those financial burdens are already quite high for many. The Biden White House has jumped on this topic as well.
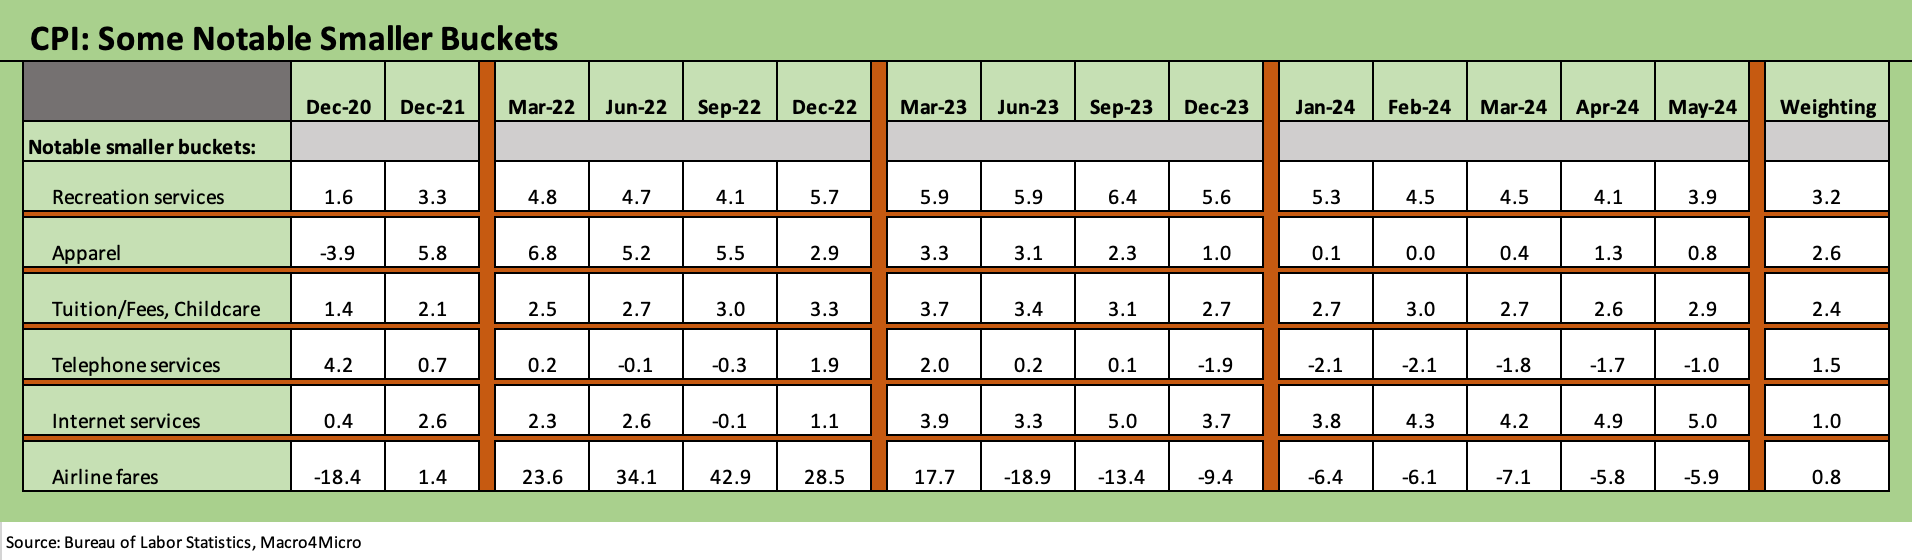
The above chart frames the trend for what we call the “add-ons” in categories near and dear to many households. These lines add another 11.5% of CPI index weighting. Together with the earlier Big 5, the lines in the two charts cut across almost 87% of the CPI index.
The mix above shows sequential YoY trends mixed. We see 3 with lower YoY inflation and 3 with higher YoY inflation. Two of the lines (Telephone, Airline Fares) are already in deflation mode. The two biggest lines (Recreation Services, and Apparel) are both lower sequentially. Apparel was negative in MoM. Recreation Services was also. Airline fares are heavily wagged by oil and how that flows into aviation fuel.
Revisiting Energy and Food…
Below we update the long term charts for Food and for Energy as a reminder of energy’s volatility and the tendency of food to not revert into heavy deflation after bouts of price pain. Unlike Energy, a stretch of ugly Food inflation can see inflation plunge, but deflationary retracing has not brought the happy endings of Energy.
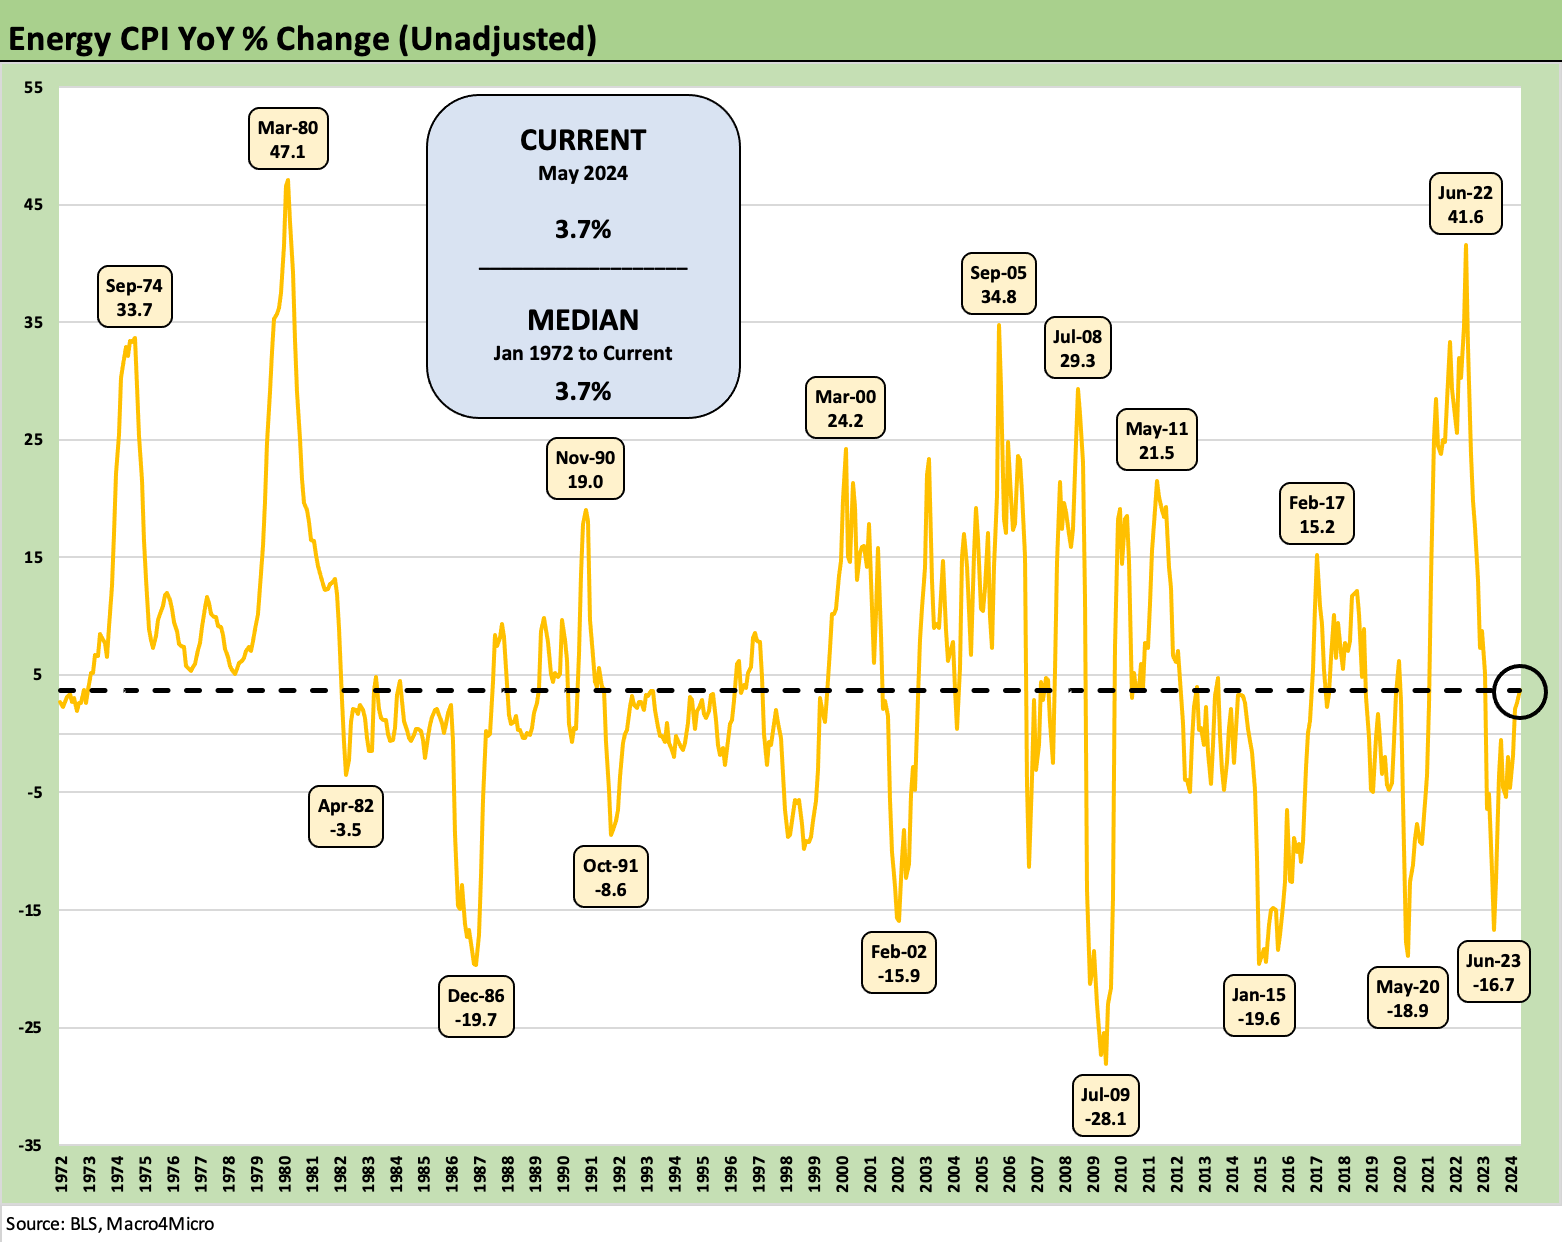
Energy is a well-known crazy rider across its own distinctive cycles. The collapse in the 1980s was brutal for the oil patch. The shale boom collapse and Saudi price wars left scars on banks and securities holders but gave the broader economy and consumer a massive tax cut. The 1986 collapse of oil brought a regional economic disaster including a Texas bank system crisis. The 2009 post-crisis plunge was quickly followed by the unconventional drilling boom in the US with supply and demand both soaring. The 4Q14 to 1Q16 plunge brought record E&P credit default rates. There is always a policy element to be framed, but generally it is old school supply and demand for commodities.
The idea of blaming the guy in office for higher oil prices has been a practice that is conceptually dumb but a great tradition. You don’t see many people running for office claiming credit for the collapse of regional economies and widespread industry financial stress when oil and gas plunges.
Global commodities such as oil and more regionalized supply-demand trends such as natural gas still get wagged by global and regional cycles (demand) and by cartel behavior (OPEC supply). The debt-financed shale boom was in a class by itself in the US. Right now, we are in the $70 handle netherworld.

Food inflation is the biggest problem for anyone running for reelection. The trips to the market offer constant reminders. Returning to the good old days of earlier food pricing backdrops does not have history on its side when it comes to the aggregate negative CPI moves after pronounced inflationary periods.
See also:
Trade Flows: More Clarity Needed to Handicap Major Trade Risks 6-12-24
Footnotes & Flashbacks: Asset Returns 6-9-24
Footnotes & Flashbacks: State of Yields 6-9-24
Payroll May 2024: The Wave Continues 6-7-24
JOLTS April 2024: Shorter Line but Not Short 6-4-24
Construction Spending: Stalling Sequentially at High Run Rates 6-4-24
PCE, Income and Outlays: Lower Income and Consumption, Sideways Inflation 5-31-24
1Q24 GDP: Second Estimate, Moving Parts 5-30-24
Durable Goods: Staying the Cyclical Course 5-24-24
New Home Sales April 2024: Spring Not Springing Enough 5-23-24
Existing Home Sales April 2024: Pay More, Get Less, but More Available 5-22-24,
Industrial Production April 2024: Another Softer Spot 5-16-24
Housing Starts April 2024: Recovery Run Rates Roll On 5-16-24
CPI April 2024: Salve Without Salvation 5-15-24
Retail Sales April 2024: Get by with a Little Help 5-15-24
Consumer Sentiment: Flesh Wound? 5-10-24