


What do you mean it is canceled!? I thought Trump loves ICE?
May wraps up a month for the ages in tech but at a time when risks show a wide range of potential outcomes that include some wildly unpredictable flow-through effects.
Tech returns were stunning on a weekly and monthly basis with even the SaaS services names climbing out of the pit. Oil prices dropping from $105 handle WTI to $87 in two weeks helps on a numerous fronts even if the odds of easing by the Dec 2026 FOMC meeting have faded to essentially zero with the odds of 3 hikes higher than 1 cut.
Domestic political instability in the US and a basic lack of analytical factual focus in Washington on major economic risks (micro, macro, geopolitical) make the chaos hard to price. Iran could escalate dramatically or simply go away as the market would then look past the readjustment process for energy and commodities into 2027. Partisan distortions (aka lies) often rule the dialogue.
The good news is that Vanilla Ice and half of Milli Vinilli may fade as a discussion point except on Truth Social posts in the middle of the night. Even Morris Day gave Trump The Bird.
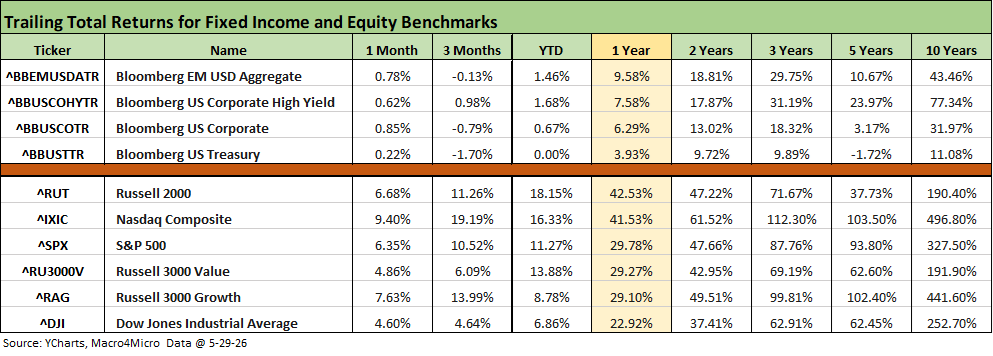
The above table updates returns for the debt and equity benchmarks we track. Debt is back to all positive for the trailing 1-month but negative for 3-months in three of the four most exposed to duration risk. HY is still holding in at positive for 3-months even if at a subpar positive YTD run rate featuring compressed spreads.
Equities have obviously been a very different world than fixed income with especially impressive run rates in tech heavy benchmarks. The 1-month and 3-month timeline for growth benchmarks have been dazzling even with software and SaaS-based services operators taking a beating as we review in the “Tech Check” charts below. Some SaaS and Software names are back in rally mode.
Breadth has no bragging rights at this point for the large caps but the subsector allocators and stock pickers can still excel outside of tech. Energy has been an obvious winner YTD subject to volatility, but the small cap Russell 2000 and Midcaps also have been strong performers. In the industry mix, the YTD chart further below shows Industrials (XLI), Base Metals (DBB), and Materials (XLB) in double digits YTD on the very high fixed investment that we see in the GDP lines. Some have also been direct beneficiaries of the Gulf supply disruptions (e.g. aluminum, petrochemicals).
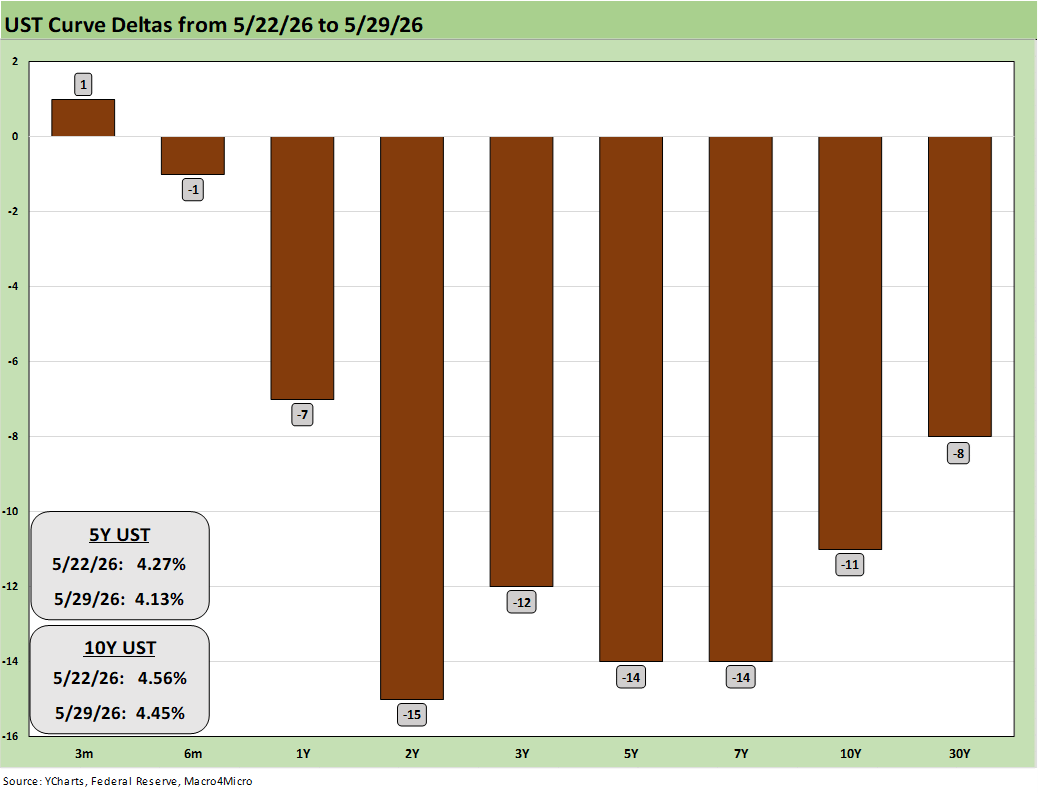
The above chart updates the UST deltas in a week when oil was lower and hope for an Iran deal was rising. WTI was at an $87 handle Friday after $96 last Friday and $105 the prior Friday.
As we go to print Sunday, CME FedWatch shows odds of 1 cut by the Dec 2026 FOMC meeting stood at 0.2% while the odds of 3 hikes was 0.9%. The probability of unchanged leads the odds at 51.8% while 1 hike stands at 37.9% and 2 hikes at 9.2%.
Those probabilities whip around, and the UST market is anxiously awaiting new on a deal with Iran. That outcome will set off a fresh round of handicapping on where that will take crude oil and gasoline during peak driving season. The inflation anxiety is high with peak refinery runs for gasoline, diesel, and jet fuel facing high feedstock prices now. That flows into surcharges and operating costs for the food chain from farmers to delivery and freight costs.
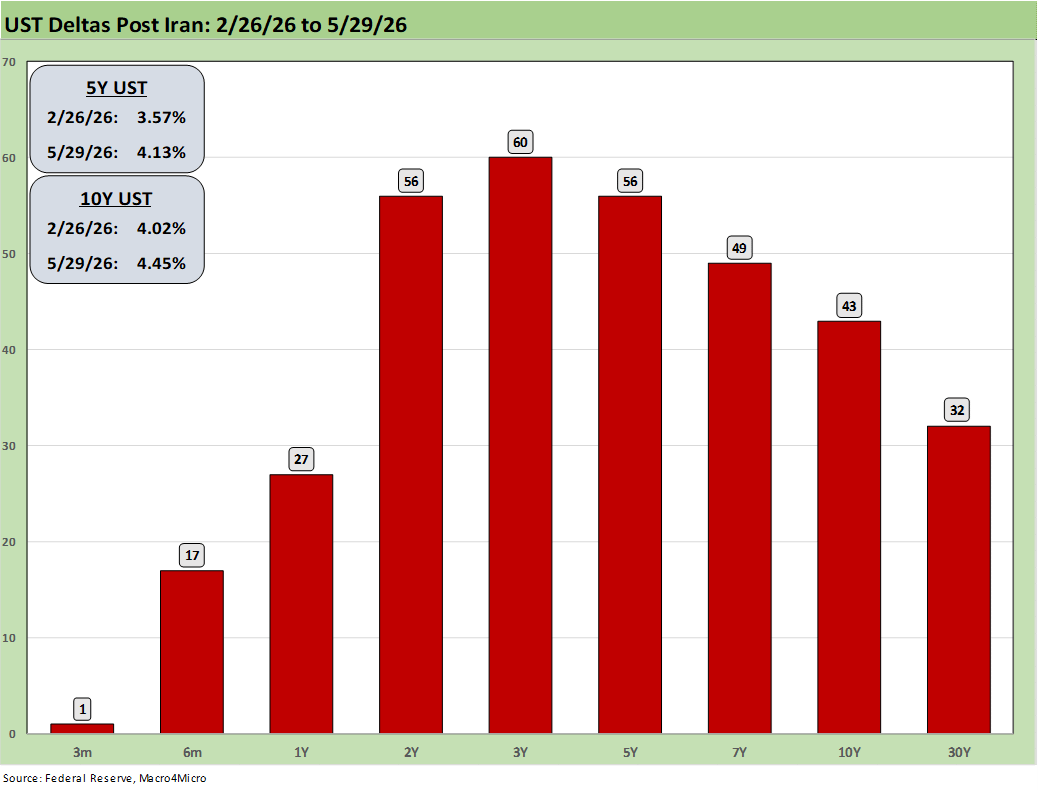
The above table updates the UST deltas from the period just before the bombing started in Iran. This past week brought the rate deltas down but credit card financing costs, durables financing (e.g. retail financing), and certainly mortgage rates are more headwinds hitting household cash flow flexibility.
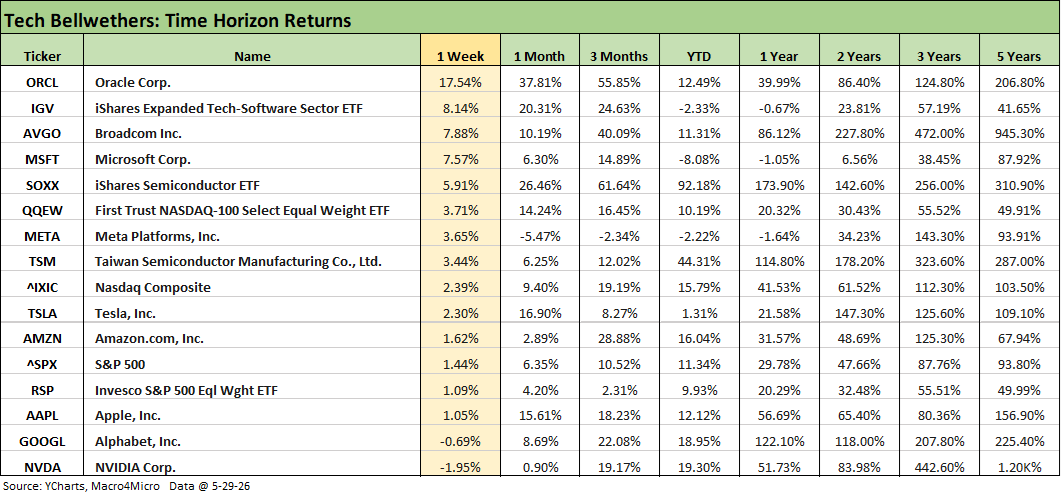
The tech bellwether update showed only 2 lines in the red this week with two Mag 7 names – NVIDIA and Alphabet. The top tier had blowout weeks in this mix with Oracle (ORCL) at +17.5%. We look at a wider range of tech names in the “Tech Check” list further below, where ORCL was an “also ran” relative to the +42.6% for Dell and over +29% for Micron (MU).
A notable move on the above list was the Software ETF (IGV) and its position as #2 this week. IGV beat out the Semiconductor ETF (SOXX). As we detail below in the “Tech Check” chart below, we see some beaten-down software and SaaS names making a comeback with ServiceNow (NOW) at +21.8% and Palantir (PLTR) at +14.4%. Oracle is also a major holding in IGV as is Microsoft (MSFT) and Salesforce (CRM) that all posted solid weeks.
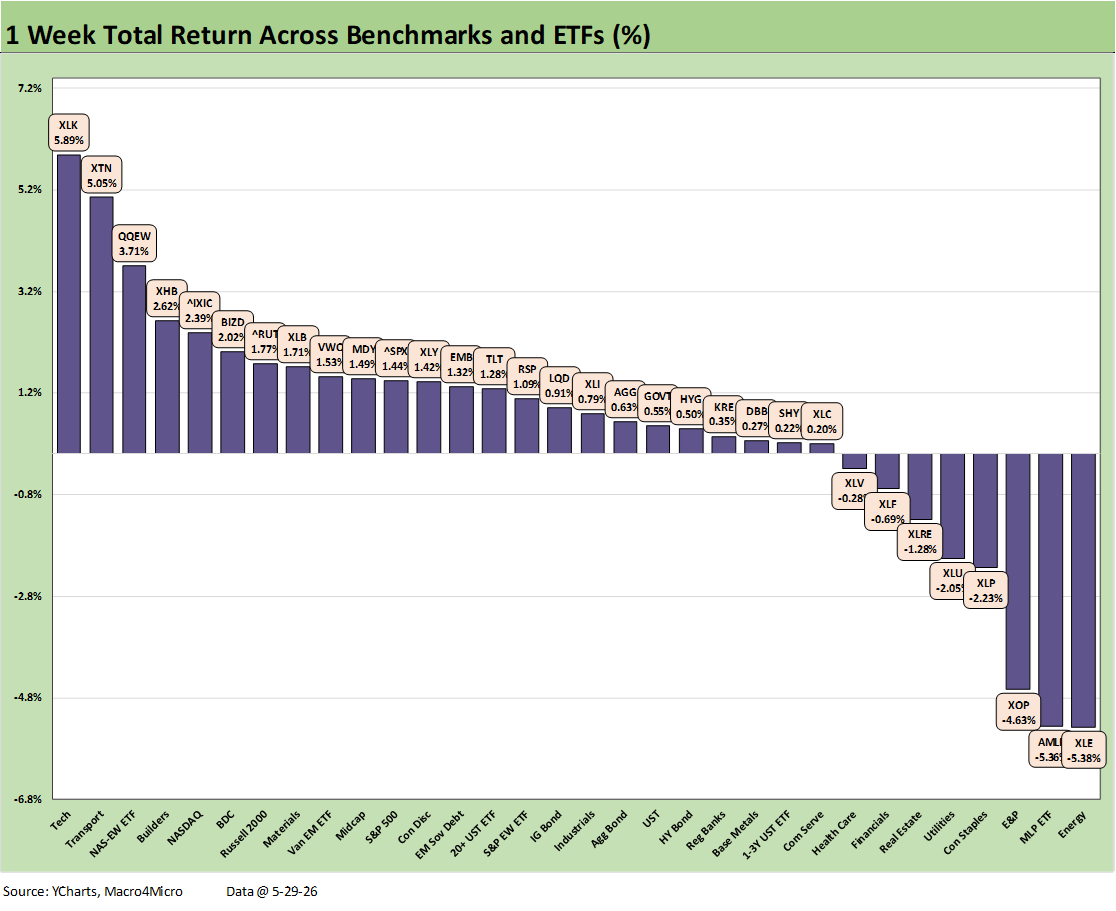
The following is an edited and updated cut-and-paste from our weekend LinkeIn post on the weekly asset returns:
We update weekly total returns for the mix of 32 benchmarks and ETFs. The obvious themes are tech is still booming, oil is lower, and rates are lower. Only the Russell 2000 joined the NASDAQ in the top tier with the S&P 500 and Midcaps (MDY) in the second tier. The S&P 500 saw 6 of 11 sectors positive with Information Tech and Consumer Discretionary carrying the week partially offset by Financials and Energy.
Iran handicapping flows into numerous rate-sensitive sectors but factors into consumer sector handicapping. We looked at retailer performances last week in a separate commentary and will update that later. Retail results were mixed overall but no red flags. We see general concerns around price sensitive shoppers and value brands but not a case of broad gloom based on traffic and sales trends.
Another banner week for tech keeps the record index streak going for the market benchmarks. The Tech ETF (XLK) weighed in at #1 with the Equal Weight NASDAQ 100 ETF (QQEW) at #3 and NASDAQ at #5. Lower oil gave an immediate lift to airlines and the Transport ETF (XTN).
Homebuilders also felt tailwinds with mortgages declining from the recent 6.75% peak now slightly under 6.6%. The news from builders has generally been unfavorable but a monthly rebound in the Census “New Home Sales” release was impressive. We cover that in our Macro4Micro Substack.
For the UST curve effects, all bond ETFs are positive this week with 4 bond ETFs in the third quartile and 3 in the second quartile, where bond ETF returns are led by the EM Bond ETF (EMB). The next move on Iran will be a critical risk-reward variable this coming week (if Trump decides or counters). Trump is learning that Iran is not like Congressional GOP game theory where all orders and ultimatums lead to surrender. The memo on the “martyrdom thing” never got to him. SCOTUS is not his refuge from Iran’s fanaticism.
As noted earlier, the odds of the Fed easing by the Dec 2026 FOMC meeting remain negligible even though the probability of a cut rose from 0% in recent weeks to 0.2% this week. By comparison, the odds of 3 hikes stand at 0.9% (as of Sunday mornin). The high probabilities still favor no action (51.8%) with the odds of 1 hike at 37.9% and 2 hikes at 9.2%.
The low potential for easing has weighed on Financials (XLF) in the bottom quartile and Regional Banks (KRE) in the third quartile with interest margins a question and asset quality a mix of private credit concerns (notably for KRE) and consumer worries that are only slowly surfacing (credit cards).
The BDC ETF (BIZD) popped up into the top quartile with more of the big players making efforts to beef up disclosure and tackle the worries head on with clear statements and transparency. Otherwise, extrapolation will run amok with each new blowup in the private credit sector and gets mapped onto the entire, highly diverse asset class.
The bottom 3 asset lines in the low quartile cut across diversified Energy (XLE), Midstream (AMLP), and E&P (XOP). Some interest rate sensitive (and dividend reliant) sectors will need more good news from Iran to break out of the inflation worry bucket. We see Consumer Staples (XLP), Utilities (XLU), and Real Estate (XLRE) in the bottom quartile despite the brief favorable move in rates.
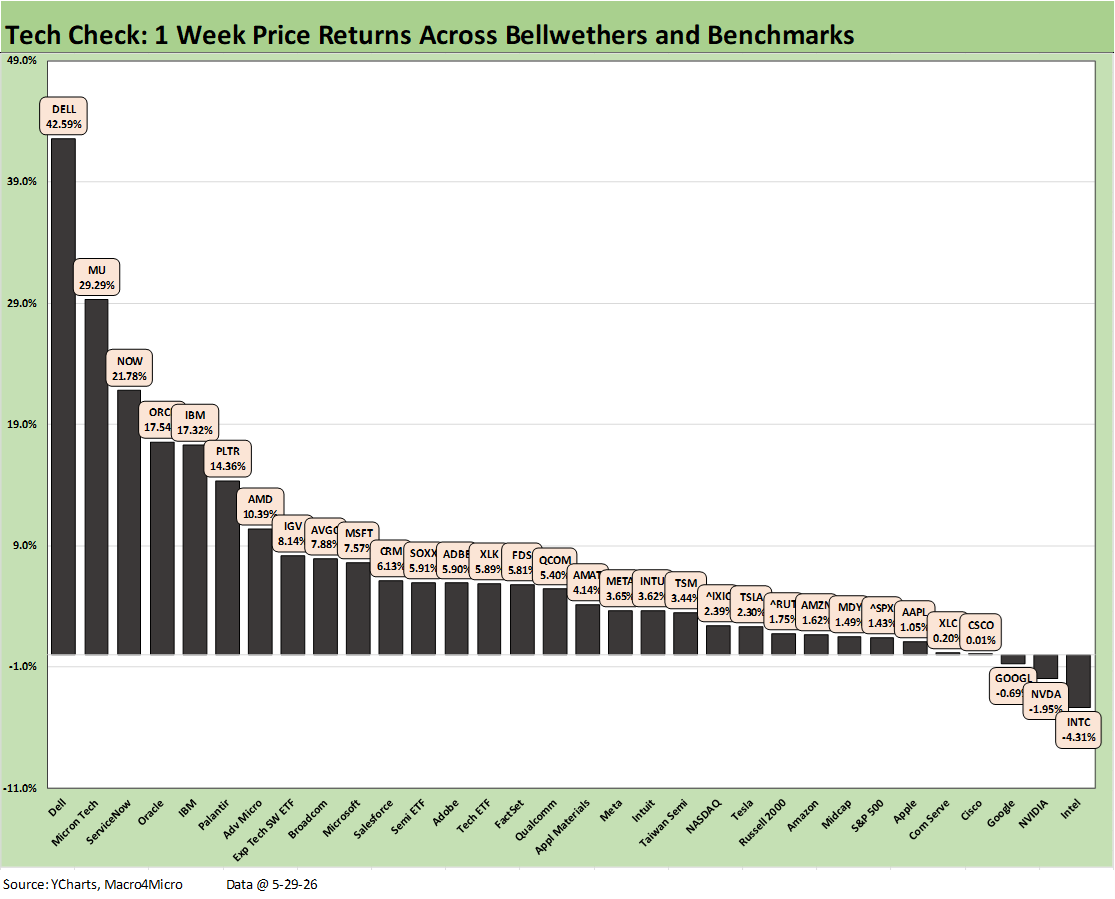
The following is an edited and updated cut-and-paste from our weekend LinkeIn post on the weekly asset returns:
The week brought another banner performance for the “Tech Check” list except this time the software and SaaS-based service names stepped up the comeback pace. We see a score of 29-3. We note that the score was 28-4 before we dropped Zillow from the mix and added Dell to the group. Dell burst back into the headlines with a daily price move on Friday of 32.8% for +42.6% on the week and a 104.7% month.
We dropped Zillow from the mix to make room for Dell in our group of 32. Zillow just does not seem like it is going to be as interesting as Dell for a while (then again, in tech you never know). At least we have plenty of other SaaS-based services examples. Zillow put up a -3.7% return for the past week and is cruising along at an ugly -48.7% YTD. We will drop that one for now from the collection among the services companies that have been tagged as AI displacement risks.
Besides Dell, a big story for the week was the material rebound in some SaaS names led by ServiceNow (NOW), who placed #3 at +21.8%. Software also played catchup. The top tier saw IBM have another good week at #5, Palantir (PLTR) at #6, and Software ETF (IGV) at #8.
IBM, which is more of a multiline hybrid tech legacy leader, posted +17.3% for the week at #5 but only just broke back into YTD positive return range at +0.54%. PLTR remains negative YTD at -11.9% despite a +14.4% week. With a +8.1% week, IGV is still in the third quartile with a negative YTD price return of -3.8%. The bottom quartile YTD returns are still bracketed between Meta at -4.2% and last place Intuit (INTU) at -50.0%.
The top quartile in the Tech Check is heavily about semiconductors and the AI ecosystem effects with Micron (MU) at #2 after steamrolling the month of May at +87.3% with a weekly return of +29.3%. MU was #2 for the month behind Dell. Oracle (ORCL) weighed in at #4 for the week with +17.5% and placed #6 for the month of May with +37.8%.
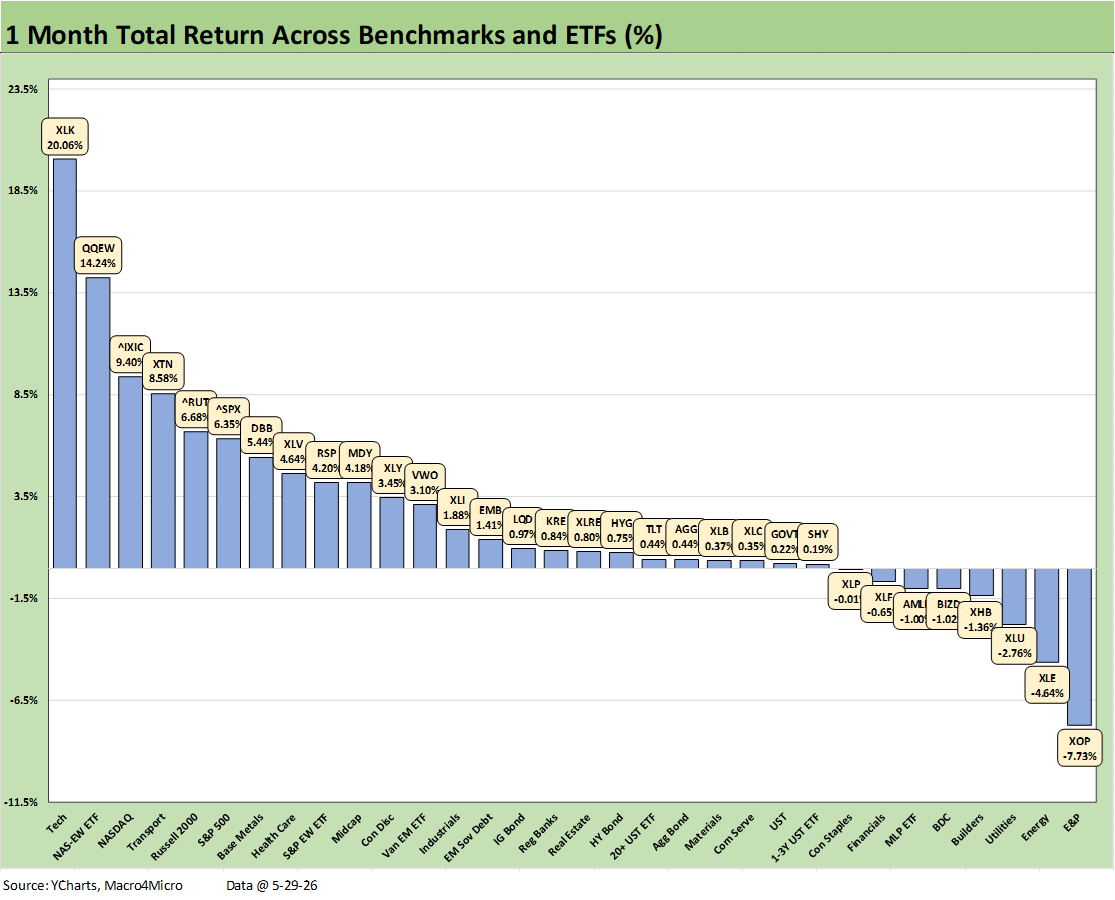
The 1-month score for the broader mix of 32 benchmarks and ETFs weighed in at 24-8 in a banner month for the broad benchmarks with the NASDAQ, S&P 500, and the small cap Russell 2000 in the top quartile. We see the Equal Weight S&P 500 (RSP) just below the top quartile with Midcaps (MDY).
We see the 3 energy ETFs (XOP, XLE, and AMLP) dropping into the bottom quartile for the 1-month number after a run into the top tier YTD where they remain as of this week. Interest rate sensitive sectors have had their share of headwinds even with the rally in the UST curve this past week with Homebuilding (XHB) in negative range and Financials (XLF) feeling the concerns over net interest margins and asset quality.
We see BDCs (BIZD) coming off a good recent week but still in the red for the month. The BDC journey this year has been an interesting one as the market had been framing rapid asset growth against some high-profile meltdowns and fraud. That was another excuse to look back to past periods of excess in “new” credit asset classes launched in past cycles whether it was HY excess in the late 1980s (notably 1987-1988), the tech borrowing boom of the late 1990s, or the structured credit lunacy of the 2004-2007 stretch.
Private loans are not a new asset class at all (I started my credit career in insurance private placements in the early 1980s). What is new is the nature of the origination wave and the scale of disintermediation. Risky credit already did that dance in the transition from the thrift crisis into CBOs and then into the CLOs of the 1990s before the onslaught of credit derivative structures and counterparty exposure in the new millennium.
The private credit story and “hyper-origination wave” to maximize fees and AUM is arguably more like the rise of the HY bond markets. That excess eventually highlighted the questionable secondary liquidity of the asset class as sharp repricing hit the headlines and refinancing alternatives dried up outside restructurings.
Life got spooky in 1990 when the securities shops faced hung bridge loans and Drexel filed Chapter 11. As we highlight in the 3-month return chart below, BIZD climbed back into the middle of the second quartile. The private credit asset class saw more earnings reports and more extensive originator and manager commentary coming into the market. It also helps when newer or more aggressive lenders back off from the “anything with a pulse” mentality of lending.
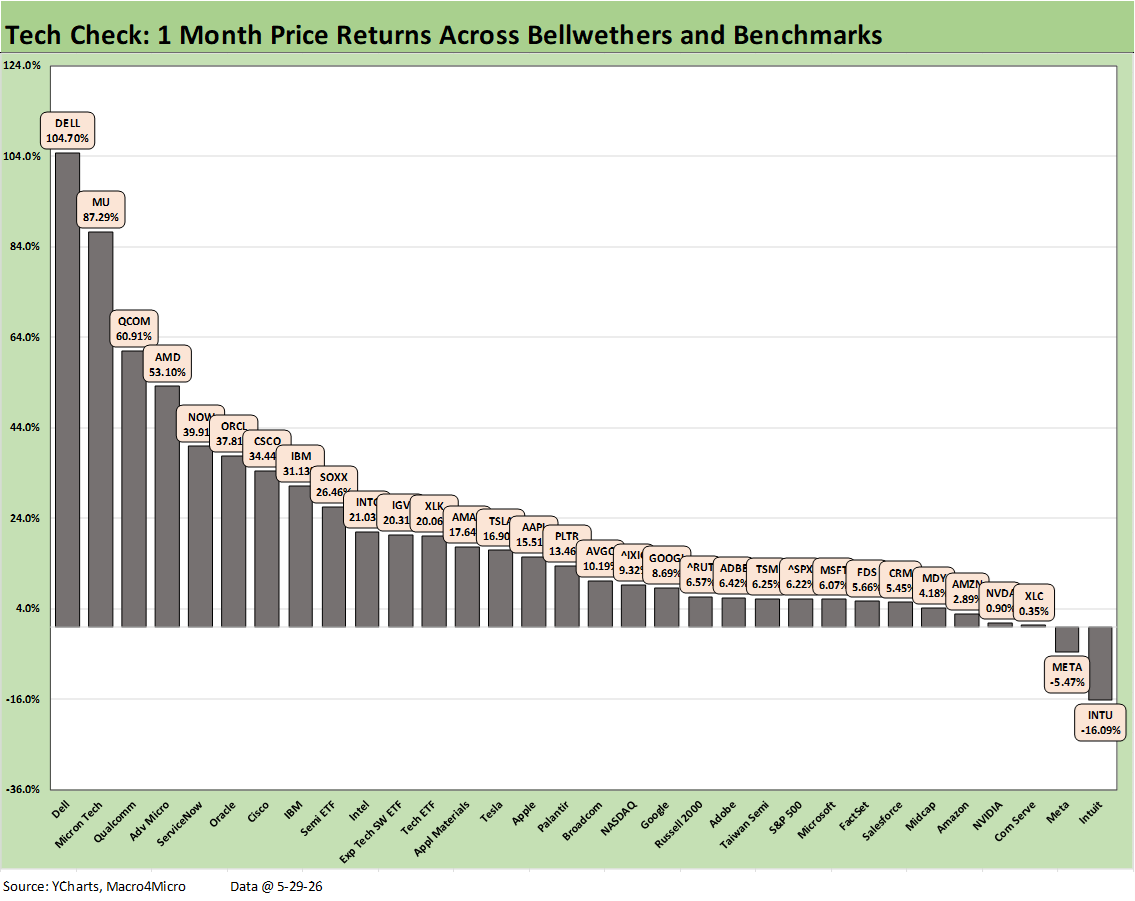
As the 1-month Tech Check timeline shows, May was a spectacular month for tech with all the “best since” and “best ever” accolades seen in the headlines. It took 31% to make the top quartile that was led by Dell at +104.7% and bracketed on the low end by IBM at over 31% in the #8 position. The score of 30-2 shows Intuit still in the red with Meta also in negative range.
The median across the 32 was just under 12% (for 1 month!). We see 3 Mag 7 names in the bottom quartile (META, NVDA, AMZN), 2 Mag 7’s in the third quartile (MSFT, GOOGL) and 2 more in the lower end of the second quartile (AAPL, TSLA). The semiconductor-heavy rankings and the AI capex boom themes include an array of other tech products and services offerings as driven home by Dell this past week. We see the Software ETF (IGV) closing the gap with the Semiconductor ETF (SOXX).
For the month, we see the software and SaaS names making a comeback with ServiceNow (NOW) at +39.9% and the Software ETF (IGV) at +20.3%. Oracle is in IGV and weighed in with +37.8%.
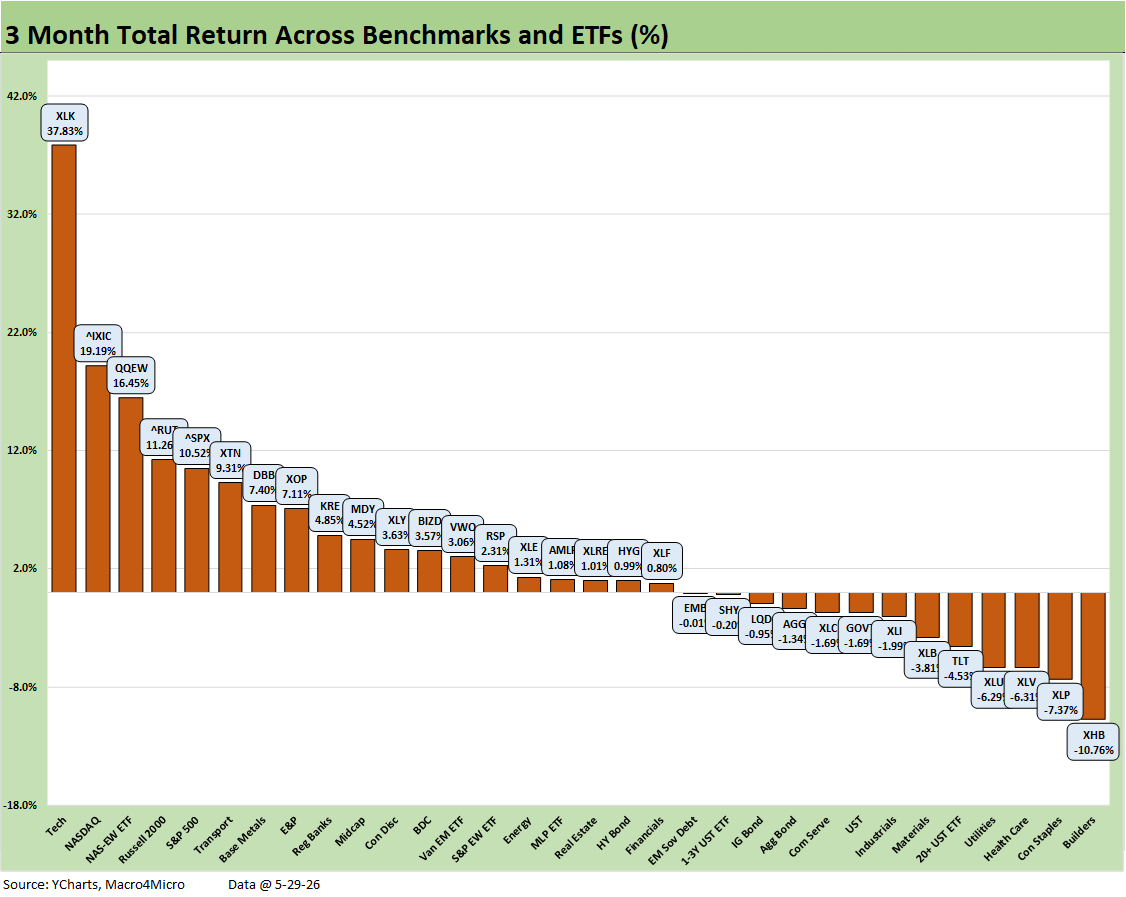
The 3-month timeline is like a post-Iran horizon that includes a mix of consumer and cyclical anxiety, an oil price spike and partial retrenchment in energy, and a strong run by other commodities as Base Metals (DBB) rose in the face of Gulf disruptions.
The score of 19-13 shows the period was no picnic with 6 of 7 bond ETFs in the red and the HY ETF (HYG) just under 1% with resilient spreads and decent coupons mitigating the more limited duration damage. HY was still just under 1% for the period.
We see the Tech ETF (XLK) almost 2x NASDAQ returns (the #2 line) followed by the Equal Weight NASDAQ 100 ETF (QQEW). The small cap Russell 2000 and tech heavy S&P 500 round out the top 5. It only took 7.1% to make the top quartile while it took over 13.3% to make the top quartile YTD.
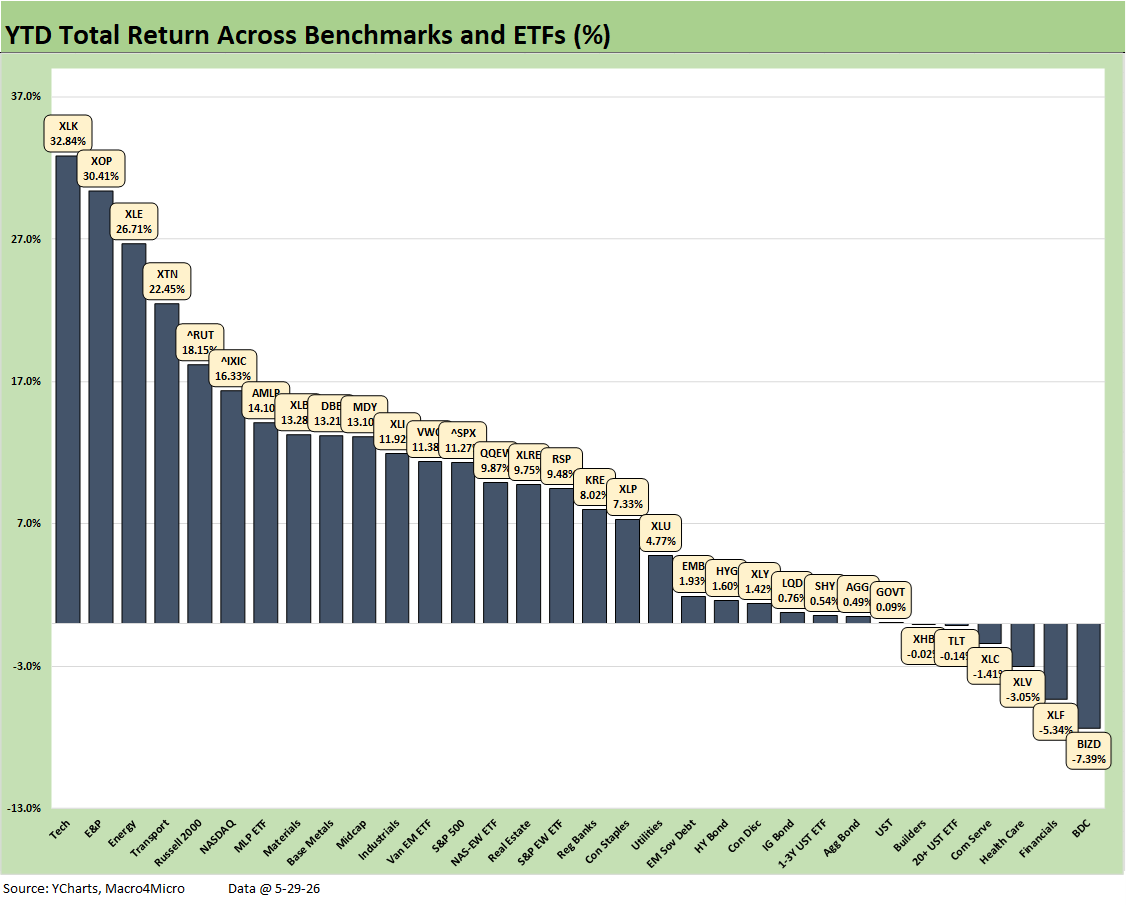
The YTD numbers show a strong market that ran alongside the tech boom and good corporate sector earnings. The consumer sector’s resilience is a reminder that it takes a lot to make PCE contract (as in almost never does but it can slow down). GDP has been held up by the fixed investment while Personal Consumption Expenditures (PCE) at 68% of GDP have been weak in context but at least growing.
A secular shift such as the AI capex boom can make a big difference in multiplier effects. The same is true for easy credit markets. The test will be whether credit risk and equity valuation end up as “too much too soon.” Iran has to get put to bed. The other big topic is that AI multiplier effects already has cost a lot of jobs in tech and could cost a lot more from here and extend somewhat more brutally to service jobs in what is a “service economy.”
For fixed income, we see only 1 bond ETF in the red with the rest posting minimal returns with only two over 1% (EMB and HYG). The long duration UST ETF (TLT) was the only bond ETF in the red YTD. Iran’s side effects could jeopardize some of the good news in the consumer sector on household budgets. For interest rate sensitive sectors, the Iran risk is high. The worry is that Iran is not dealt with more intelligently than it has been to date (a very low bar).
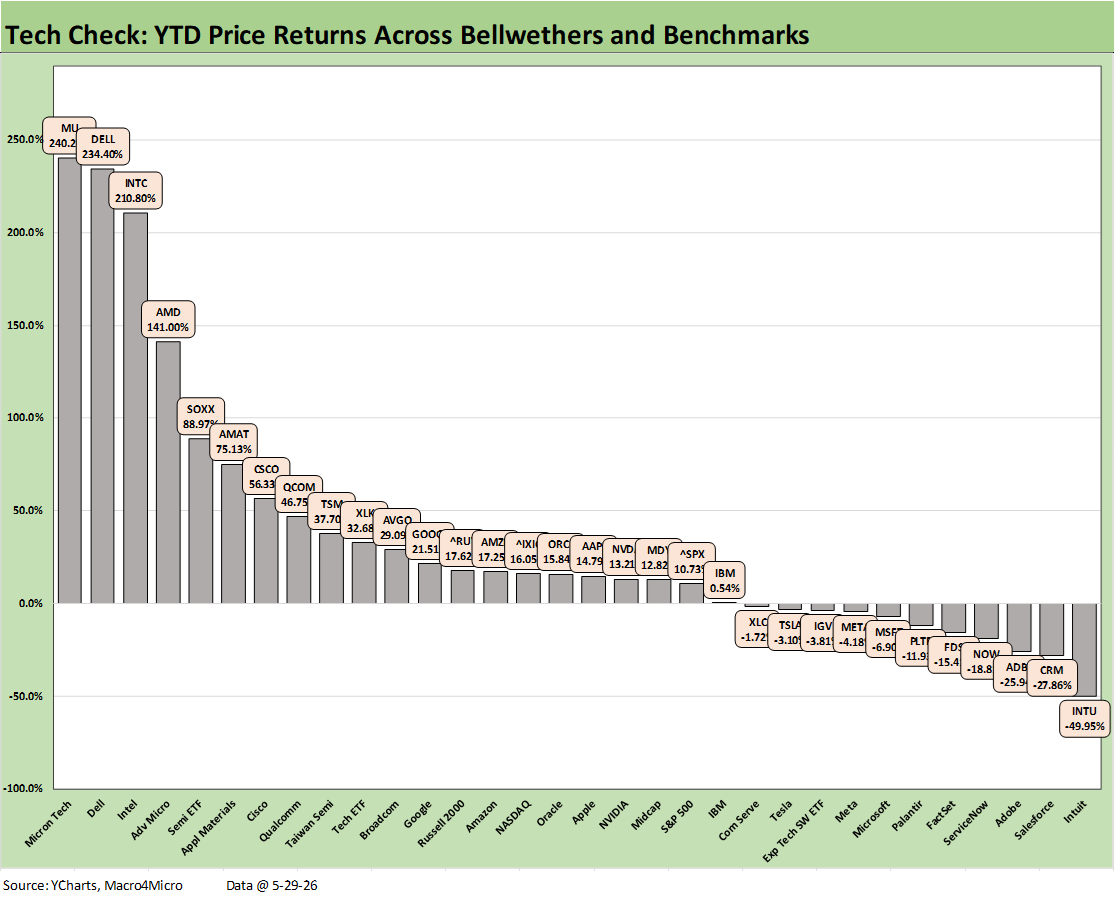
The Tech Check YTD is impressive for the big winner returns but perhaps less so than one might guess at 21-11. The struggles of software and SaaS services names underscore that radical change brings its share of risks, costs, and victims (corporate and human).
It took a spectacular 46.8% (QCOM) for around 5 months to make the top quartile. The median for the 32 lines has a 15% return handle, and that already is 50% ahead of the long-term annual returns of the equity asset class in a single year.
The cluster of negative returns in the bottom tier includes 6 lines in double-digit negative returns, and that is after the recent rally. Intuit at -50.0% (-49.95%), Salesforce at -27.9%, and Adobe at -25.9% are sobering for owners of assets in these highly successful, branded tech service businesses.
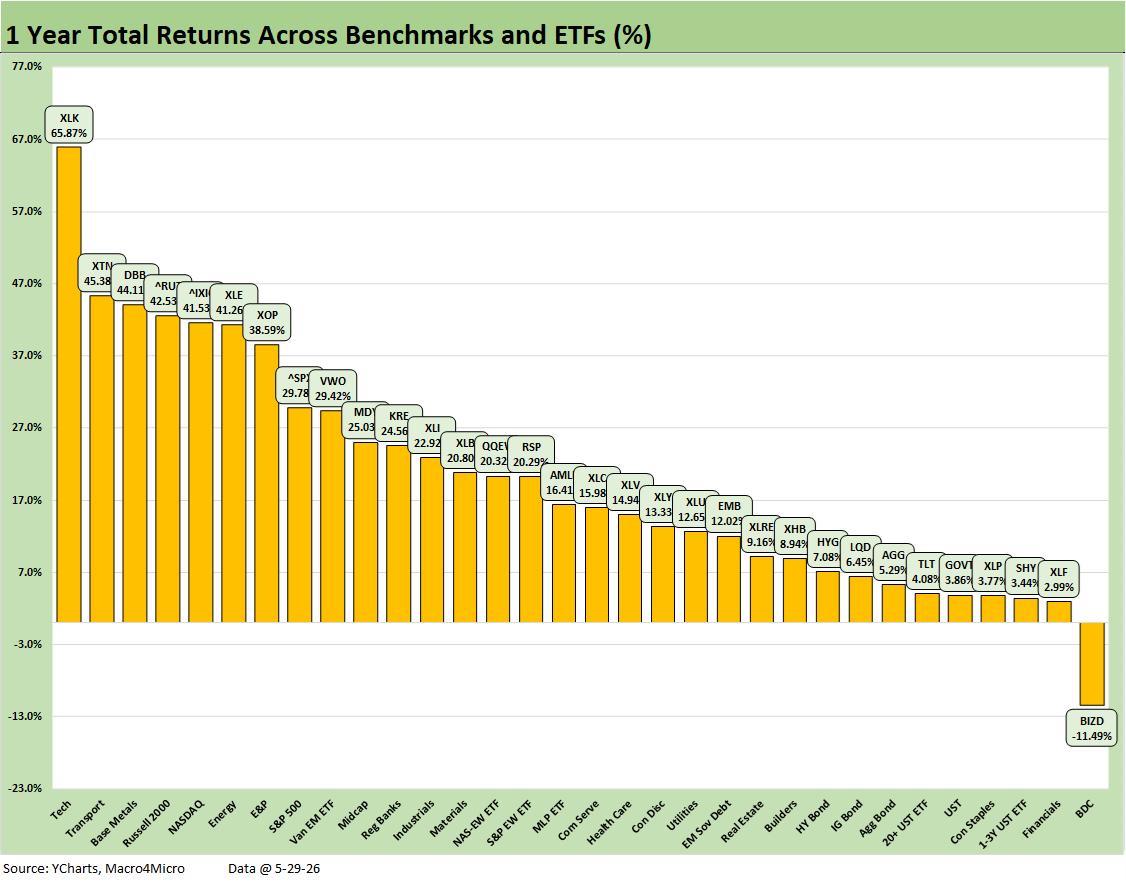
The 1-year returns show a score of 31-1 with only BDCs (BIZD) in the red. All the bond ETFs are positive, but we see Financials (XLF) and dividend-centric Consumer Staples (XLP) in the bottom quartile on the uncertain curve outlook among other reasons (cyclical worry, bottom half of the “K” craters, mixed payroll trends).
For the overall return profiles, the returns are very strong. It took +29.8% to make the top quartile and the median across the 32 is a 16% handle for the LTM period. For the full period, we see impressive breadth and diversity of returns at the 20% line or above. That said, the latest trends have highlighted the absence of breadth as a recurring theme.
For the LTM period, we see sectors such as Industrials (XLI) and Materials (XLB) above the 20% line. Midcaps (MDY) with 20% handles and small caps (RUT) with 40% handles tell a very good story for corporate performance. Even Transports (XTN) at #2 with 45% returns has been reassuring and the same for the Base Metals (DBB), who were riding solid demand but also the distortions of the Gulf.
Where we go from here will turn very heavily on Trump’s Iran moonwalk, the potential for a major clash in trade on the USMCA review, and fallout from the dramatic erosion of relations with Europe.
See also:
New Home Sales April 2026: Slow Start to Spring 5-28-26
PCE Inflation: Income and Outlays April 2026 5-28-26
GDP 1Q26 Second Estimate: Shrunk in the Dryer 5-28-26
Market Commentary: Asset Returns 5-26-26
Retail Equity Comps: Looking for Signals 5-26-26
Housing Starts April 2026: Soft Starts in Single Family 5-22-26
D.R. Horton: Financial Powerhouse Despite Cyclical Softening 5-20-26
Taiwan: Stakes are High, US Awareness is Low 5-17-26
Industrial Production April 2026: Bringing a Lift 5-15-26
Existing Home Sales April 2026: Steady or Clinging? 5-14-26
Producer Price Index April 2026: Heat Rising on Cost Inputs 5-13-26
CPI April 2026: 4.1% All Items Less Shelter, 30Y UST 5% 5-12-26
Employment Situation: April 2026 5-8-26
JOLTS March 2026: Openings Down, Hires Up, Layoffs/Discharges Up 5-5-26
Synchrony Financial: Favorable Consumer Credit Signals 4-24-26
The US as an Aspiring Emerging Market: Fiscal SNAFU, Political FUBAR 4-6-26
Market Lookback: Confusion Reigns, Dislocation Pours 3-22-26
Market Lookback: The Gulf of Cause and Effect 3-15-26