
Existing Home Sales Dec 2023: Rerun of Multi-Decade Low
We look at a bad end to a bad year in existing home sales.


The story line on existing home sales just ran through its second coat of watching paint dry with low inventory and low sales run rates as golden handcuffs and unfavorable affordability drive the story line.
Median prices are up again YoY but sliding sequentially with the share of first time buyers still below the norm.
The Dec 2023 NAR release brings the month’s SAAR rates plus some full year 2023 annual numbers for consideration.
The 4.09 mn units for the year on an annual basis was almost a 30-year low but still saw Dec 2023 limp to the exit with 3.78 million units to end a bad year badly.
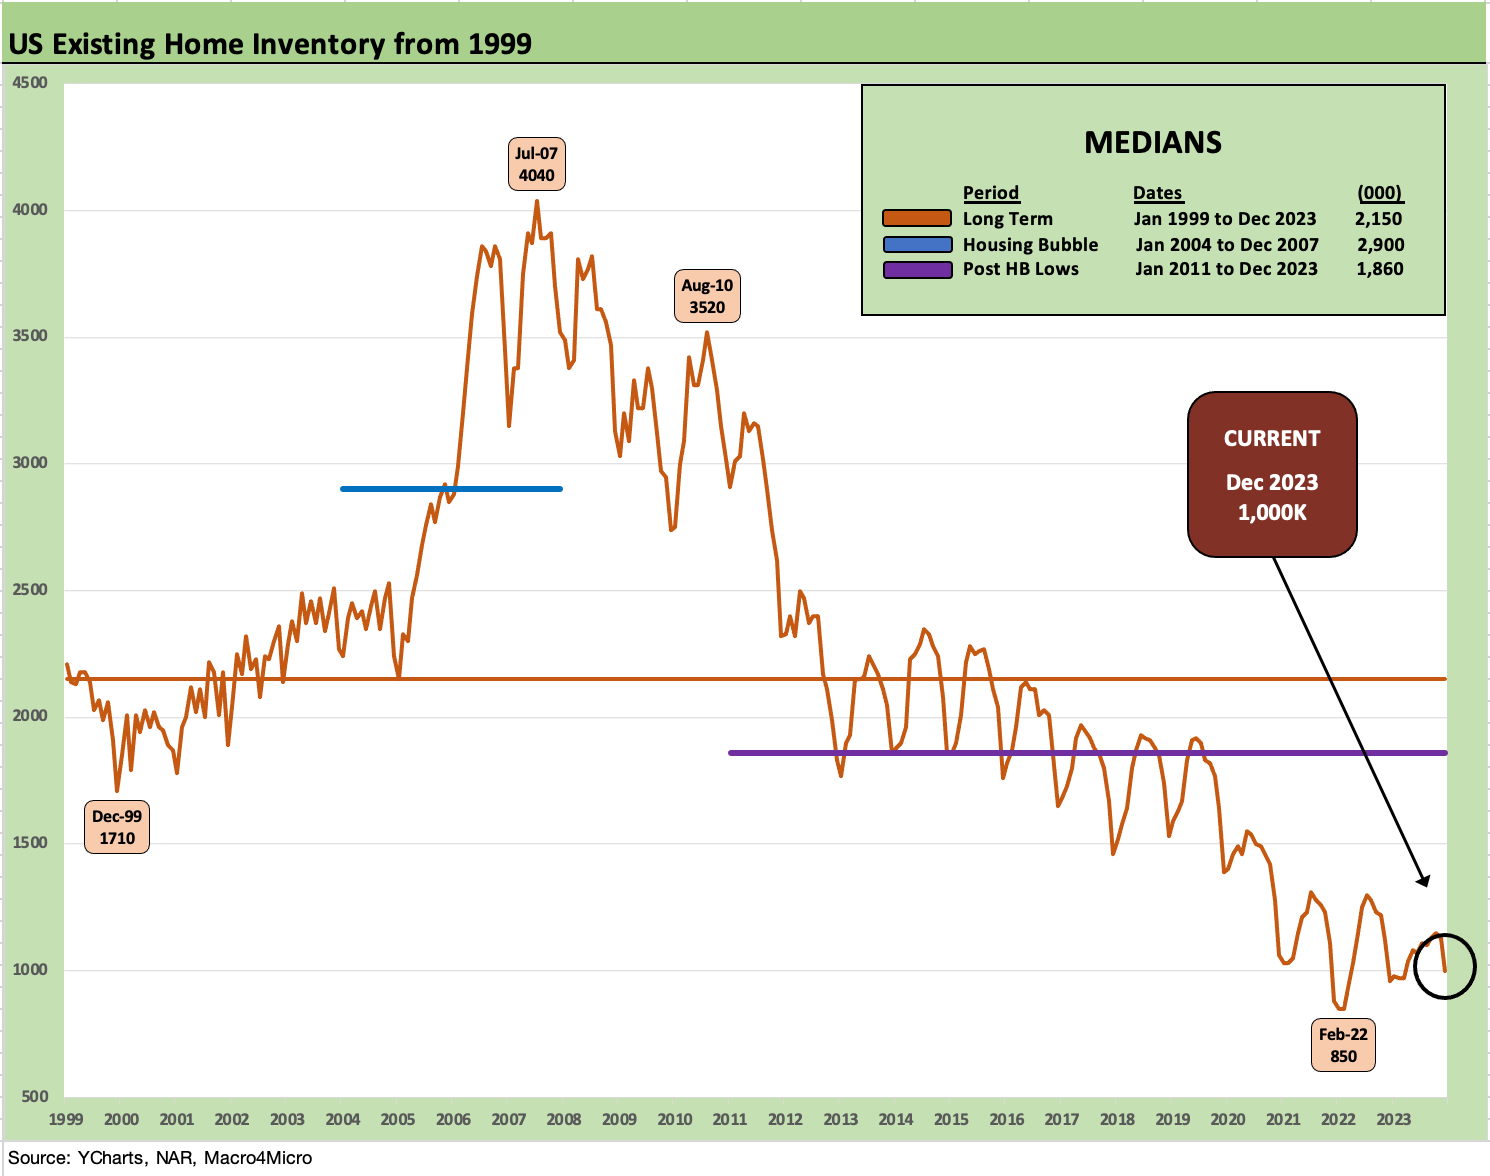
The tight inventory keeps the beat going in a market where homebuilders have carried the day across 2023. Inventory was down -11.5% and continued offering builders a rare opportunity to substantially grow their share of the total home sales markets.
The backdrop is more or less a steady state across recent months (see Nov 2023 Existing Home Sales: Avoids New Lows 12-20-23) as supply-demand imbalances keep home equity healthy but incremental sales volumes facing the natural headwinds of mortgage rate shock and monthly payment pain for both the buyer and the seller.
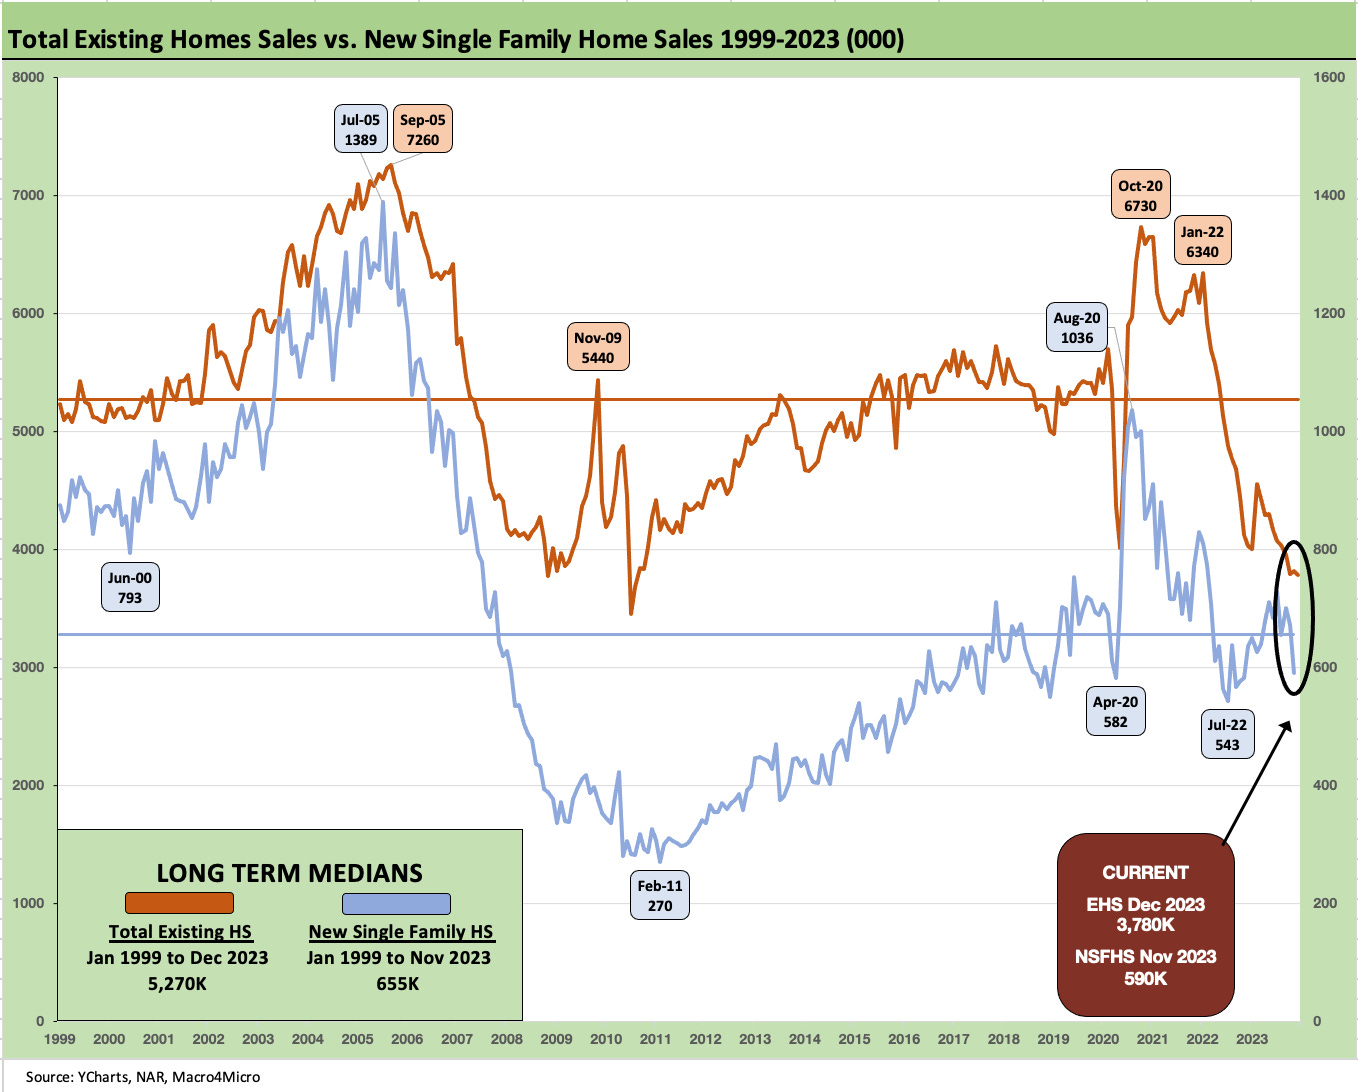
The long-term timeline from 1999 above really hammers home the theme of weak volumes with a long term median of 5.27 mn existing home sales vs. the tragically low 4.09 million for the year 2023 and a SAAR rate for Dec 2023 of 3.78 million. The sales rate for Dec 2023 was down -6.2% YoY while the median sales price rose by +4.4% to $382.6.
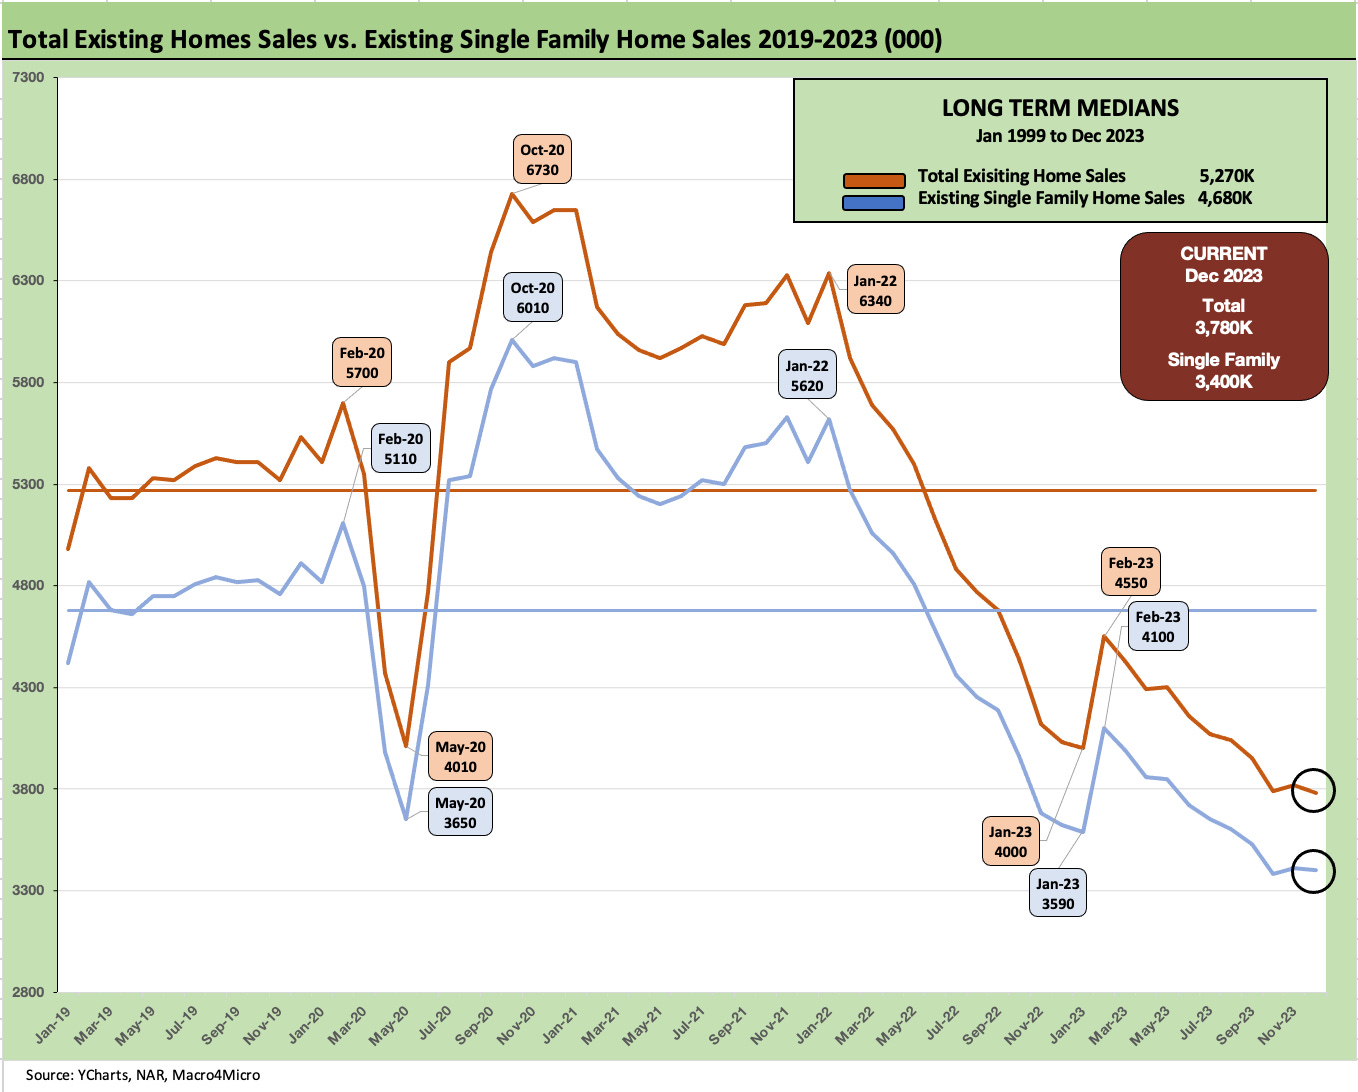
The above chart frames the time series for total existing home sales (including single family, townhouses, condos, and co-ops) vs. just the existing single family category of homes. The two lines offer some nuance on the same broad trend – as in low supply and low activity in historical context.
For Condos and Co-op data, volumes are well below the 2021 peak run rate volumes of 707K for that year. During Dec 2023, single family was down -0.3% sequentially but down -6.1% YoY. Condos and Co-ops were down -7.3% sequentially and down -7.3% YoY. Existing Condo and Co-op median prices stood at $343.8K for Dec 2023 or +8.2% YoY. Condo and Co-op prices range widely by region from $238K in the Midwest to $481K in the West with prices higher in all regions YoY.
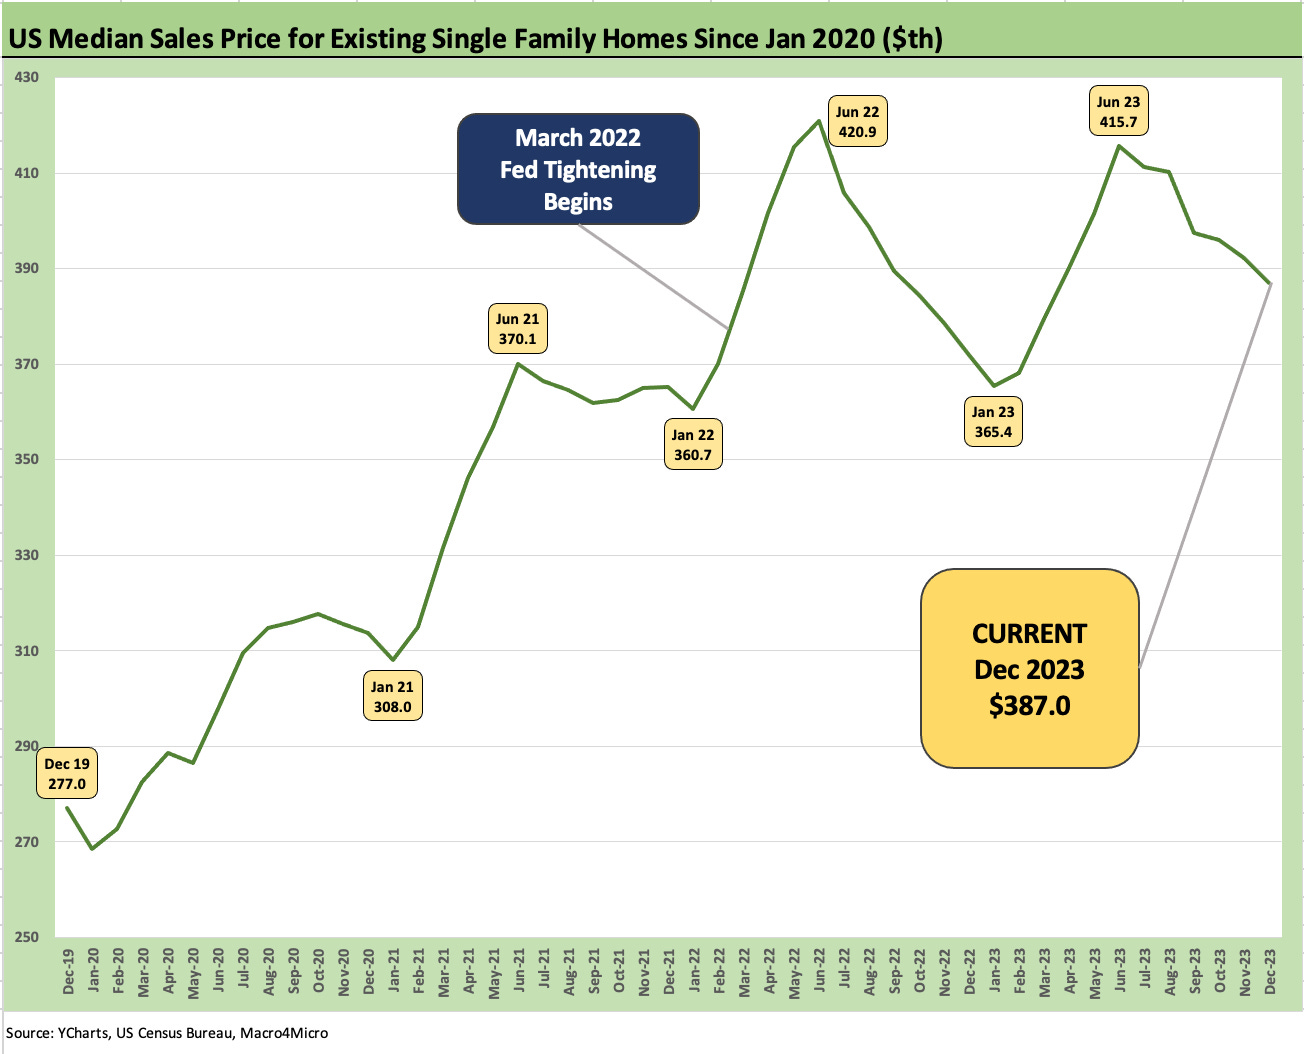
The above chart plots the time series for single family home prices since the end of 2019. Prices were higher YoY by +4.0% and higher in all four regions with the South at +3.5%, the West at +4.8%, the Midwest at +5.5%, and the Northeast at +9.5%.
Resilient home valuations for the majority of mortgage holders are a positive factor. According to Freddie Mac, 60% of mortgage holders sit below 4%. That is not a bad household balance sheet and fixed charge profile for homeowners. Those with mortgages will just strain to sell and refi.
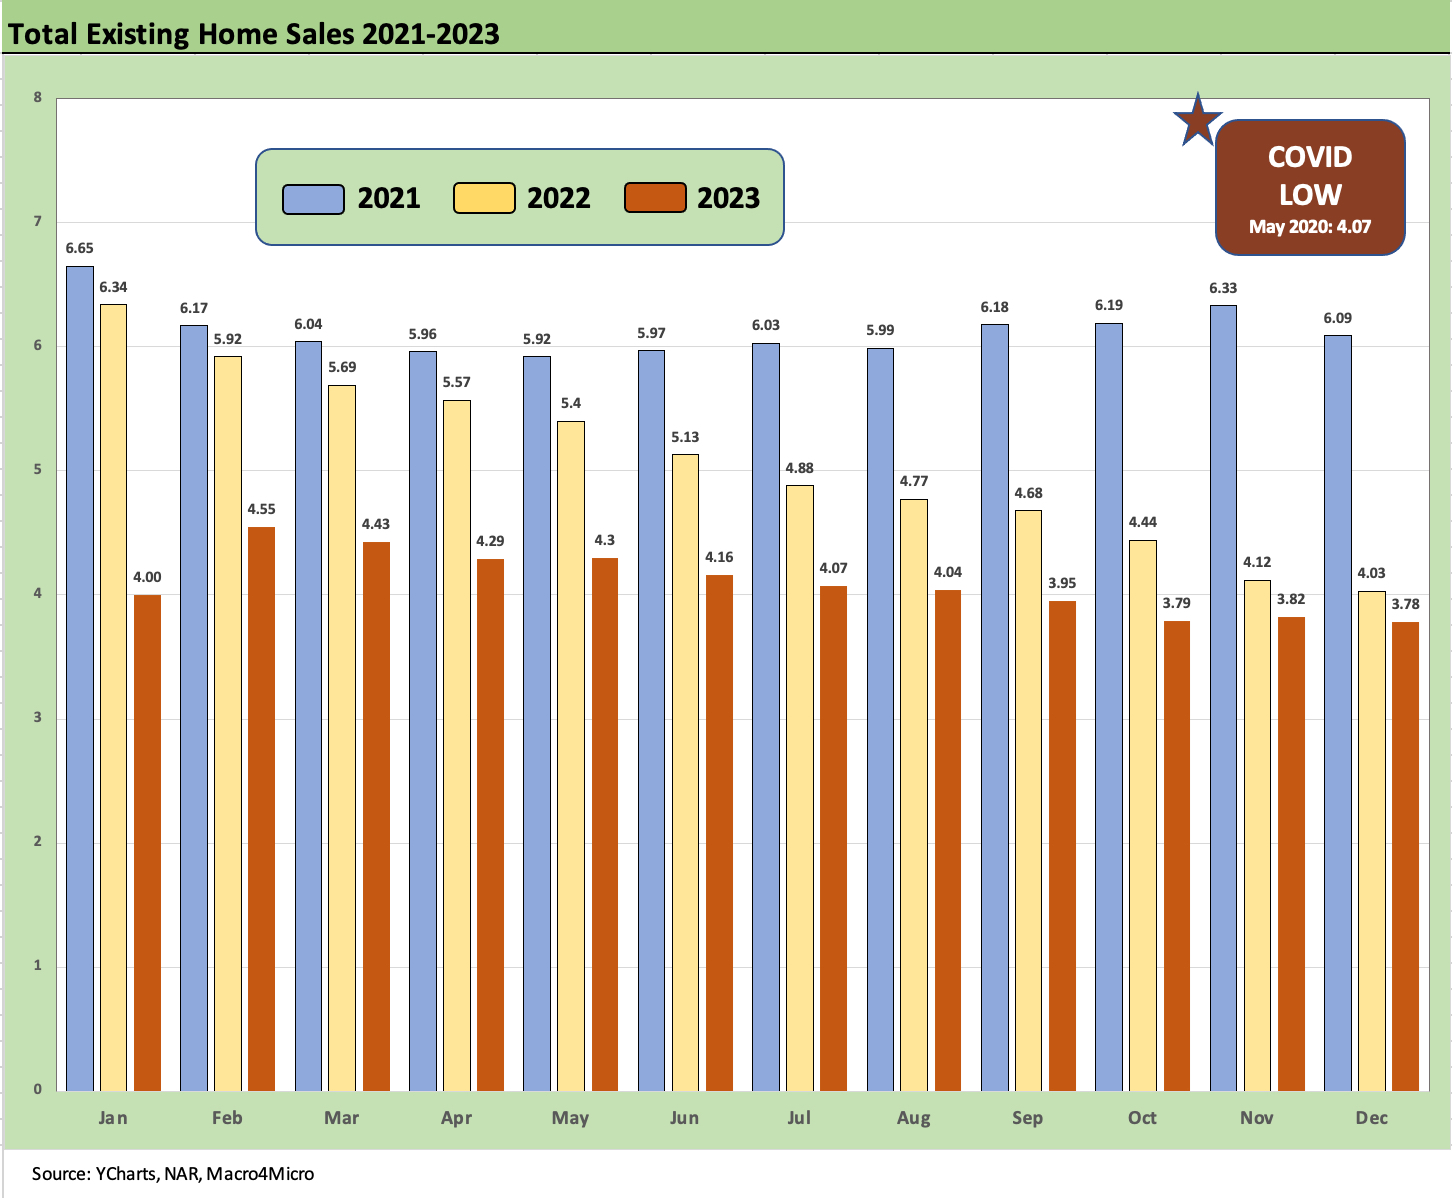
The above chart frames the trailing 3 years of sales volumes by month. We just hit another new sub-4 mn monthly SAAR low.
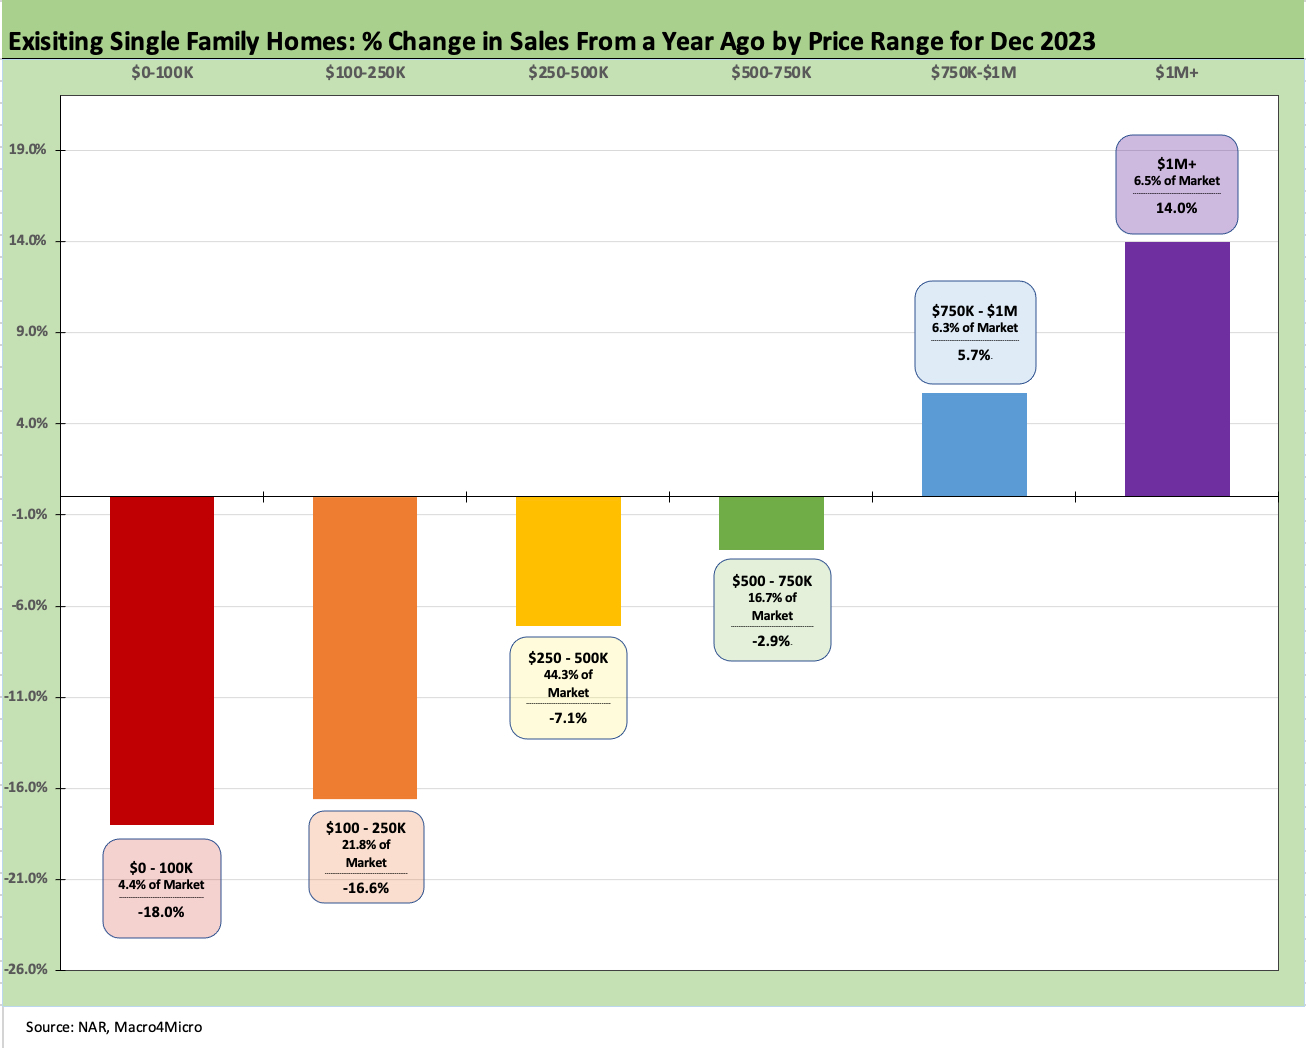
The above chart shows the sales deltas by price tier where we also note the share of the market held by that price tier. The high price tier is showing favorable variances with the sweet spot (44.3% of market) of $250K to $500K at -7.1%. The lower price tiers are seeing the largest YoY declines as mortgage rates undermine buyers and barriers to refinancing undermine sellers.
See also:
KB Home: Wraps Industry Rebound Year, Exiting on Upswing 1-14-24
Nov 2023 New Homes Sales: Feeling the Volume Fade 12-22-23
Nov 2023 Existing Home Sales: Avoids New Lows 12-20-23
Housing Starts Nov 2023: Foot by Foot, Row by Row 12-19-23
Lennar 4Q23:Buyer Buzz, Curve Support 12-15-23
Credit Crib Note: Lennar (LEN) 11-22-23
Pulte: Relative Value Meets “Old School” Coupons 11-15-23
Credit Crib Note: PulteGroup (PHM) 11-15-23
Anywhere and Real Estate Brokerage: Judgement Day 11-2-23
Credit Crib Notes: Toll Brothers (TOL) 9-11-23
KB Home: Credit Profile 6-24-23
D.R. Horton: Credit Profile 4-4-23