
Market Commentary: Asset Returns 6-21-26
The past week saw the Iran deal dominate, the FOMC surprise, and the Italians rage as the USMCA awaits the next round of tension.

So many people to insult, so little time.
The asset return story for the past week saw the initial news of a “final” Iran deal outweigh the very hawkish FOMC meeting that roiled the UST markets. As we roll into the last days of 2Q26, the Iran backdrop is getting ugly again with confusion and potential flareups leading to a wider range of potential outcomes than initially envisioned.
Among “relationship problems,” we can add concerns around France and the role that its UN seat can play in sanctions. France has expectations around such issues as missiles, which had been left out of the MOU (see France Delivers a Second Devastating Checkmate to Trump 6-20-26 on Substack). That France news got little play in the US, but the topic has been covered broadly in France and Israel. Meanwhile, Trump plays “The G7 insult game, collect all 6” with Meloni the target the past week.
This week brings a fresh round of PCE inflation metrics with the “Income and Outlays” report along with the final GDP data for 1Q26 GDP with its current weak +1.6% headline GDP numbers and +1.4% for PCE growth (see GDP 1Q26 Second Estimate: Shrunk in the Dryer 5-28-26). The market will also get a critical earnings report from Micron, which YTD has been the best performer on our Tech Check list as detailed below.
As we go to print, the FOMC odds remain bearish as covered in the FOMC SEP report (see The FOMC Dance: Will Warsh and Trump Find a Rhythm? 6-17-26). The Vegas line over at CME FedWatch on Sunday night post odds of 1 cut at 0% by the Dec 2026 FOMC meeting. We see the odds of no change at 10.1%, 1 hike at 32.8%, 2 hikes at 36.9%, 3 hikes at 17.4%, and 4 hikes (+100 bps) at +2.9%. That marks an especially grim direction for the target rate probabilities since Iran started.
With oil down below a $76 handle to end the week (under $85 the prior Friday) after a growing confidence that Trump would simply declare victory, the Trump self-control factor soon moved back down to lower expectations. The MOU process is again taking some blows. Trump threatening Iran while the negotiation was getting underway was a creative game theory move when Iran is clearly not cowed.
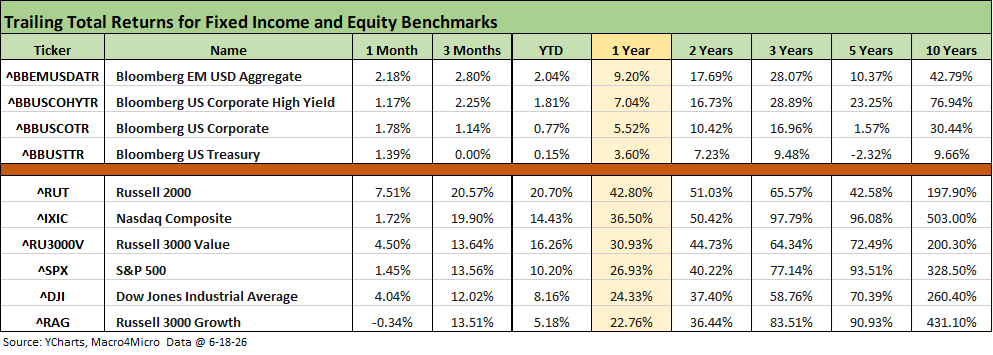
The above table updates the timeline returns for the broad debt and equity benchmarks we monitor. The debt indexes are all back in positive range for the 1-month time horizon, but the post-Iran curve action has left the UST index at zero for 3 months. The 1-year time horizon for equity returns makes a statement with results at a multiple of the long-term returns on the equity asset class.
Equities have clearly been strong, but the Russel 3000 growth benchmark had a rough month with a lot of software and SaaS names taking body blows as we have covered along the way. We break out the very divided tech return subsector performance in charts below.
From NASDAQ to Russell 2000, the double-digit returns have faced pockets of headwinds at the headline level with Iran and inflation. The concentrated tech leadership and weaker breadth come up in second-guessing staying power if the UST curve struggles. There is a lot riding on getting this MOU wrapped.
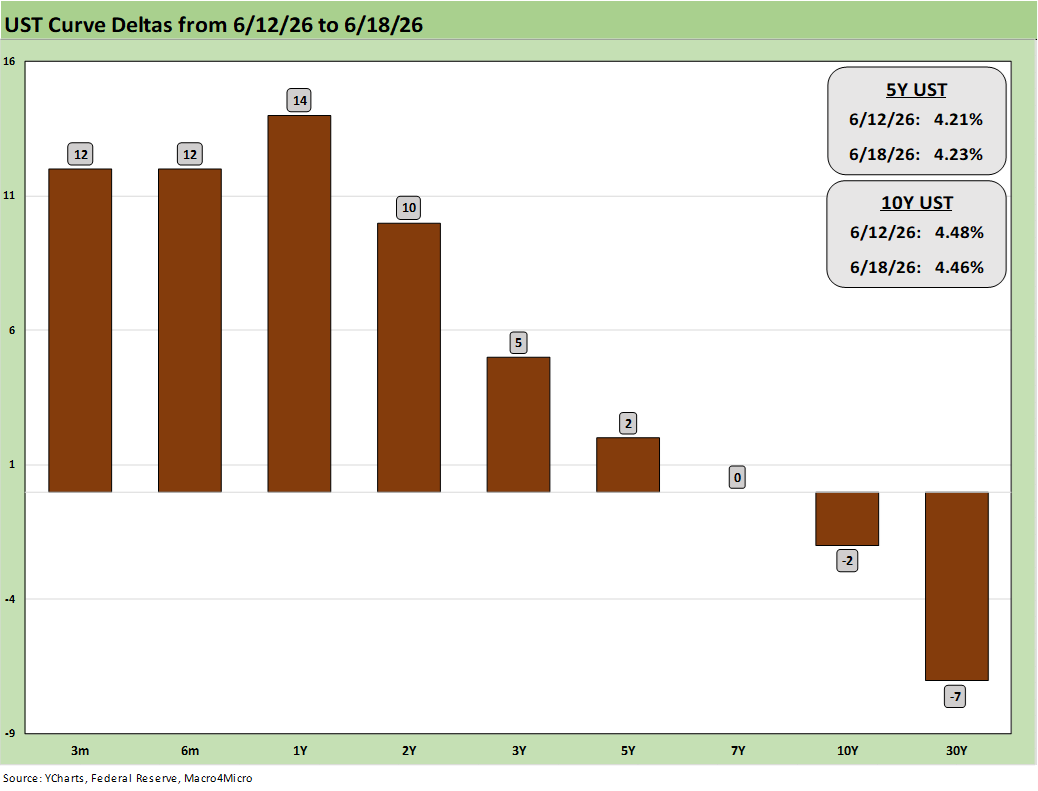
The 1-week UST deltas are posted above, and we clearly see the bear flattener coming out of the FOMC meeting and bearish fed funds expectations. The critical turning point would be the Iran MOU outcome since the bond market will hate any potential for protracted upward oil price pressure. That in turn could still flow into fed policy and the risk of inflationary trends pressuring consumers. If oil heads higher again, risk still lurks for long-dated UST rates hitting the housing sector even harder and undermining growth stock “valuation math.”
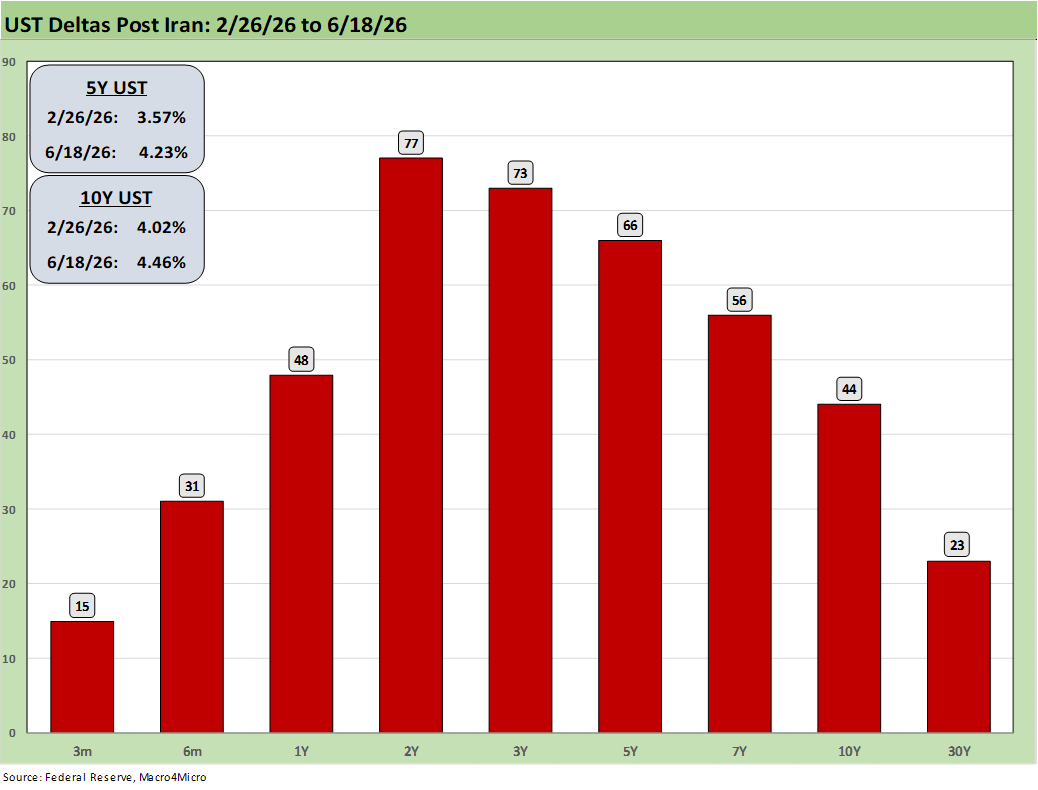
The above chart updates the post-Iran UST deltas using 2-26-26 as a starting point (the bombing started Feb 28). The 2Y and 10Y UST frame a bear steepener with 2Y UST at +77 bps, 10Y at +44 bps, and 30Y +23 bps.
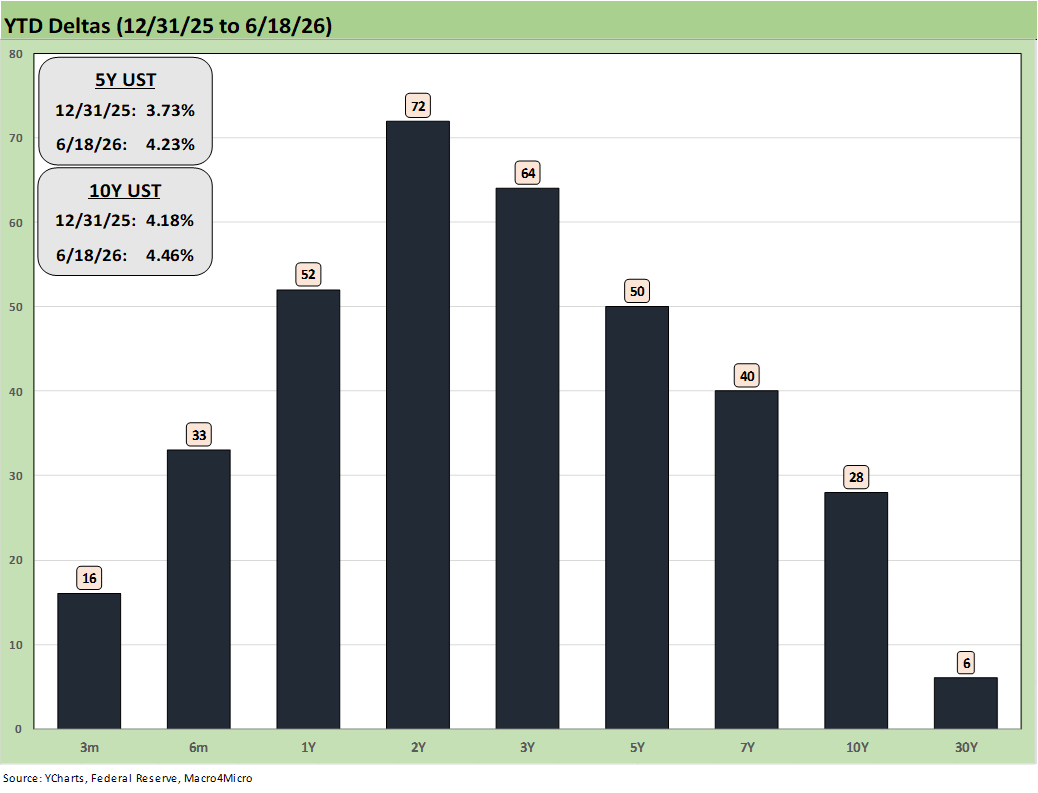
The above chart updates the YTD UST deltas with the 10Y and 30Y taking less heat than the short end. The bond ETFs have been able to remain in low positive return range with the credit markets riding coupons and tight spreads. There has been a smaller impact of late on long duration assets than we were seeing along the way. The oil markets could change that muted duration hit if Iran cannot get settled constructively.
The Magnificent 7 heavy ETFs…
Some of the benchmarks and industry ETFs we include have issuer concentration elements that leave them wagged by a few names. When looking across some of the bellwether industry and subsector ETFs in the rankings, it is good to keep in mind which narrow ETFs (vs. broad market benchmarks) get wagged more by the “Magnificent 7” including Consumer Discretionary (XLY) with Amazon and Tesla, Tech (XLK) with Microsoft, Apple, and NVIDIA, and Communications Services (XLC) with Alphabet and Meta.
The “Mag 7+3” have all been considered a key part of the tech drivers when Broadcom (AVGO), Oracle (ORCL) and Taiwan Semiconductor (TSM) are added to the mix. Those market cap rankings have been moving around across the months, and the growth in names such as Micron ($1.28 trillion market cap 6-18-26) may require some new grouping and tag lines as 2026 proceeds. Oracle is more a software and systems company that has been volatile and has fallen off the pace (ORCL is a holding in the Software ETF, IGV). Taiwan Semi has been consistent, and Broadcom is well entrenched in “the trillion plus club” at this point with a $1.96 trillion market cap this past week.
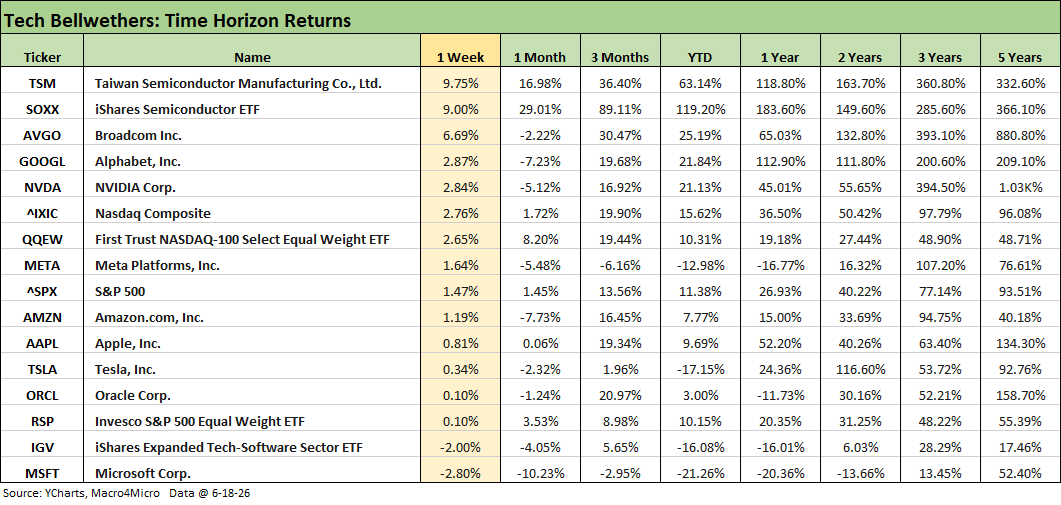
The tech bellwethers and benchmarks had a good week with semiconductors rolling along in a fresh rise as we cover in more detail in the tech check charts below. The only two asset lines in the red this week were Microsoft (MSFT) on the bottom with a -2.8% return and the Software ETF (IGV) slightly ahead of MSFT at -2.0%. The Semiconductor ETF (SOXX) posted +9.0% this week for a return differential of 11 points. We see Taiwan Semi (TSM) sitting on top with Broadcom (AVGO) at #3.
SOXX, with a total return of +89.1% for 3 months, makes a strong statement about what has been driving the NASDAQ and tech heavy S&P 500. SOXX returns at +119.2% YTD and +183.3% LTM are extraordinary. For the week, we see 5 of the Mag 7 lagging the NASDAQ and the Equal Weight NASDAQ 100 ETF (QQEW). We see 4 of the Mag 7 lagging the S&P 500 for the week.
The following is a cut and paste from our weekend LinkedIn post with some edits:
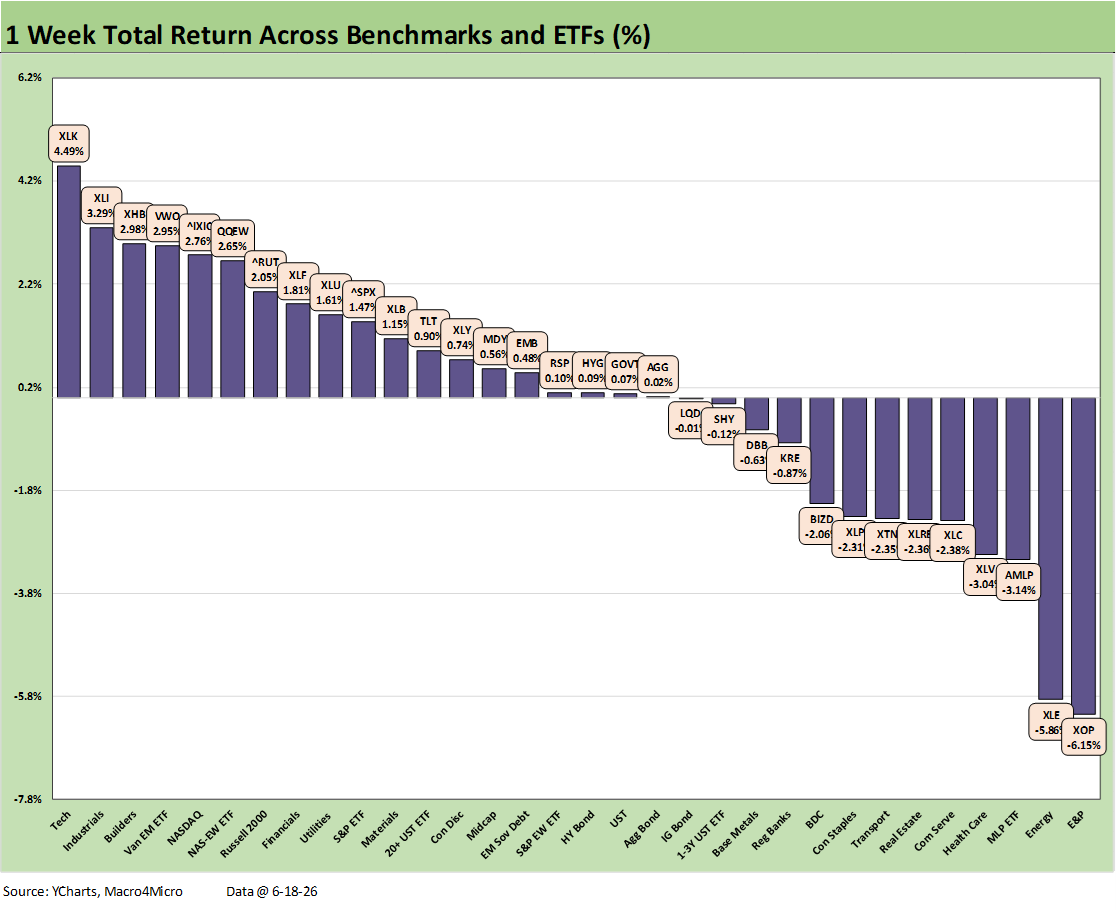
The chart details the trailing 1-week total returns (4-day trading week, but we use 5-day rolling) that weighed in at a positive-negative score of 19-13 in a holiday week that featured critical Iran developments and the first Warsh FOMC meeting that roiled the market with a hawkish tone. Sharply lower oil saw a Friday WTI close at $76.54 vs. $84.88 the prior Friday.
The bear flattener was caused by 9 of 18 voters (Warsh did not vote) seeing hikes. That included 3 seeing 1 hike, 5 seeing 2 hikes, and 1 voter seeing 3 hikes. For the week, the 2Y UST spiked by over +14 bps, the 10Y was -2 bps, and the 30Y down by -7 bps. That in turn drove the long duration UST ETF (TLT) into the 2nd quartile while the short duration UST 1-3Y ETF (SHY) edged into negative range. The good news in the markets was Iran and oil on the week managed to outdo the FOMC meeting.
Equities had a good week with NASDAQ and Russell 2000 in the top quartile while S&P 500 and Midcaps (MDY) were positive. The S&P 500 posted a score of 6-5 in its 11 sectors. Tech, Financials, Consumer Discretionary, and Industrials were among the major positive sectors this week and showed solid breadth and diversification after a period dominated by tech price action.
The chart shows the big winners and losers with the 3 energy ETFs (XOP, XLE, AMLP) in the bottom 3. XLK was on top with NASDAQ in the top 5 just ahead of the Equal Weight NASDAQ 100 (QQEW). The Homebuilder ETF (XHB) was in the top quartile on the longer dated UST curve rally even though the Mortgage News Daily 30Y mortgage rate did not move much yet with a late week close of 6.58%.
The Iran plot thickened as the market heard plenty of trash-talking of the Iran MOU and the considerable uncertainty that remains. As we go to print, the Strait was closed again based on Israeli attacks on Lebanon. Meanwhile, France has chimed in with its stance that its approval is needed on the removal of any UN Iran sanctions. Things are getting messy.
France has a range of views on what needs to be in the Iran deal for Trump et al to address (e.g. Iran missiles) and Ukraine support. There is room for the US-EU situation to get very ugly quickly when Trump is more dependent on EU support than he is willing to admit out loud or to himself. Congress has been left out, so we wonder how he will deal with the French. Hegseth was over in Europe this week telling NATO their performance was “shameful.” That won’t help.
The US-EU had had a bad week that could get worse, so Trump thought it was a good idea to insult the right-wing head of Italy (Meloni), who was (past tense) his only remaining EU fan with dictator wannabe Orban now residing in the ‘’Where are they now?” category. Trump took personal shots at a woman who at times seemed to be the only one in the G7 that could tolerate his behavior and bluster. That ship just sailed.
The following is a cut and paste from our weekend LinkedIn post with some edits:
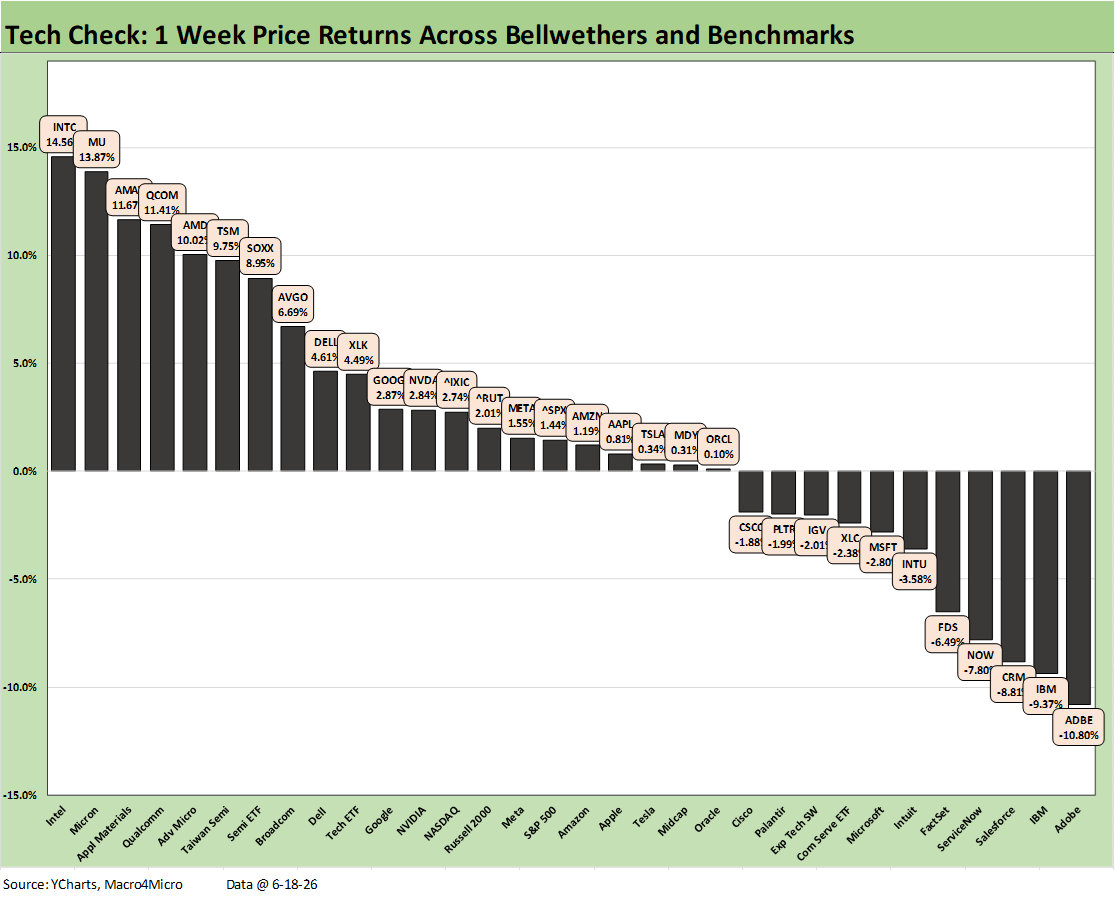
The weekly Tech Check posted a 21-11 as semiconductors generated another big week and took over the entire top quartile. Meanwhile, the theme for the week on the downside was a fresh beatdown of software and SaaS-based services players with Adobe (ADBE) sitting on the bottom at -10.8%. In the chart, we use a 5-day rolling return even though this week was a holiday-shortened 4 days with Juneteenth.
We see some of the usual suspects from the SaaS service subsector near the bottom such as Salesforce (CRM), ServiceNow (NOW), FactSet (FDS) and Intuit (INTU). The tech subsectors remain starkly divergent with the median for the tech check mix around 1% with a Hi-Lo range of 25.4% from #1 to #32.
The top 5 companies each posted double-digit returns for the week. That top quartile included the Semiconductor ETF (SOXX) at +8.95% vs. -2.0% for the Software ETF (IGV). We see Intel (INTC) at #1 with 14.6% just ahead of Micron (MU) at +13.9%, the capex-sensitive Applied Materials (AMET) at #3 and +11.7% followed by other leading semiconductor players comprising the remainder of the top tier.
The dispersion of returns follows a familiar pattern that we see in the YTD performance with “Semis on the left” and “Software on the right.” We break out the wider range of timeline returns for the tech mix in the full asset return commentary we will post tomorrow. Over that YTD horizon, we see the bottom 7 names all posting price returns of -21% or worse from Microsoft at -21.5% down to Intuit at -59.7%. That is an ugly profile for the software and SaaS-based service players. We see many of the same names among the worst performers above for the recent weekly numbers.
For industry and subsector asset allocators and old school stock pickers, the Hi-Lo ranges have been daunting. This week shows a Hi-Lo range of 25 points. The YTD Hi-Lo differential is 357 points from Micron to Intuit. Throw out the Hi and Low point, and Intel vs. Adobe still post a 307 point YTD differential.
For the week, none of the Mag 7 made the top quartile but only Microsoft was in the red in the bottom quartile. For the YTD period, we see 3 of the Mag 7 in negative return range with only 2 of the Mag 7 even making it into the bottom half of the second quartile (Alphabet and NVIDIA).
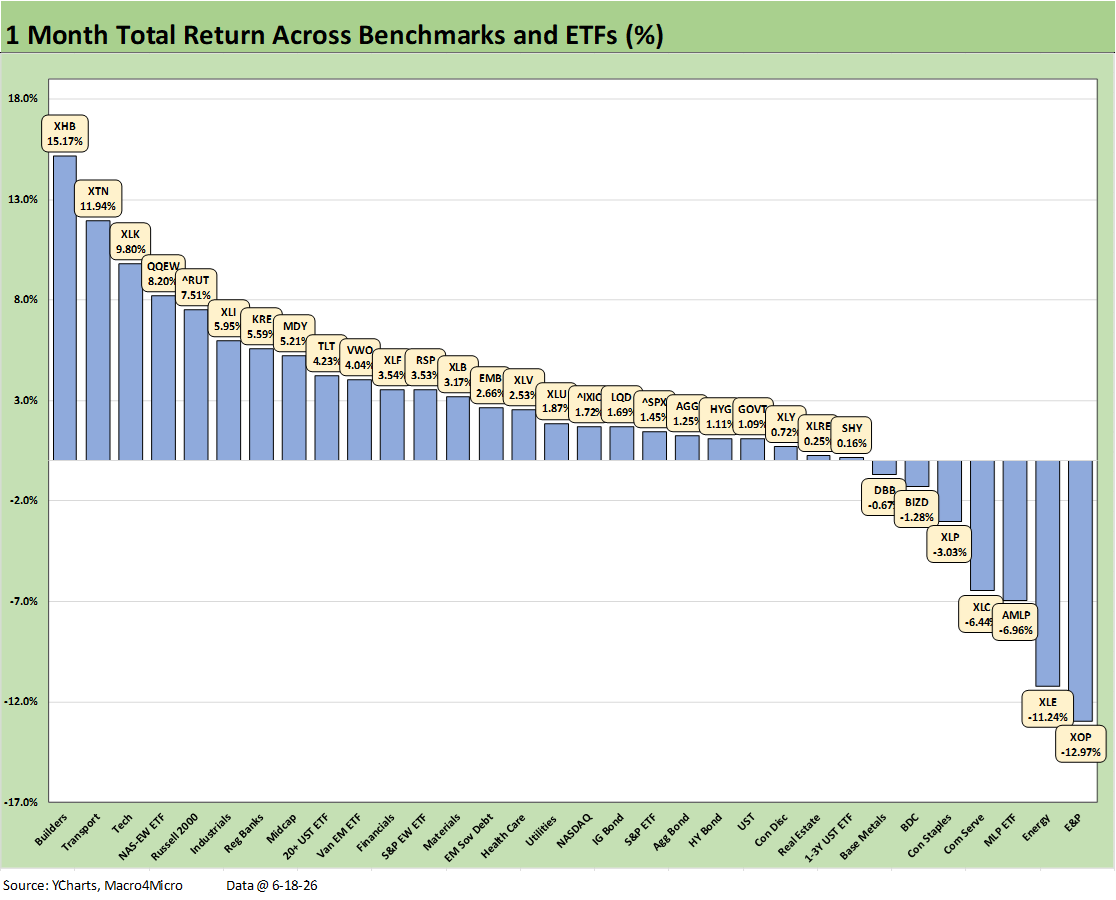
The 1-month returns across the broader group of 32 benchmarks and ETFs posted a score of 25-7 with a remarkably solid month in the face of uncertain outcomes for Iran and some ugly inflation data released in CPI and PPI (see Producer Price Index May 2026: Too Many “Since 2022” References 6-11-26, CPI May 2026: The 4% Rubicon 6-10-26, PCE Inflation: Income and Outlays April 2026 5-28-26).
The bottom 3 asset lines include the 3 main energy ETFs (XOP, XLE, AMLP). Those negative returns reflect less panic in oil and gas markets and “progress” (in relative terms) in Iran and the material pullback in oil prices to the $76 area from $96 handles back on May 23, 2026.
The winners include a diverse mix of tech asset lines (XLK, QQEW), cyclicals (e.g. Industrials ETF, XLI), some of the more sensitive subsectors to oil prices (Transports, XTN), and the interest rate sensitive with Homebuilders (XHB) seeing some relief on the long UST news.
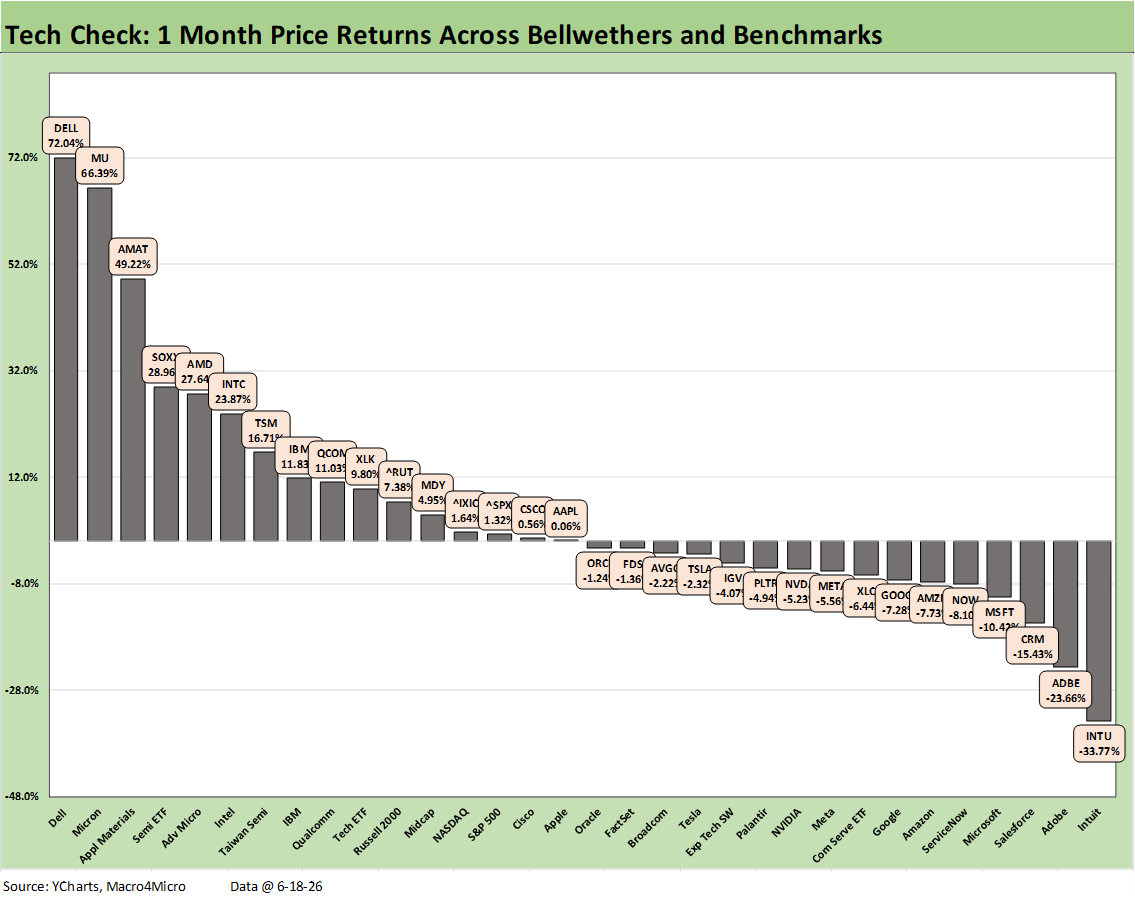
The 1-month tech check drives home the two different worlds of the semiconductor subsector vs. the software and SaaS service operators. The score for the past month was 16-16 with major outliers on the positive and negative side of the asset lines. We see a Hi-Lo return range of almost 106 points. If we exclude the Hi (Dell at +72%) and Lo (Intuit at -33.8%), we still see a Hi-Lo return differential of 90 points. SOXX posted a +29% return with the Software ETF (IGV) at -4.1%.
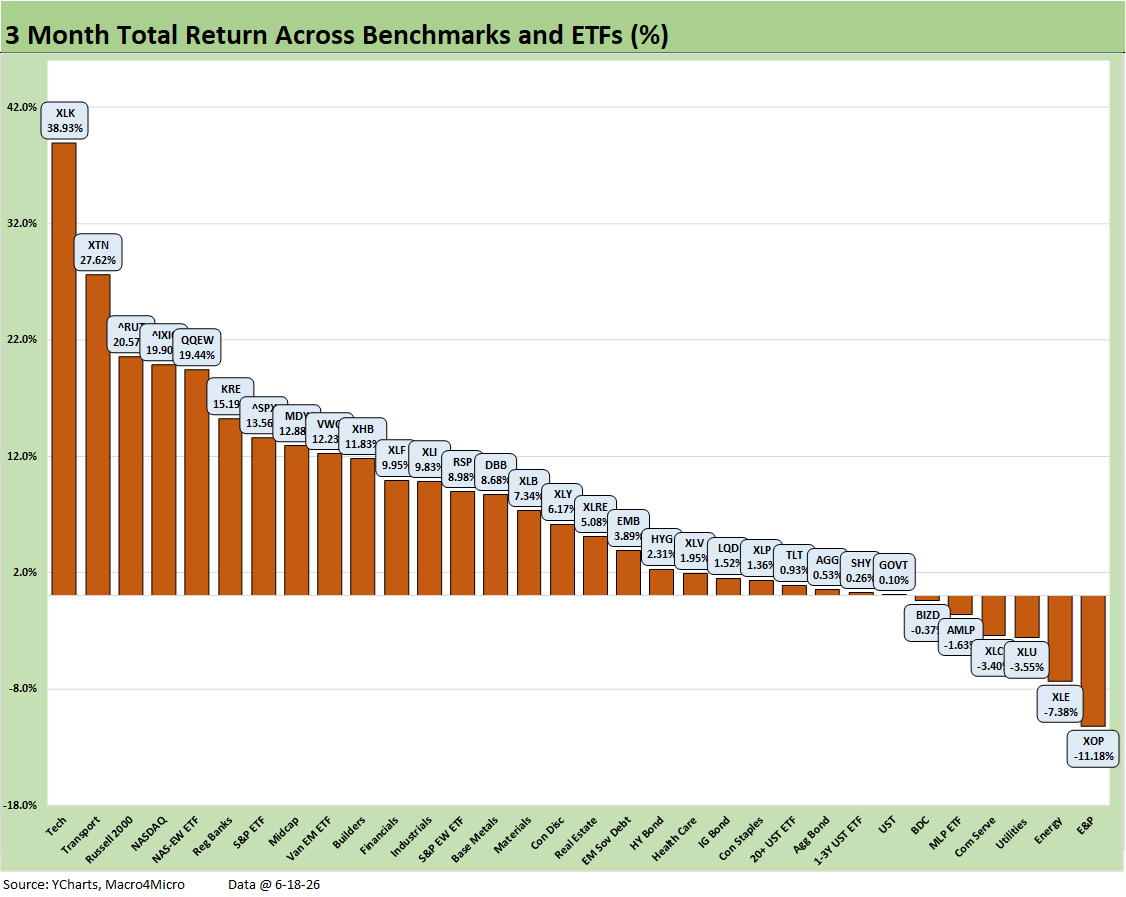
The 3-month returns on the broader mix of 32 benchmarks and ETFs include around 3 of the 4 months of the post-Iran period and some wild swings in the tech names when the AI displacement risks drove a bad case of nerves. The score of 26-6 frames a very strong running period.
We see Russell 2000 and NASDAQ in the top 5 along with the Equal Weight NASDAQ 100 ETF (QQEW). We also see the S&P 500 and Midcaps (MDY) in the top quartile, so that presents a well-diversified mix of solid performers in a tumultuous period since the Iran War was raising some challenges.
We see the Tech ETF (XLK) well ahead at #1 with the 3 main energy ETFs (XOP, XLE, AMLP) anchoring the bottom tier. The Transports ETF (XTN) had been supported by the easing in jet fuel and refined products after the initial spike.
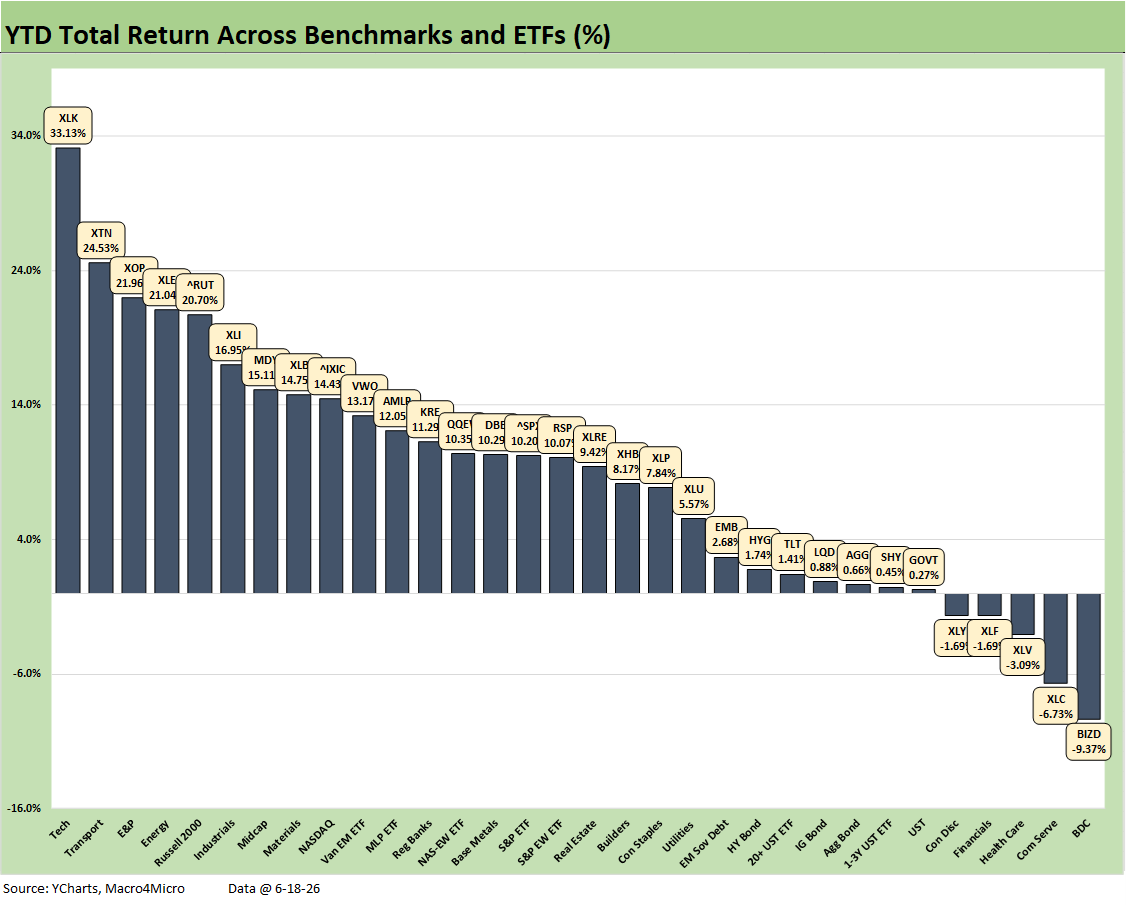
The YTD 2026 returns of the broader mix posted a 27-5 score with the BDCs on the bottom along with Communications Services ETF (XLC) and Health Care (XLV). Among major S&P 500 sectors we see the Financials ETF (XLF) and Consumer Discretionary (XLY) in the red.
Among the winners, we see Tech (XLK) joined by Energy (XLE) and E&P (XOP) while Transports (XTN) also placed at #2 in the top 5 along with the Russell 2000 small caps. Midcaps (MDY) also made the top quartile. NASDAQ and the S&P 500 were down in the second quartile. On a positive note for breadth YTD, Industrials (XLI) and Materials (XLB) made the top quartile.
It took 14.75% to make the top quartile, and that was over a period of less than 6 months. Those are very strong annual run rates.
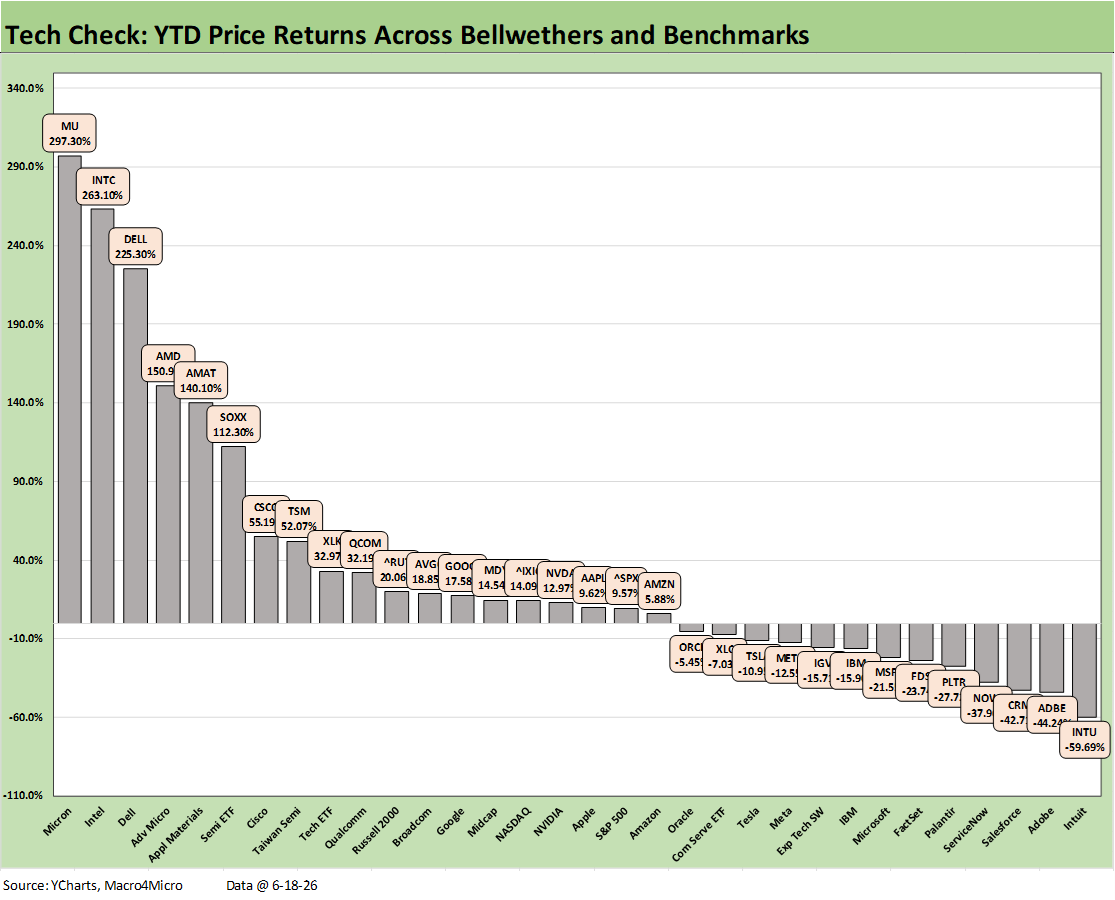
The YTD returns on the Tech Check mix posted a score of 19-13 with a top quartile performance less than 6 months that you seldom see in a career. We see the top 6 all in triple digits from Micron (MU) at +297% to the Semiconductor ETF (SOXX) at +112%. We see Intel (INTC) at #2 with +263% and Dell at #3 with +225%. It took 52% to make the top quartile.
The negative returns include a wave of software and SaaS services operators. That includes 11 lines in negative double digits and 7 names worse than -20%. The AI threat themes continue in speculation just as the valuation of names in the AI ecosystem have a highly speculative element as well. For the Semis, the current revenue run rates and earnings growth is very real. We will get Micron’s numbers and guidance this week.
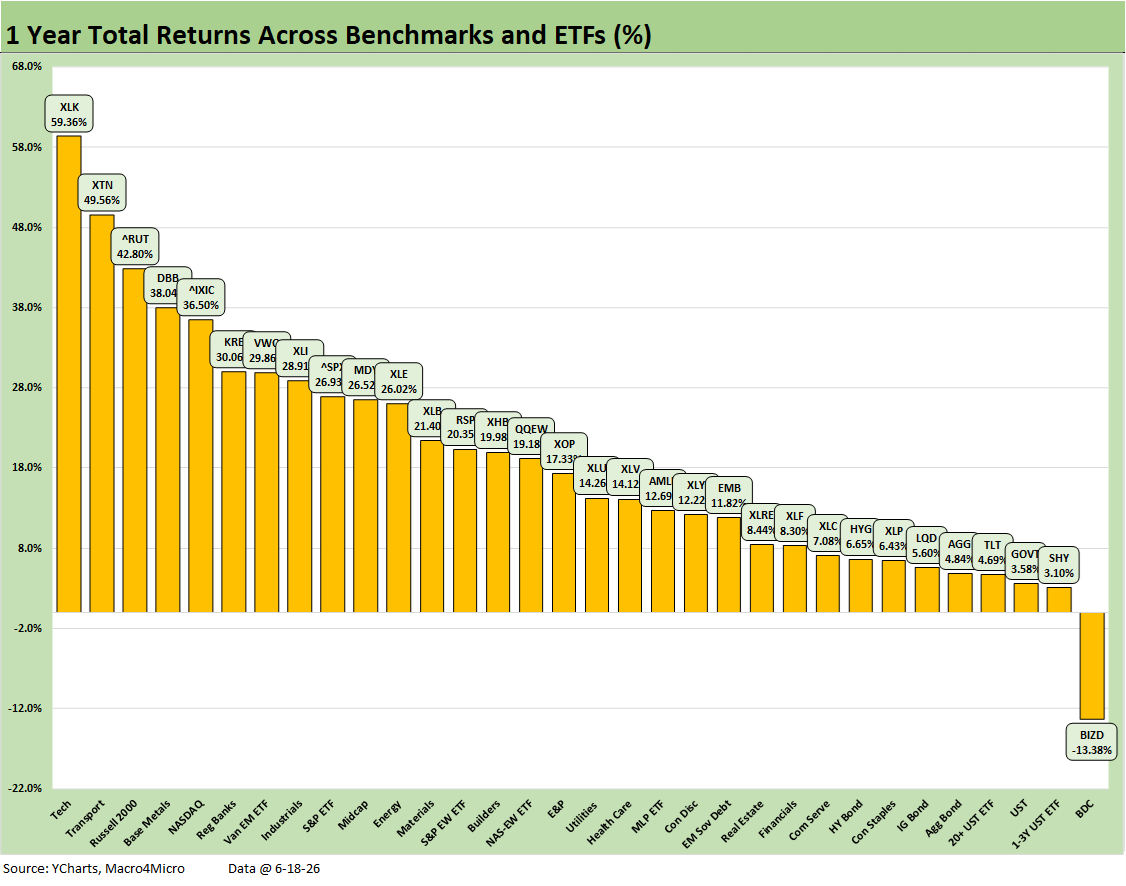
The 1-year time horizon for the broader 32 benchmarks and ETFs remains at 31-1 with the BDCs still in last place at -13.4%. We see 6 of 8 bond ETFs in the bottom quartile with only the EM Sovereign ETF (EMB) cracking double digits.
See also:
The FOMC Dance: Will Warsh and Trump Find a Rhythm? 6-17-26
Housing Starts May 2026: Weaker for both Single Family and Multifamily 6-16-26
Industrial Production May 2026: Steady, Balanced Utilization Levels 6-15-26
Geopolitical risk: Trump’s Nuclear Saber Rattling? 6-14-26
Producer Price Index May 2026: Too Many “Since 2022” References 6-11-26
CPI May 2026: The 4% Rubicon 6-10-26
Remembering D-Day: June 6, 1944
Employment May 2026: Big Rebound, Low Multiplier Bias 6-5-26
The Fall of CBS 6-3-26
JOLTS April 2026: A Modestly Positive Turn 6-2-26
Retail Signal Read Part Deux 6-1-26
New Home Sales April 2026: Slow Start to Spring 5-28-26
PCE Inflation: Income and Outlays April 2026 5-28-26
GDP 1Q26 Second Estimate: Shrunk in the Dryer 5-28-26
Retail Equity Comps: Looking for Signals 5-26-26
D.R. Horton: Financial Powerhouse Despite Cyclical Softening 5-20-26