
Market Commentary: Asset Returns 6-28-26
Tech weakness was the main event even as Washington goes off the rails in legislative dysfunction and the Iran deal is a mess.


The asset return profile showed a material shift this past week with tech getting hammered and the semiconductor group facing one of its few weekly setbacks in recent months. The S&P 500 earnings growth trends have been anchored in 2026 YTD by a subset of the Mag 7 and semiconductor leaders, but they have been joined by the major oil companies upstream and downstream (e.g. XOM, CVX, VLO) after Iran. A range of commodity-based firms were also rewarded by the Gulf disruptions (at a cost to the consumer).
We still have no shortage of trade and geopolitical risks floating around as we approach the official review date for the USMCA next week. We also heard more threats from Trump of 100% tariffs on trade partners who levy digital services taxes on US companies. Playing chicken with the domestic politics of other nations creates a scenario where the EU and Canada and potentially Mexico might retaliate all at once. Strange times can bring strange outcomes. That would be a shock given the EU and Canadian history of backing down, but the timing of the insults and the trade threats could bring a harder pushback response than usual.
The inflation news was bad this past week with the 1Q26 PCE price index showing 4% handle increases for both headline (4.6%) and core (4.4%) while May 2026 posted a 4% handle headline for the month at 4.1%. In the plumbing of the May numbers, we see Energy Goods and Services at +24.3%, Goods at +4.8%, Nondurable Goods at +5.6%, Durable Goods at +3.3% and Services at +3.8%. PCE Services ex energy and housing was +3.9%. (See Personal Income & Outlays May 2026: Bad Inflation, Balanced Spending 6-26-26, GDP 1Q26 Final: PCE Growth Plunge 6-25-26)).
FedWatch odds of an FOMC easing by the Dec 2026 meeting has essentially been zero. The latest odds (Sunday afternoon) of 1 hike by Dec 2026 are 41.5% and “no change” at 21.9%. We see 2 hikes at 27.9%, 3 hikes at 8.0%, and 4 hikes at 0.8%. Those odds will swing around with Iran, oil and inflation readings. The trend has generally been very bad for the easing scenario.
Our theory is the realities of political events and policy disputes show a convergence of politics and economics that has not been this high since the New Deal years of the 1930s even if every President has had their share of challenges from wars to bank crises to asset bubbles and even pandemics.
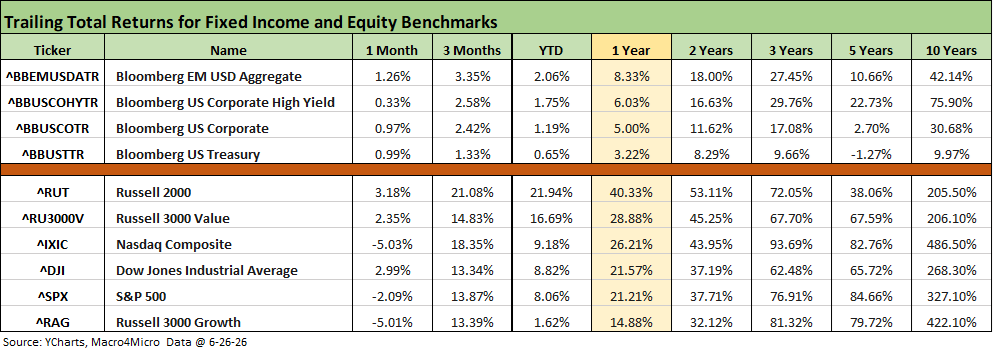
The above table summarizes the time horizon returns for debt and equities. The UST rally helped fixed income this week, but the past month in equities shows NASDAQ in the red alongside the tech-heavy S&P 500 and Russell 3000 Growth benchmark.
The trailing 3 month numbers remain dazzling in equities as the market looks past Iran and have stays in pursuit of the AI dream despite some tossing and turning on growth metrics and a reassessment of “what can go wrong?” in the valuation assumptions.
Looking back over 1-year in equity returns, the numbers run as high as 4x the long-term equity market returns. The market has pushed past higher rates and a de facto abandonment of easing expectations (unless something goes very wrong). The nervousness around a major correction in equities (or near bear market move such as late 2018) will remain. The instability and bad intent that routinely manifest in Washington will not help.
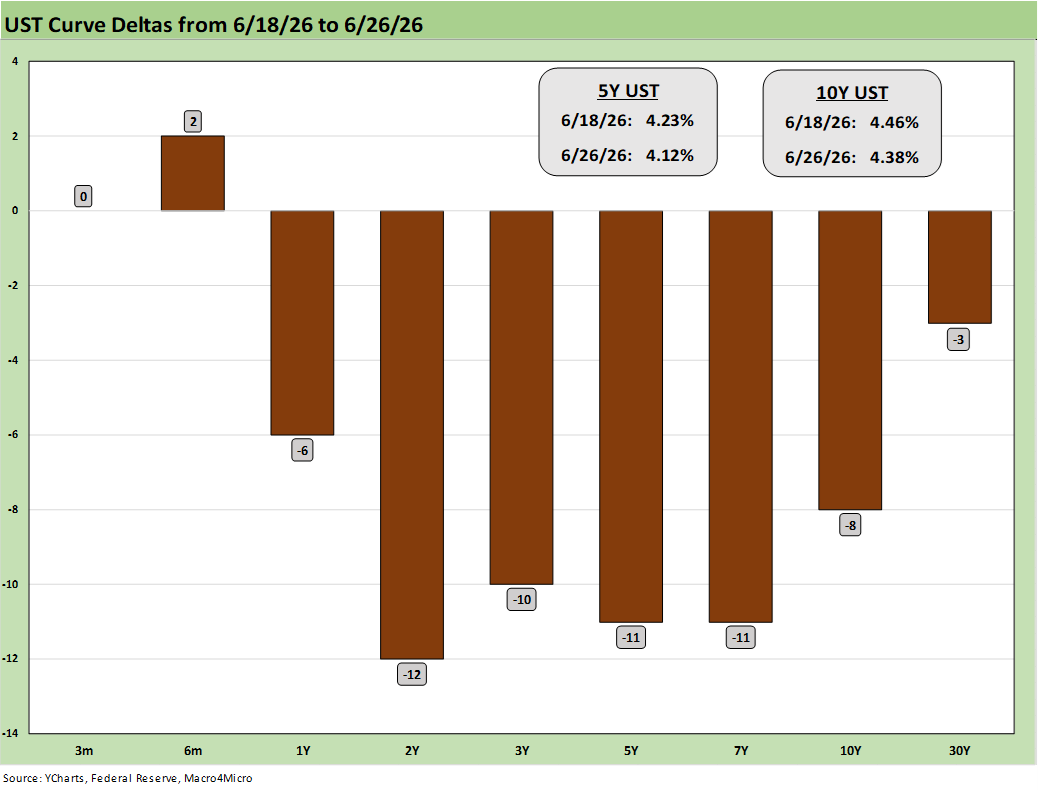
The above chart updates the weekly UST deltas as a supportive but moderate bull steepener unfolded despite the adverse PCE inflation metrics. Oil declines helped while the final estimate of 1Q26 GDP moved materially lower with severe weakness in Personal Consumption Expenditure (PCE) growth.
As we covered in the GDP commentary, the PCE growth was extremely weak in historical context with Services especially so. PCE growth was well below those posted in 2024 (See Personal Income & Outlays May 2026: Bad Inflation, Balanced Spending 6-26-26, GDP 1Q26 Final: PCE Growth Plunge 6-25-26).
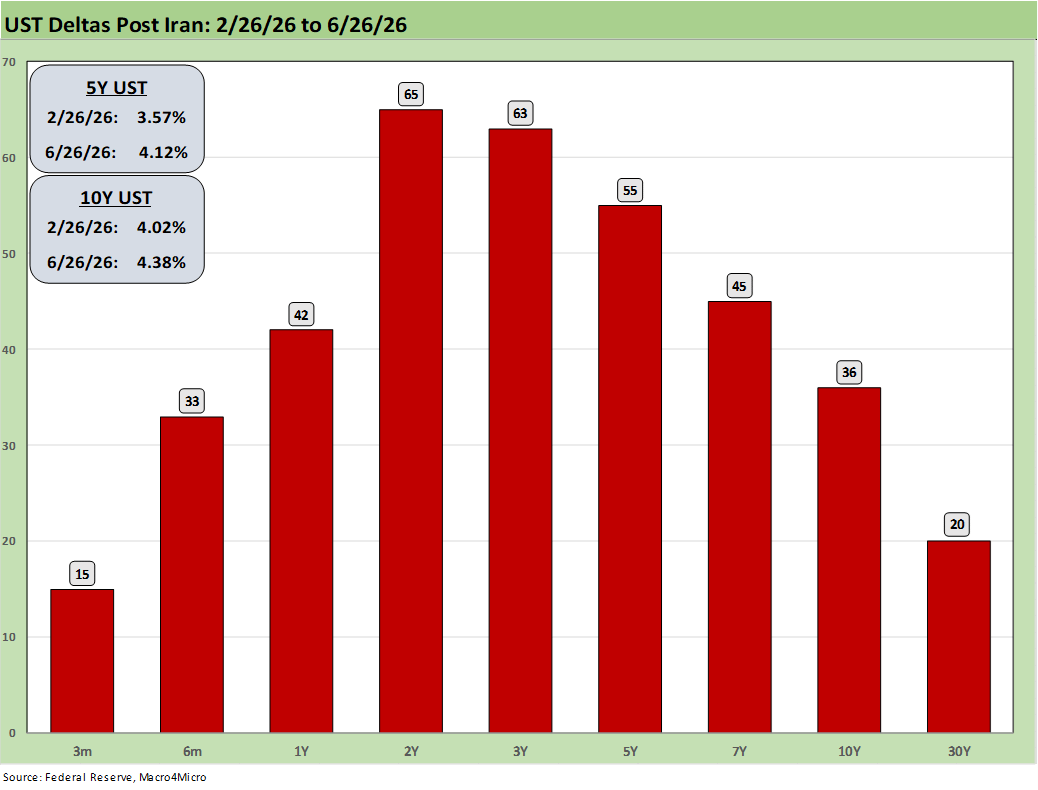
The above chart updates the post-Iran UST deltas from 2-26-26 (bombing began 2-28-26). We see a bear flattener as the 2Y UST was pummeled on the radical shift in odds for fed hikes vs. fed easing as covered in the bullets.
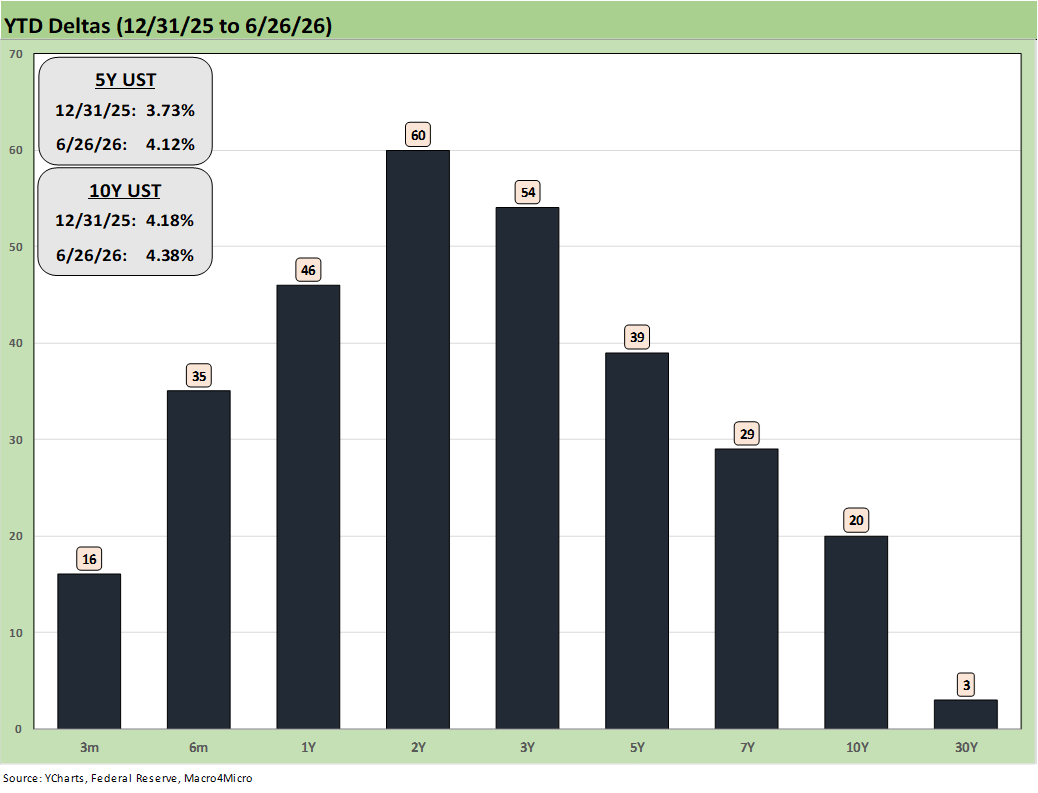
The YTD deltas show the inflation toll and gradual dissipation of easing confidence. As cited in the prior chart, the dagger was the Iran fallout and how that has reverberated along the chain from raw materials to OEMs and into the costs of delivering services.
With oil prices coming down to near pre-Iran levels, the time lags across working capital cycles or inflation expectations will take time. Costs built into inventory and sustained inflation in such areas as health care, electricity, and housing along with recurring higher financing costs tied to debt incurred in 2025-2026 will undermine any “all is well now” sales pitches from the White House. Consumers have a household budget and balance sheet hangover in many cases.
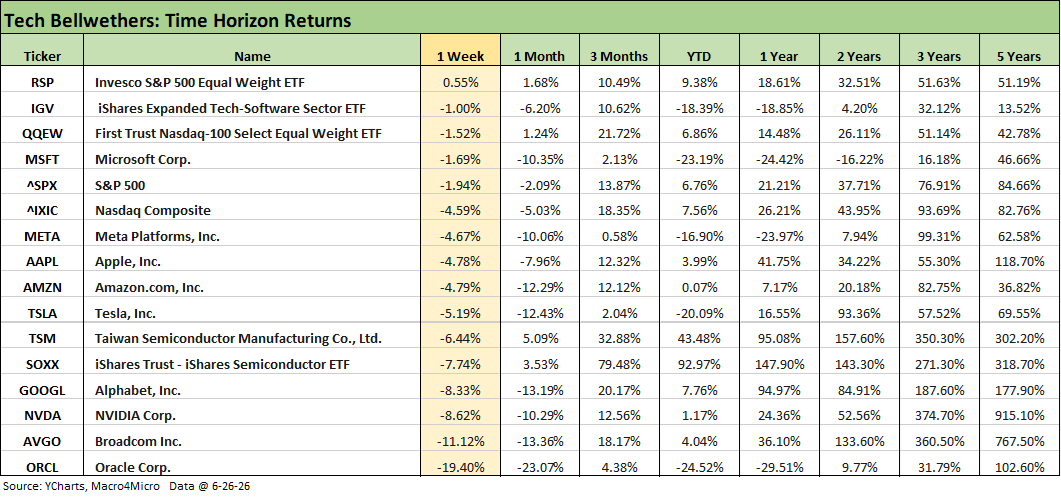
The tech bellwether returns in the table tell a simple story this week with all names and ETFs listed in negative range except the Equal Weight S&P 500 ETF (RSP). We look at a range of single names in our “tech check” charts below.
We see Oracle (ORCL) and Broadcom (AVGO) putting up double-digit negative numbers this week as 6 of the Mag 7 underperformed the S&P 500 and NASDAQ and all the bellwethers were below the Equal Weight S&P 500 (RSP). In a rare week of outperformance, the Software ETF (IGV) at -1.0% beat the Semiconductor ETF (SOXX) at -7.74%.
The 1-month numbers were also grim with all of the Mag 7 in the red and 6 of the 7 in negative double digits while Apple posted -8.0%. Oracle at -23.1% and Broadcom (AVGO) at -13.4% also had brutal months. The 3-month time horizons are all positive and more dispersed with META, MSFT, and TSLA in low single digits.
The following is a cut-and-paste from our Saturday LinkedIn posts with some minor updates and edits:
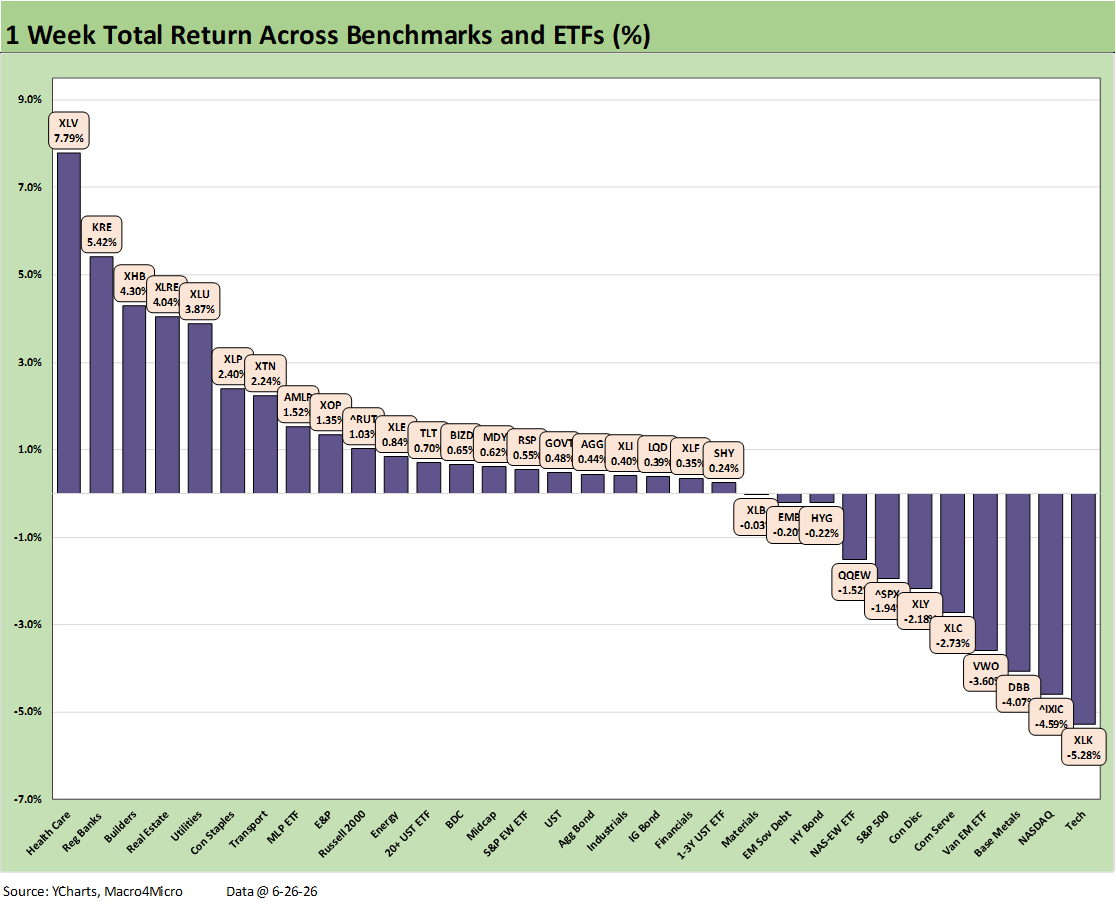
The chart updates the running 1-week total returns on the 32 benchmarks and ETFs we monitor with an overall positive-negative score of 21-11. The diverse base of winners outside tech includes Health Care (XLV) at #1 followed by Regional Banks (KRE) and Homebuilders (XHB). Dividend heavy Real Estate (XLRE), Utilities (XLU), and Consumer Staples (XLP) follow.
Health Care (XLV) saw some very strong performance from the Pharma names including some double-digit moves in major pharma holdings. The Homebuilders (XHB) were helped by those looking past the inflation nerves and oil price threat, but there was also some relief in the KBH earnings guidance despite posting a quarter with lower margins and weaker selling prices. The new home sales numbers from the Census bureau were soft, but builders have seen some takeover activity with more consolidation expected.
We saw tech taking a beatdown this week while some of the commodity pressures related to the Strait of Hormuz traffic is starting to get reflected in ETFs such as Base Metals (DBB) and the chemicals-heavy Materials ETF (XLB).
The losers on the week were tech ETFs such as XLK, which is sitting in dead last at -5.28%. We also see pressure on tech-heavy benchmarks with NASDAQ and S&P 500 in the red and well behind small caps and midcaps.
The Equal Weight NASDAQ 100 ETF (QQEW) is in the bottom quartile along with Communications Services (XLC), which posted -2.73%. We look at the weak tech equity performance in our separate tech check chart.
Bond ETFs saw duration relief with a positive-negative score of 5-2 as a bull steepener unfolded and the curve posting moves in 2Y at -12 bps, 10Y at -8 bps, and 30Y at -3 bps. The long duration UST ETF (TLT) was on top in return but riskier credit assets are seeing some spread pressure. The HY ETF (HYG) and EM Sovereign ETF (EMB) were both slightly in the red for the week in the bottom of the third quartile.
The FOMC remains a question mark for bonds as oil has come down while chaos in the MOU process seems to be the order of the day. The activity in the Strait leaves an asterisk on what defines a ceasefire (e.g., some shooting and bombing is OK), but the oil markets still saw WTI dip below the $70 line to $69.23 on Friday vs. $75.85 the prior Friday.
Lower oil eases some of the bear steepener scenarios driven by the long end. The reality this week was that all we saw was bad news for May inflation metrics. May PCE headline inflation and the 1Q26 PCE price index posted 4% handles.
The following is a cut-and-paste from our Saturday LinkedIn posts with some minor updates and edits:
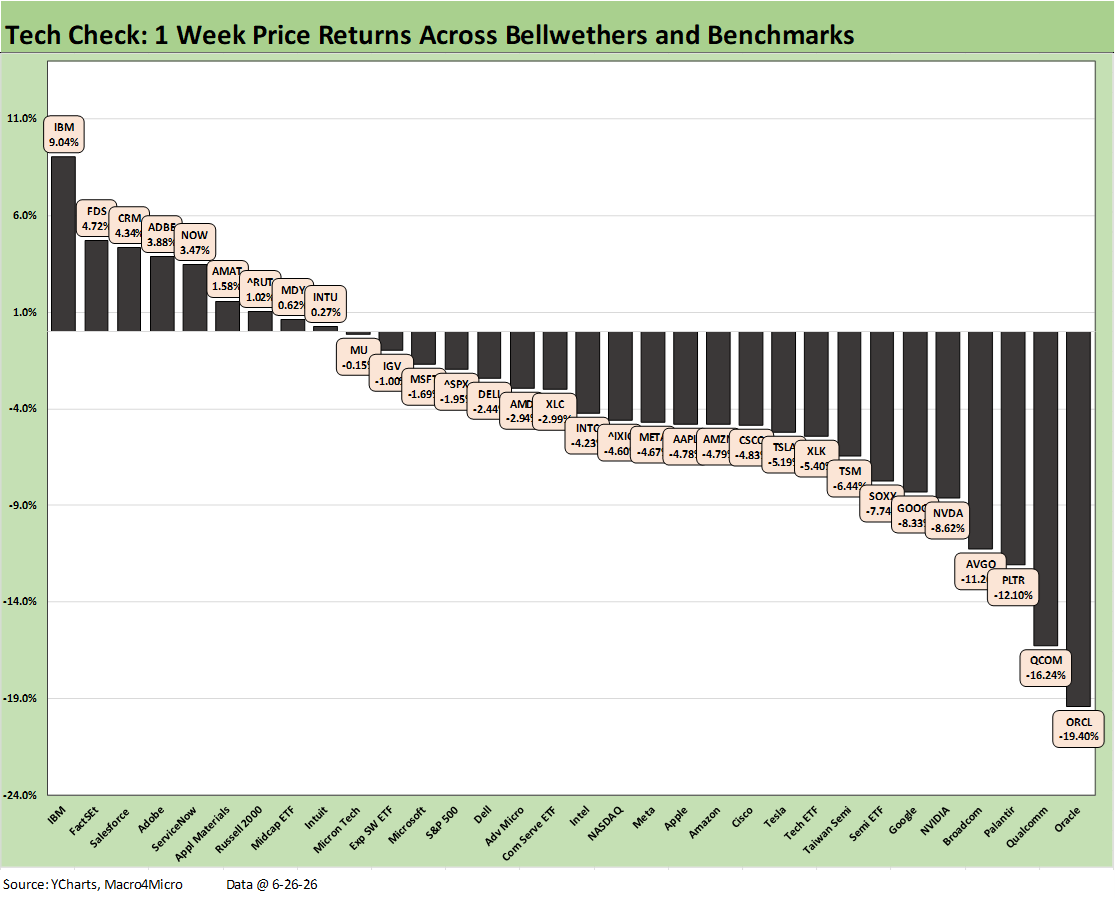
The chart updates our Tech Check list with a rough showing on the week. We see a positive-negative score of 9-23 as the big winners of recent periods – notably in semiconductors – experienced a relatively brutal week by recent standards. We have seen much worse from the software and SaaS names in sell-offs, but 4 major names in the bottom quartile with double-digit negative returns got the attention of people worried about excess valuations and bubble risk.
Oracle (ORCL) as a software play has been especially volatile and came in last place at -19.4% with Palantir (PLTR) also ugly at -12.1%. Both of those names are in the Software ETF (IGV). Seeing Taiwan Semi (TSM) and NVDA in the bottom tier will keep sector watchers on edge.
Micron has been the star of the show in 2026 at just under a 300% return, but the week was very quiet for MU at -0.15% even after an amazing quarter. We see Applied Materials (AMAT) still in the top tier since no one is questioning sustained investment in semi equipment. The Russell 2000 and Midcaps (MDY) were the only broad benchmarks in the top tier. The Mag 7 were all in the red for the week. That Mag 7 group is all in the red for the trailing 1-month also.
We see the Semiconductor ETF (SOXX) in the bottom quartile at -7.74% while the Software ETF (IGV) was also in the red with a smaller negative return of -1.0%. The software and SaaS names saw 4 stocks (FDS, CRM, ADBE, NOW) move up into the top quartile. As we will detail in the broader asset return commentary, those same 4 names are deeply in the red YTD. The best of those (FDS) is at -20.1% YTD and the worst (ADBE) is at -42.1% YTD.
The more diversified IBM with its recent twists and turns (quantum computing, government investment interest, etc.) captured #1. IBM has a play on numerous markets (AI, quantum, software) and has a stabilizing services component (consulting) that takes a lot of risk out of the equation. IBM had initially been tagged with the software and SaaS selloff and is still in the red YTD (-8.3%)
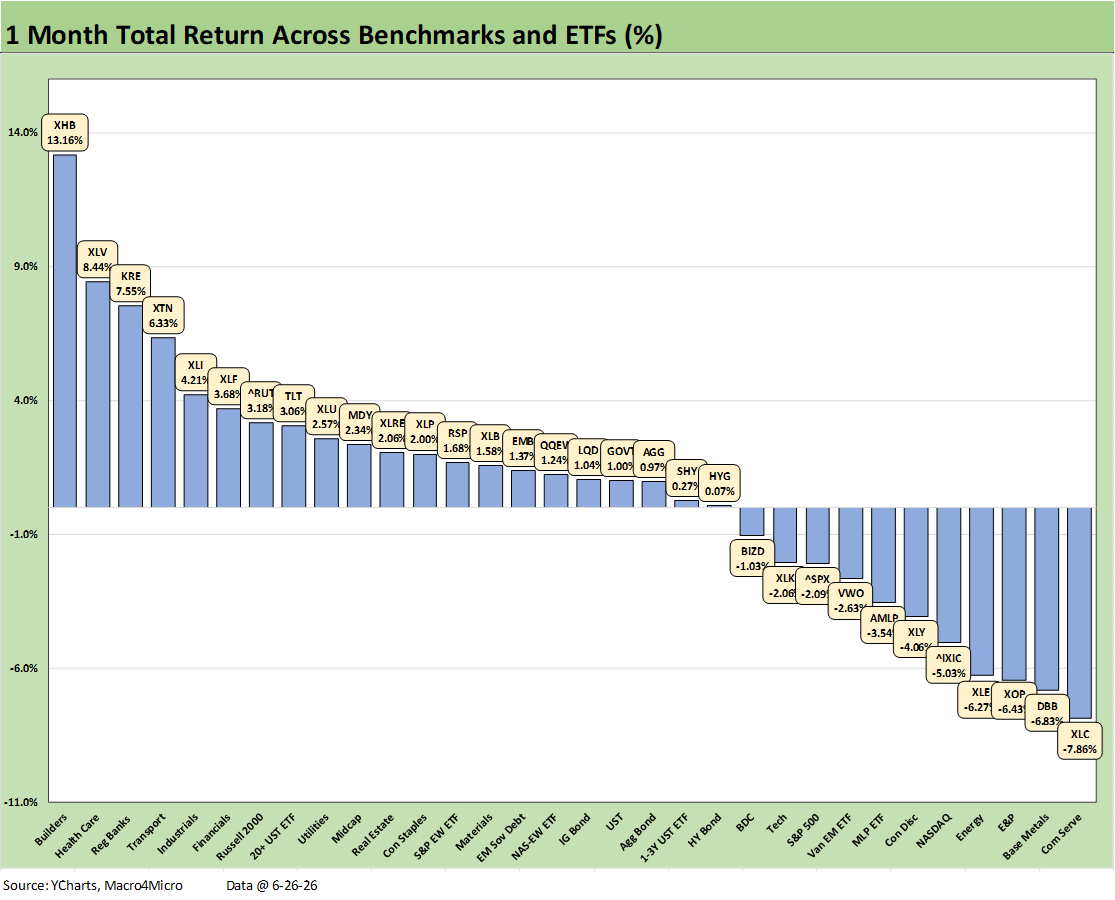
For the 1-month timeline, we see a score of 21-11 for the broader peer group of 32 benchmarks and ETFs. The Russell 2000 small caps made the top quartile and Midcaps (MDY) placed near the top of the 2nd quartile. NASDAQ was mired in the bottom quartile with a -5.0% return while the S&P 500 at -2.1% sat at the bottom of the 3rd quartile just behind the Tech ETF (XLK).
The top quartile shows a healthy diversified mix that included Homebuilders (XHB) on top by a material increment as more investors look past Iran and the UST rate anxiety. That Iran deal is not wrapped, but the long end of the curve has been friendlier with the long duration UST ETF (TLT) making the low end of the top quartile. All 7 bond ETFs were in positive range even if barely for HY (HYG) and the short UST 1Y-3Y UST ETF (SHY).
The top quartile included Health Care (XLV) at #2, Regional Banks (KRE) at #3, Transports (XTN) at #4, and Industrials (XLI) rounding out the top 5. That sends the signal of a supportive view on the cycle.
The lower oil prices and potential to get the Trump-Iran MOU to the finish line sent the 3 energy ETFs (XOP, XLE, AMLP) into the bottom quartile.
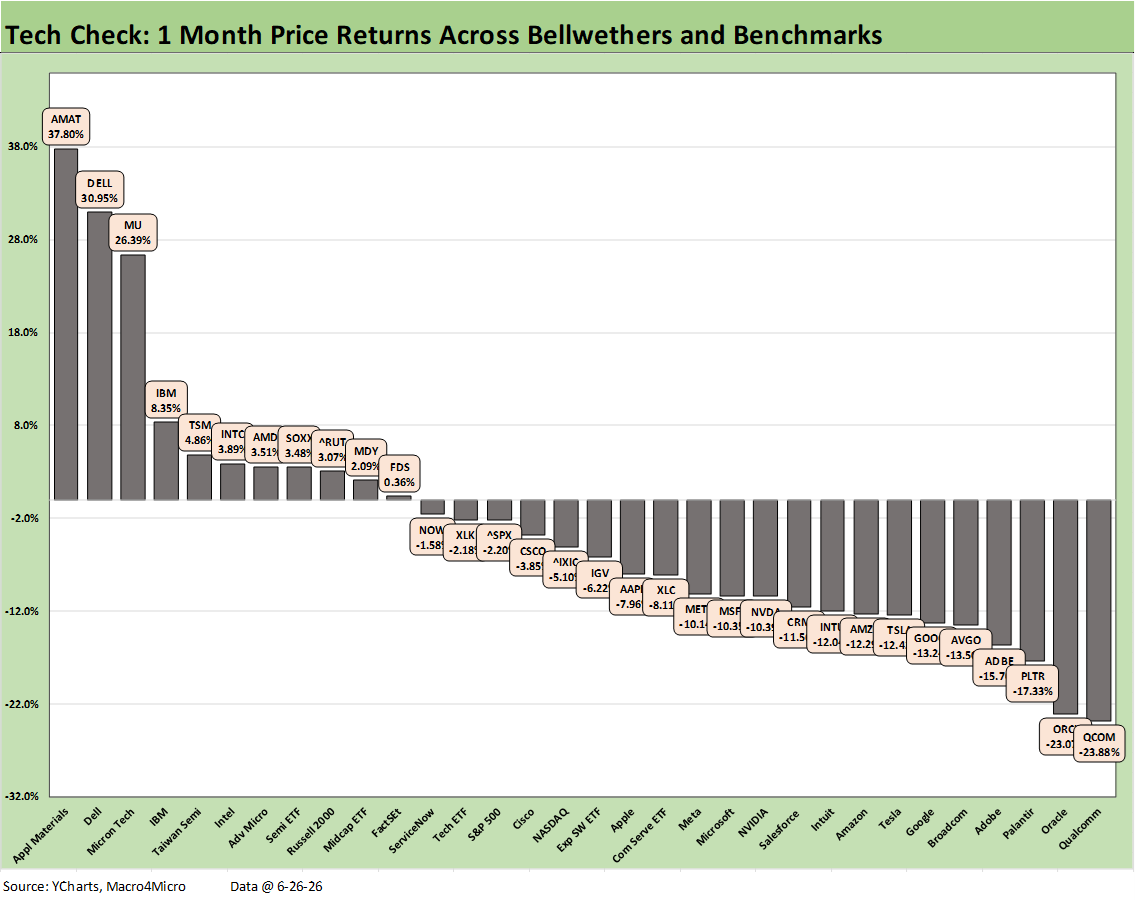
The 1-month Tech Check mix shows a rough month and a score of 11-21. We see all of the bottom quartile lines in double-digit negative range and the same for 5 of the 8 in the third quartile. We see 6 of the Mag 7 with double-digit negative returns with Apple the best of “the 7” at -8.0%.
The worst performers were mixed across subsectors with Qualcomm (QCOM) in last place at -23.9% behind Oracle (ORCL) at -23.1% and Palantir (PLTR) at -17.3%. The bottom quartile is well diversified for the month and not just dominated by the software and SaaS beatdown we had been seeing. The bottom quartile includes 3 of the Mag 7 (GOOGL, TSLA, AMZN).
The winners include Applied Materials (AMT) at +37.9% followed by Dell (+31.0%) and Micron (MU) at +26.4%. That is before a distant drop to IBM at +8.35%.
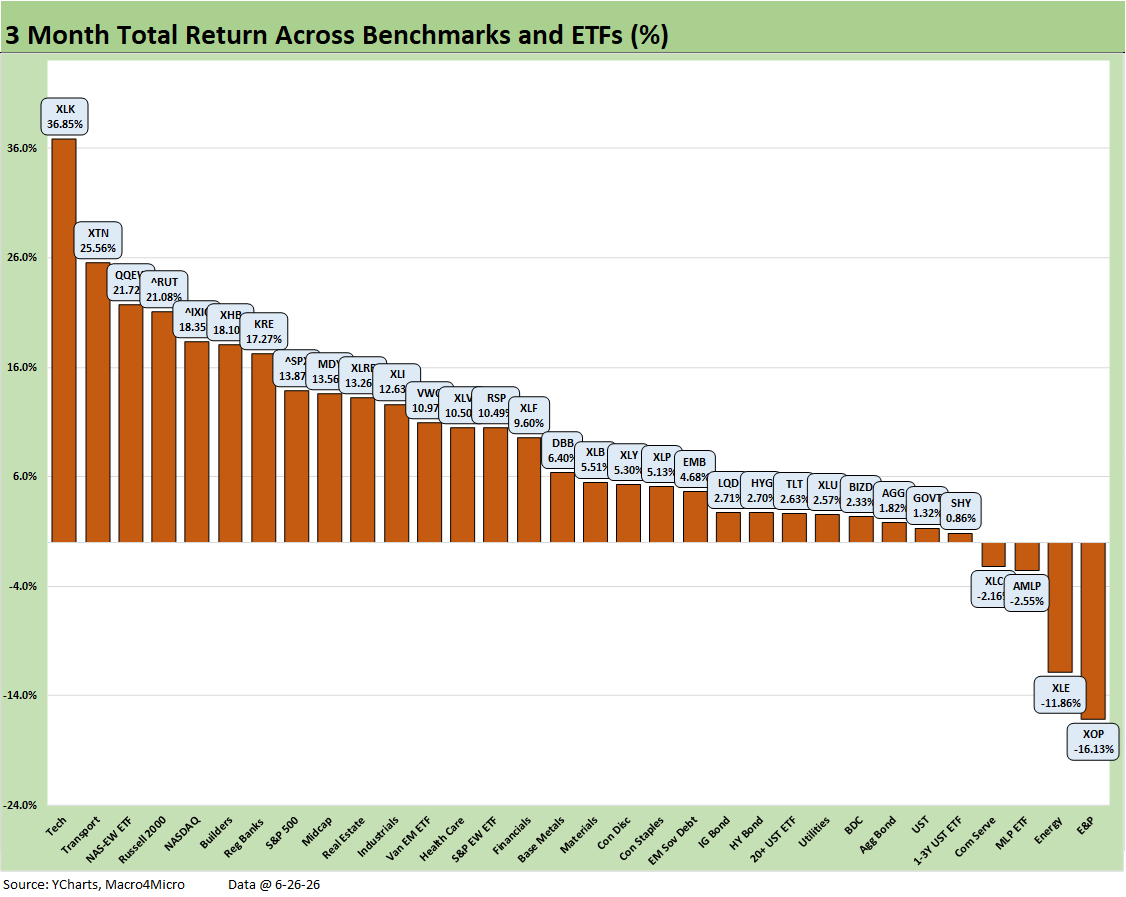
The 3-month time horizon starts the measurement period around a month into the Iran War. Tech’s AI ecosystem was rocking, so the recent weakness is still trumped by the sprinting start with the Tech ETF (XLK) at #1. We see the Equal Weight NASDAQ 100 (QQEW) at #3 with +21.7% as part of the tech strength.
The score of 28-4 includes the 3 energy ETFs in the red as the oil and gas crisis subsided. That in turn offered support to the Transports which ranked #2 at 25.6%. The Russell 2000 small caps at #4 and NASDAQ rounded out the top 5. Homebuilders (XHB) and Regional Banks (KRE) wrapped the rest of the top tier along with the tech heavy S&P 500 with Midcaps (MDY) just behind it. That was a healthy overall mix for the leaders.
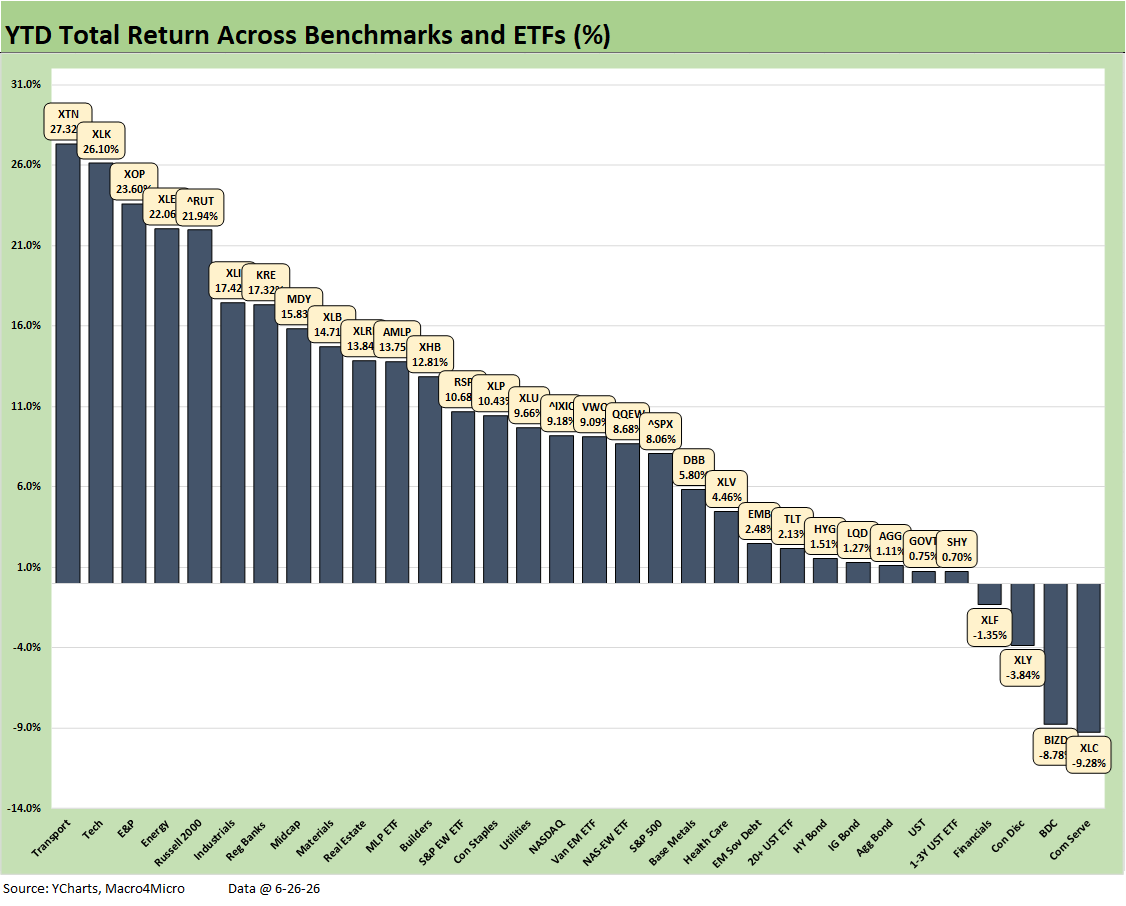
The YTD rankings show a score of 28-4 with Communications Services (XLC) on the bottom just behind the long suffering BDC ETF (BIZD). Consumer Discretionary (XLY) and Financials (XLF) are two major sectors of the S&P 500 that continue to lag.
The winners in the top tier include Transports (XTN) at #1 just ahead of Tech (XLK) followed by the two broad upstream energy ETFs (XOP, XLE). Russell 2000 had been among the winners YTD along with Midcaps (MDY) in the top tier. NASDAQ sits at the bottom of the 2nd quartile and the S&P 500 in the 3rd quartile.
The median return along the asset lines is around 9.1% as we near the end of the 1H26 period this week. That is a very healthy 6-month pace. For the YTD period, it took 15.8% to make the top tier. The Hi-Lo range was almost 37 points. If we toss out the Hi and Lo, the range was almost 35 points.
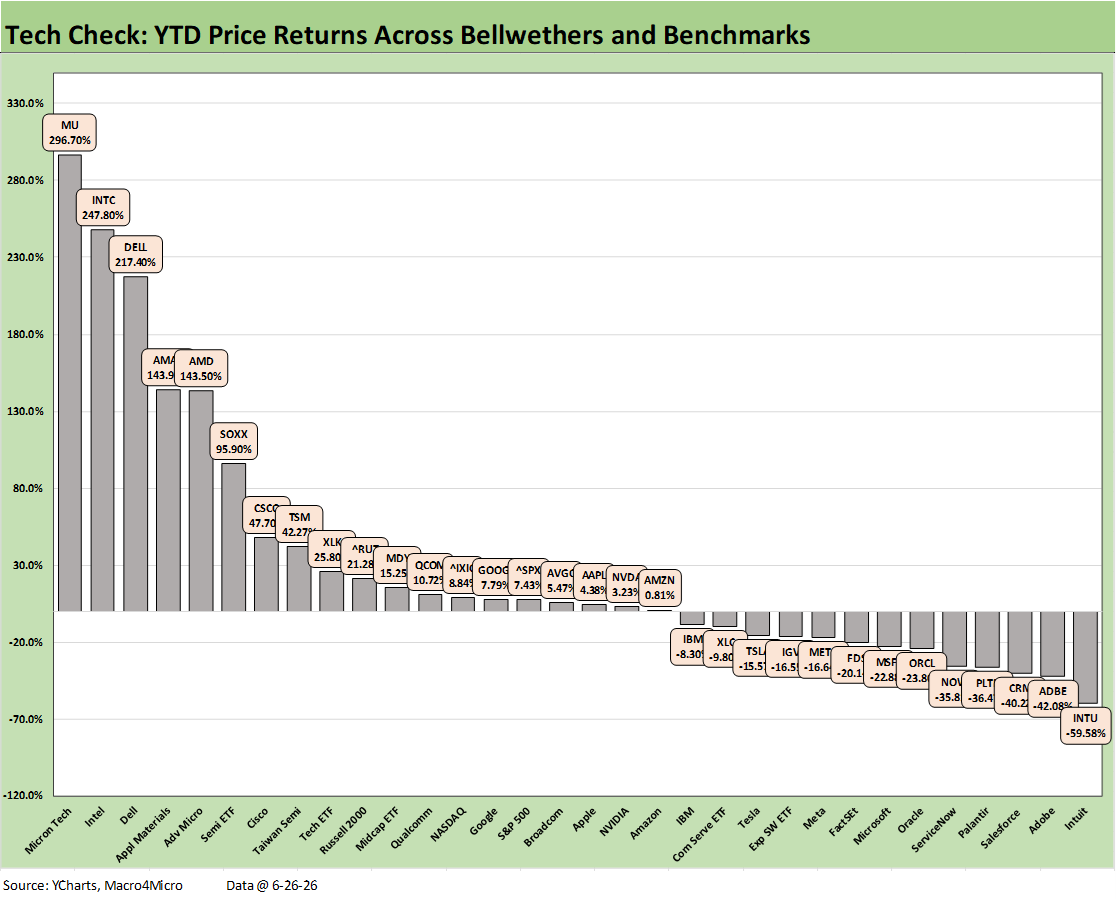
The YTD Teck Check numbers show a wild year to say the least with the top 3 all posting returns above the 200% threshold led by Micron (MU) at 297.7%, Intel (INTC) at 247.8%, and Dell (DELL) at 217.4%. Then we see the AI ecosystem collection and semiconductor-heavy mix with Taiwan Semiconductor (TSM) at the low end of the top quartile with a 42.3% return. That is over a 250 point Hi-Lo range just in the top quartile.
The bottom quartile is dominated by the software and SaaS based services operators that have been crushed since the downside of “AI domination” started to infect the forward-looking views on these software names and the threat to business models.
The median across the 32 asset lines is around 4.9%, so that is quite a dispersion of results with a Hi-Lo range of 356 points from top to bottom. Toss out the Hi and Lo names and the range is still 290 points.
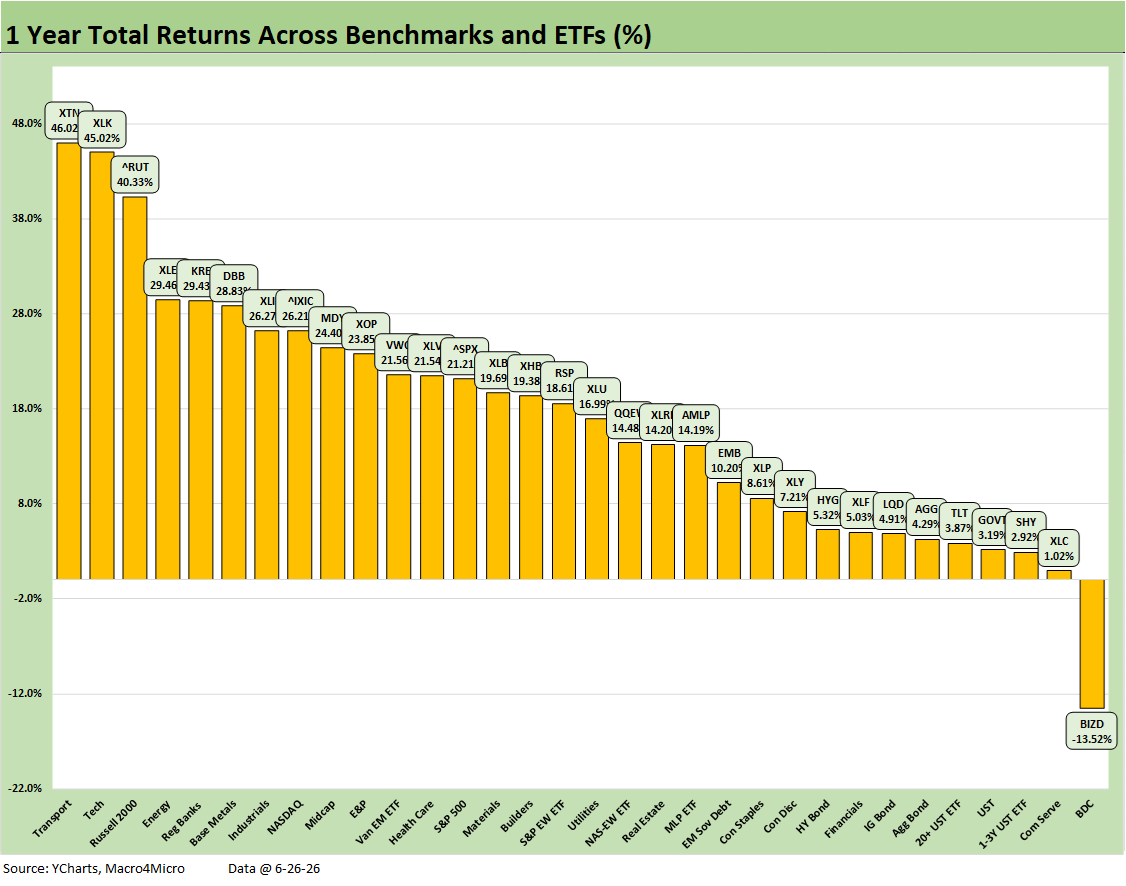
The 1-year time horizon has been steady at 31-1, and that remains in place again this week. Despite the bouts of worry on the lack of market breadth and narrow leadership of tech in long stretches of 2026, we see a healthy mix with Tech (XLK) at #2 and NASDAQ at #8 in the top quartile but otherwise a healthy group of diverse industries with Transports (XTN) at #1, Russell 2000 at #3, Energy (XLE) at #4, and Regional Banks (KRE) at #5. We also see Base Metals (DBB) riding the Iran disruptions with Industrials (XLI) wrapping the top tier lineup.
See also:
JD Vance and Nixon History: Clueless 6-27-26
Personal Income & Outlays May 2026: Bad Inflation, Balanced Spending 6-26-26
New Home Sales May 2026: Weak Volumes, Stable(ish) Prices 6-25-26
GDP 1Q26 Final: PCE Growth Plunge 6-25-26
Trade Deficits: The Moving Parts and Macro Goals Matter Most 6-24-26
Market Commentary: Asset Returns 6-21-26
The FOMC Dance: Will Warsh and Trump Find a Rhythm? 6-17-26
Housing Starts May 2026: Weaker for both Single Family and Multifamily 6-16-26
Industrial Production May 2026: Steady, Balanced Utilization Levels 6-15-26
Geopolitical risk: Trump’s Nuclear Saber Rattling? 6-14-26
Producer Price Index May 2026: Too Many “Since 2022” References 6-11-26
CPI May 2026: The 4% Rubicon 6-10-26
Remembering D-Day: June 6, 1944
Employment May 2026: Big Rebound, Low Multiplier Bias 6-5-26
The Fall of CBS 6-3-26
JOLTS April 2026: A Modestly Positive Turn 6-2-26
Retail Signal Read Part Deux 6-1-26