
JOLTS April 2026: A Modestly Positive Turn
Openings up, hires down, layoffs down, but the openings number was the headline at over 10% higher.


What’s behind door #1 (Iran deal?), #2 (skies-the-limit tech boom?), or #3 (escalation + Houthis + Red Sea?)
The +731K (+10.3%) rise in openings MoM (+7.3% YoY) was dominated by the “Professional and business services” with a +668K increase. Notable declines included “Finance and Insurance” at -135K.
Hires decreased by -419K or by -7.6% and that takes a little luster off the job openings optimism. Manufacturing as a recurring focal point in the new tariff regime saw hires move modestly lower by -20K. Retail trade was lower by -81K and “Transportation, warehousing and utilities” lower by -41K. “Professional and business services” hires were down by -131K , Financial activities down by -30K, “Private education and health services” was down by -67K.
On a positive note, “layoffs and discharges” declined by -192K or by -10.2% MoM and by -6.9% YoY. Retail trade layoffs declined by -88K, “Professional and business services” dropped by -112K. Manufacturing layoffs rose slightly but construction layoffs declined.
A big question from here is where Iran and the consumer cycle go next and what will happen to Services hiring/firing in the age of AI. For now, it is still “low hire/low fire” but job openings offer hope.
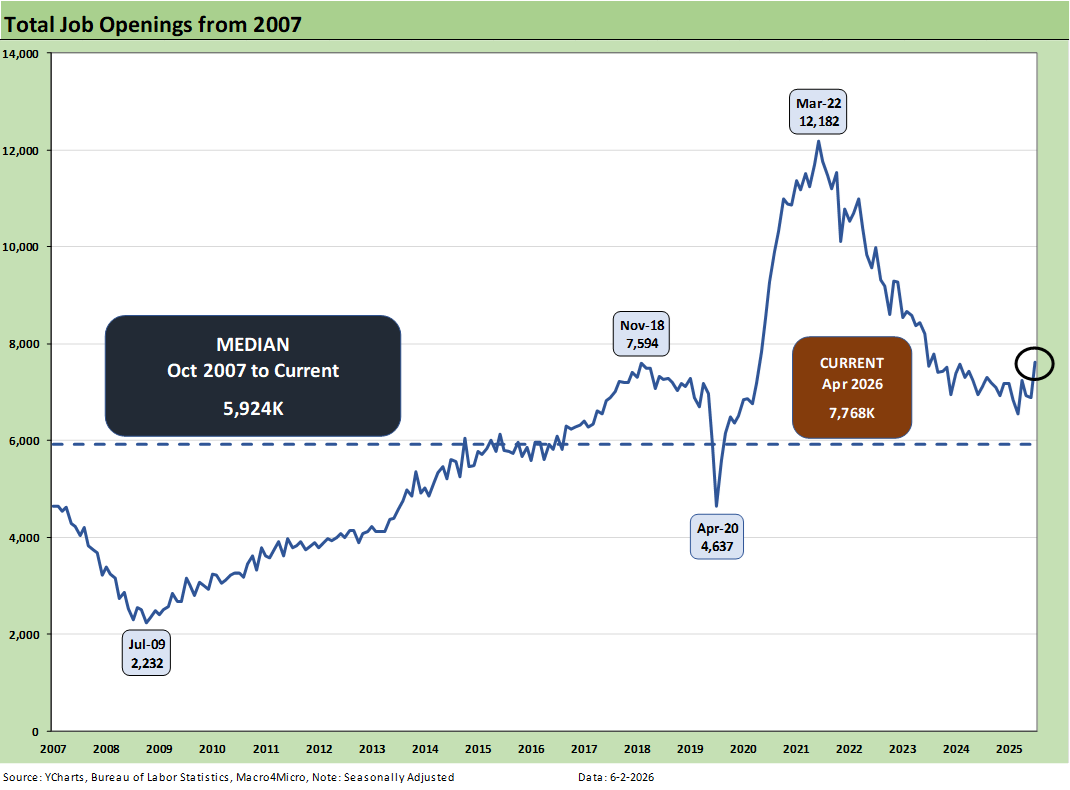
The above time series plots job openings across the timeline from 2007 to current. This month brought a very sharp rebound in openings that starts to claw back some of the material downward trends from the end of ZIRP and the start of the tightening cycle in March 2022.
The high of 12.2 million off the lows of 4.6 million at the peak of the COVID panic are pretty dramatic, but recent periods had been soft before the April 2026 bounce of +731K back to 7.6 million. Openings are running well above the long-term median (5.92 million).
The 10.6% increase YoY job openings for April 2026 was good news and the questions from here will be how quickly (or not) those translate into actual hiring with the Iran X-factor playing a big role. The AI economic effects in terms of productivity and payroll needs also will be up in the air in a services economy.
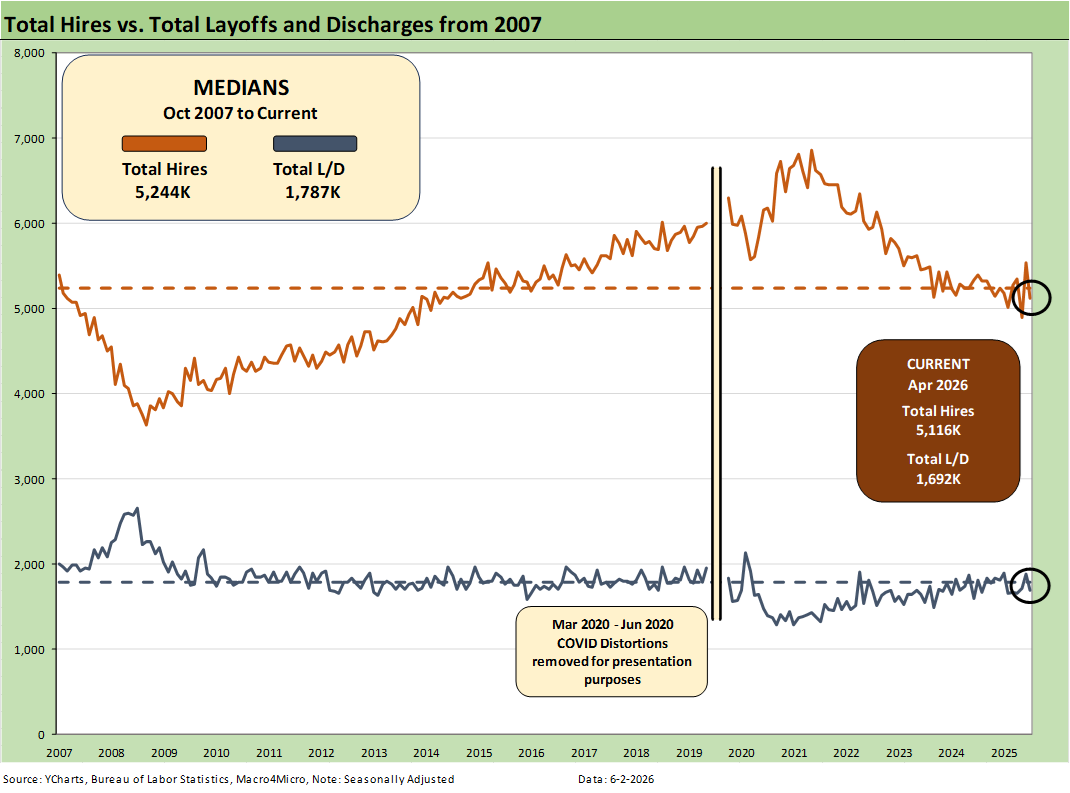
The above chart plots Hires vs. Layoff/Discharges on a SAAR basis. Note: we remove the COVID numbers from several charts to support the visual value for “normal” periods. We comment on COVID history at the end of the note.
Hires declined by -419K sequentially from March 2026 while layoffs/discharges declined by -192K. The hires YoY declined by -275K or by 5.1%. While we are in an expanding economy, the annual GDP growth of 2.1% in 2025 had lagged 2024’s 2.8%. The hires rate is still tentative even if the openings are there. Layoffs were down -126K YoY or by -6.9%
The 1Q26 GDP as revised in the second estimate is off to an unimpressive start at 1.6%, which was revised down from +2.0% in the advance estimate (see GDP 1Q26 Second Estimate: Shrunk in the Dryer 5-28-26). That is not much of a tailwind. We get payroll numbers later this week.
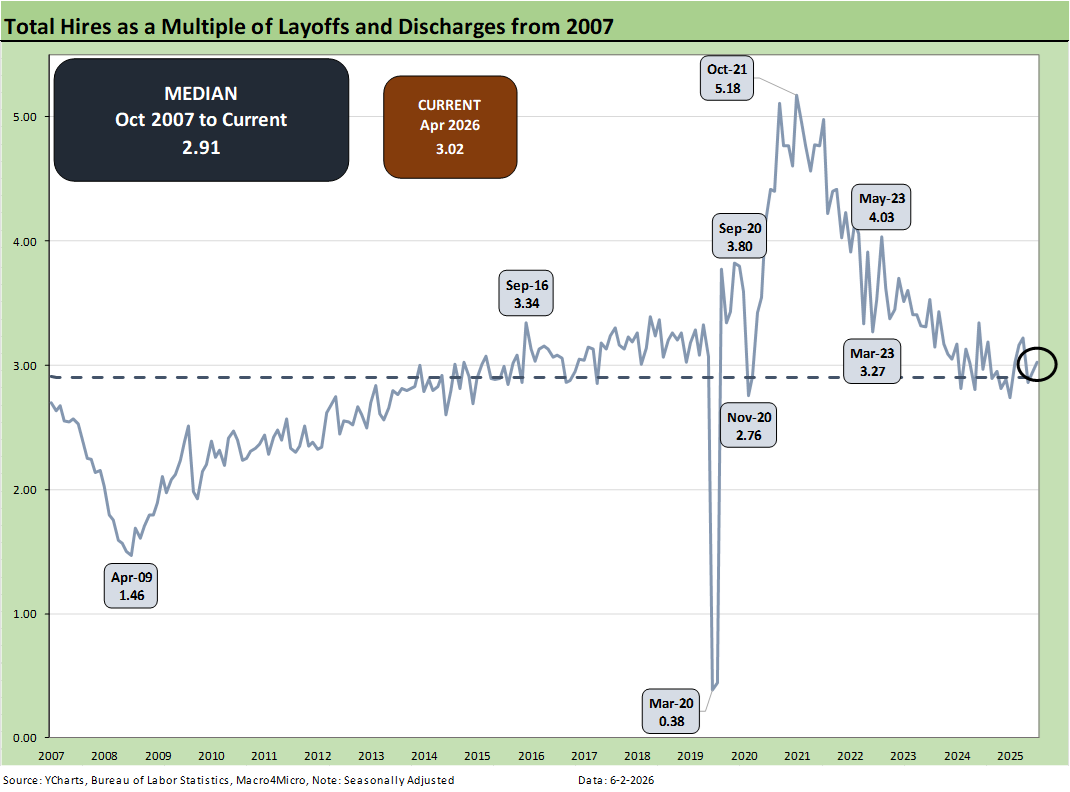
The above chart updates the ratio of Hires to Layoffs/Discharges. The relationship stands at 3.02x, above the long-term median of 2.91x from 2007. The post-2007 period includes the effects of the longest recession since the Great Depression (Dec 2007 – June 2009) followed by the longest expansion in history from June 2009 to COVID (Feb 2020), which brought a very brief 2-month recession wrapped around a wild swing in pandemic employment.
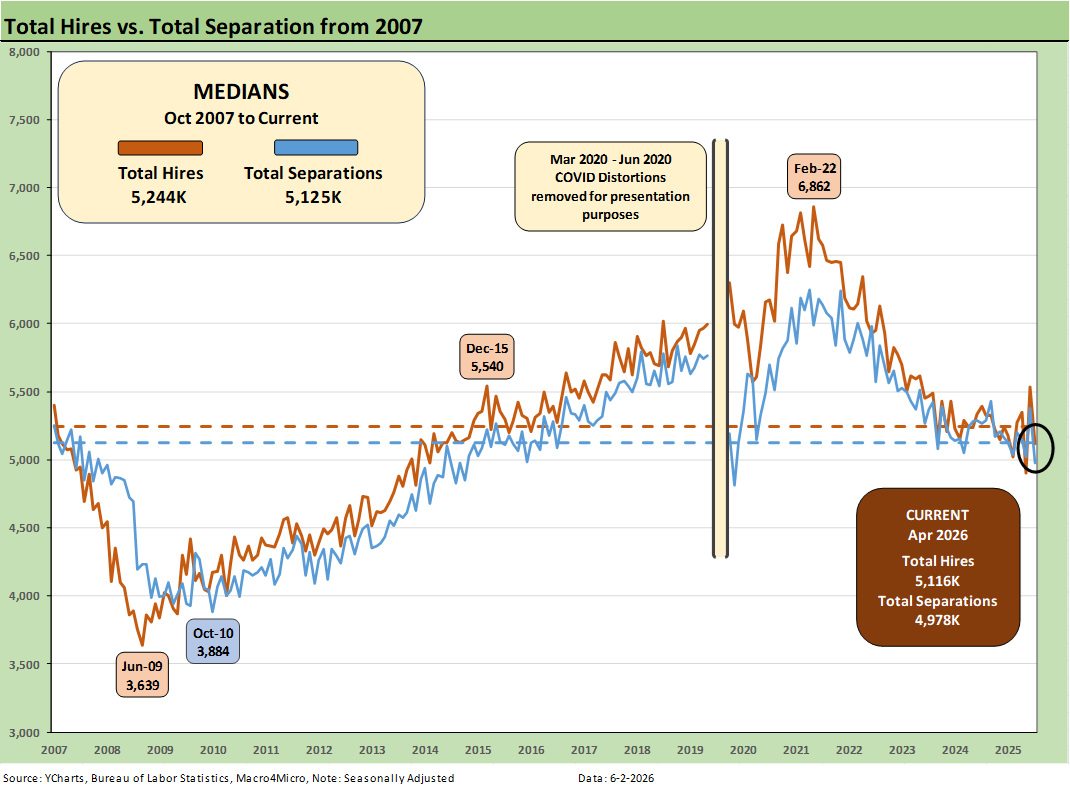
The above chart plots Hires vs. Total Separations on a SAAR basis. Separations include Quits, Layoffs/Discharges, and “Other Separations.” Total Separations declined by -399K in April 2026 vs. March 2026 and were lower by -292K YoY.
We typically do not find “Total Separations” particularly interesting as a multi-line net number. The decline in Separations can be attributed to a decline in layoffs as noted earlier and to a -183K MoM decline in “Quits.” One theory is that quits signal relative confidence in finding a job on the other side of quitting. That theory implies some nervousness right now.
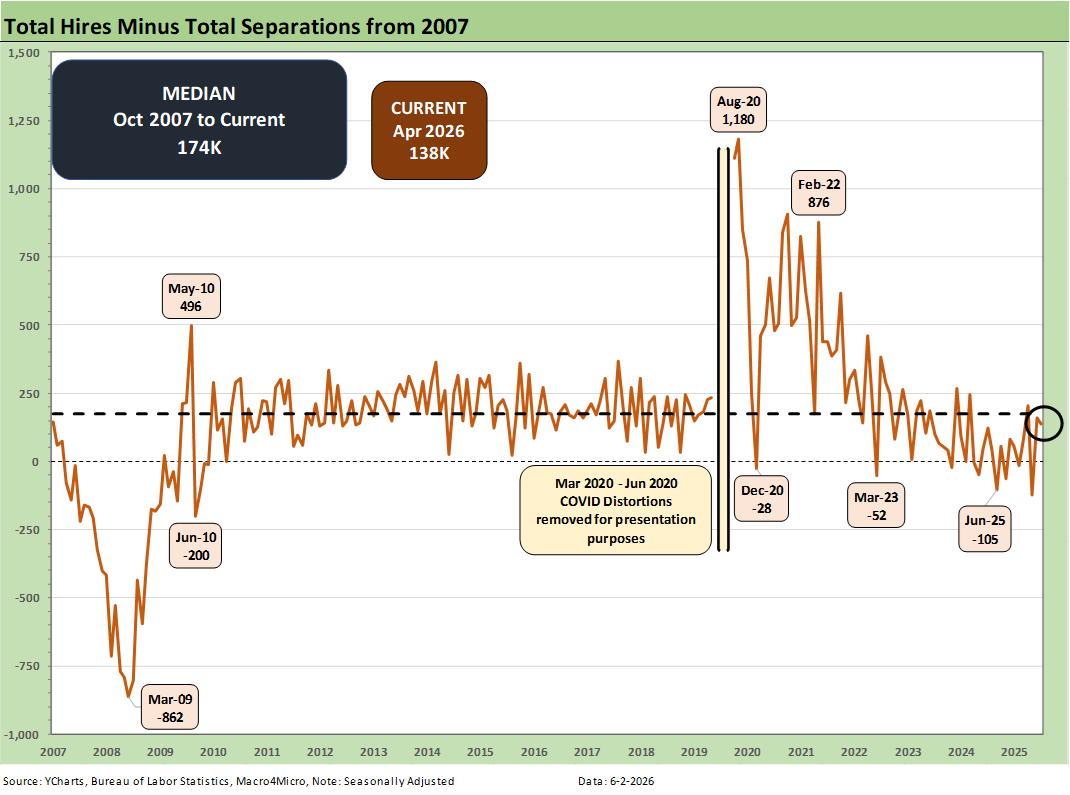
The Hires minus Total Separations differential is plotted above. As covered, the decline in Hires is material while Separations declined on lower Layoffs and lower Quits.
The net number above has moved notably lower in recent months and dipped into the negative range in Feb 2026 before bouncing back into positive range in March and April. The differential is below the long-term median of +174K.
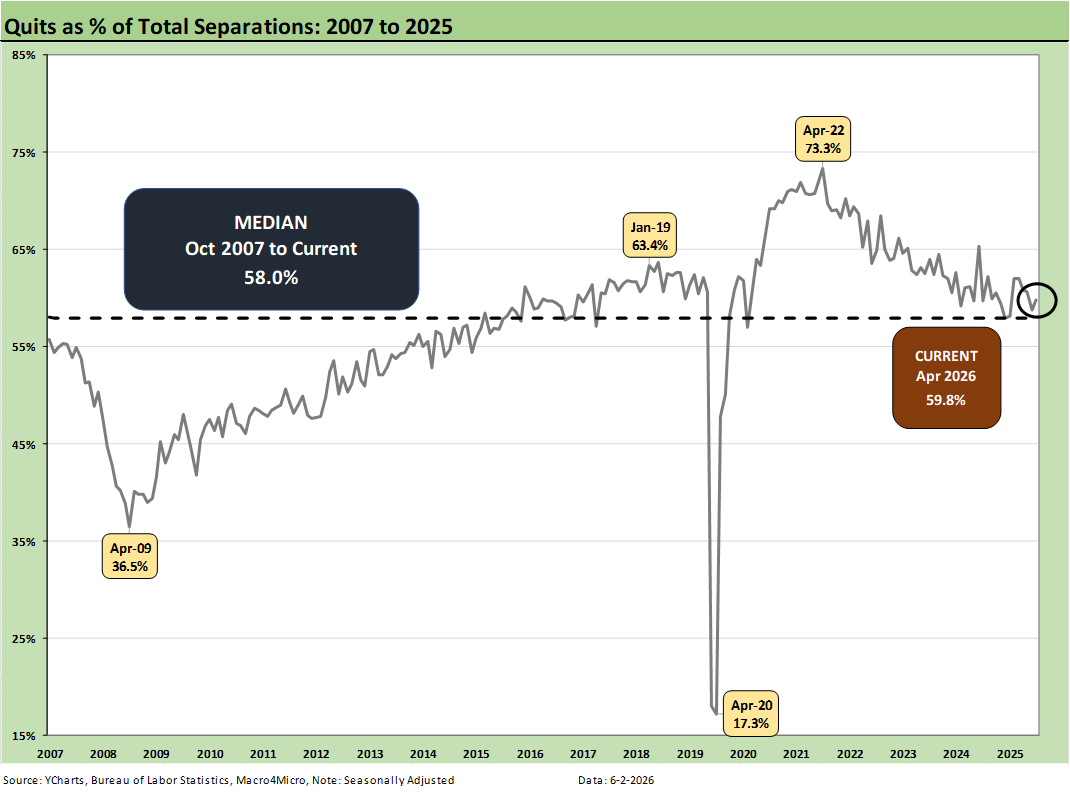
The time series for Total Quits as a % of Separations (SAAR basis) was 59.8%, slightly above the long-term median of 58.0%. The classic “Quits Rate” is measured by Total Quits as a % Total Employment, and that metric moved slightly lower on the month to +1.9%, down from 2.0% in March 2026. The Quits rate is also down YoY from 2.0% to 1.9%.
The bottom line on the JOLTS numbers for April is that it was one that UST bulls cannot use to make a case for easing, which is pretty much impossible now anyway unless you are Hassett and threw out your facts and concepts book.
The long-suffering bull flattener advocates who are already worried about oil will remain worried about oil until Iran is cleared up and the effects of the massive inventory drawdown are clear (or not) this summer.
NOTE ON COVID DISTORTIONS
The Hires vs. Separations time series make for interesting numbers but tough charts to plot visually given how much the spike in Separations/Hiring during COVID distorted the numbers from March 2020 to June 2020. The swings literally were off the charts. For presentation purposes, we adjust the charts above to exclude the raw data for those months to get a better vantage point on somewhat more normal times. Compared to COVID, the credit crisis seems “normal” in terms of the job count moves.
For disclosure purposes, Separations across March 2020 (16.3 million), April 2020 (11.6 million), May (4.7 million), and June (5.2 million) were running against Hires in March (5.2 million), April (4.0 million), May (8.1 million), and June (7.4 million). We remove those from the charts to get better scale visuals on the periods that precede and follow as the market saw 50-year lows in unemployment in 2022. Wild swings were experienced by all as industries saw shutdowns and layoffs in the COVID recession. The long-term medians from 2007 to 2022 for Hires and Separations were very close.
Almost 28 million Separations combined in March-April 2020 as a brutal reminder of that period.
See also:
Retail Signal Read Part Deux 6-1-26
Market Commentary: Asset Returns 5-31-26
New Home Sales April 2026: Slow Start to Spring 5-28-26
PCE Inflation: Income and Outlays April 2026 5-28-26
GDP 1Q26 Second Estimate: Shrunk in the Dryer 5-28-26
Retail Equity Comps: Looking for Signals 5-26-26
Housing Starts April 2026: Soft Starts in Single Family 5-22-26
D.R. Horton: Financial Powerhouse Despite Cyclical Softening 5-20-26
Taiwan: Stakes are High, US Awareness is Low 5-17-26
Industrial Production April 2026: Bringing a Lift 5-15-26
Existing Home Sales April 2026: Steady or Clinging? 5-14-26
Producer Price Index April 2026: Heat Rising on Cost Inputs 5-13-26
CPI April 2026: 4.1% All Items Less Shelter, 30Y UST 5% 5-12-26