
Footnotes & Flashbacks: State of Yields 6-1-25
The yield curve faces a lot more tariff noise ahead, budget bill headlines, and an FOMC meeting in June.

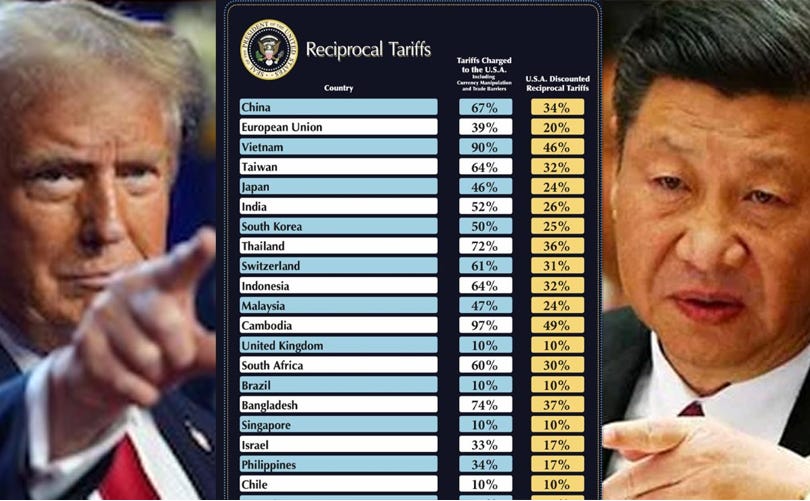
Tiny needle, big tariff threads. Courtroom action could be a knot.
The tariff conflict will get more intense this week after the Trump steel and aluminum move comes on the heels of all the “taco” back and forth. Since EU and Canada will be the main losers on this latest move, human nature could rear its head as countermeasures and retaliatory tariffs get into gear. Some trade partners may wait for more of the Section 232 decisions ahead since Trump escalation is in process.
China tension is rising again with more heated rhetoric from Trump that China “violated” the agreement from the truce. Meanwhile, Hegseth was dancing close to the fire in his Singapore speech on China’s Taiwan red line. Add in the recent moves to revoke Chinese student visas, and the China-US trade talks are not getting any easier.
We update the 3M to 5Y UST segment slopes across the cycles with the front-end inversion still a major source of contention between Trump and the FOMC.
The Big Beautiful Bill now in front of the Senate will generate a lot of headlines around US systemic sovereign debt risk at a time when US currency trends and UST steepening have not made life easy for the UST sales pitch.
This week we get JOLTS and payroll, but the tariff transaction lag effects are not anywhere near peaking with so many major Section 232 actions ahead and an eventual SCOTUS date on Trump latitude in reciprocal tariffs under the IEEPA. The transaction level realities will keep inflation fears on edge until we either see lower earnings (eating part of tariff costs) or higher prices (pass-throughs of tariff costs in part or in whole).
Below we update our rolling UST State of Yield commentaries with related chart updates.
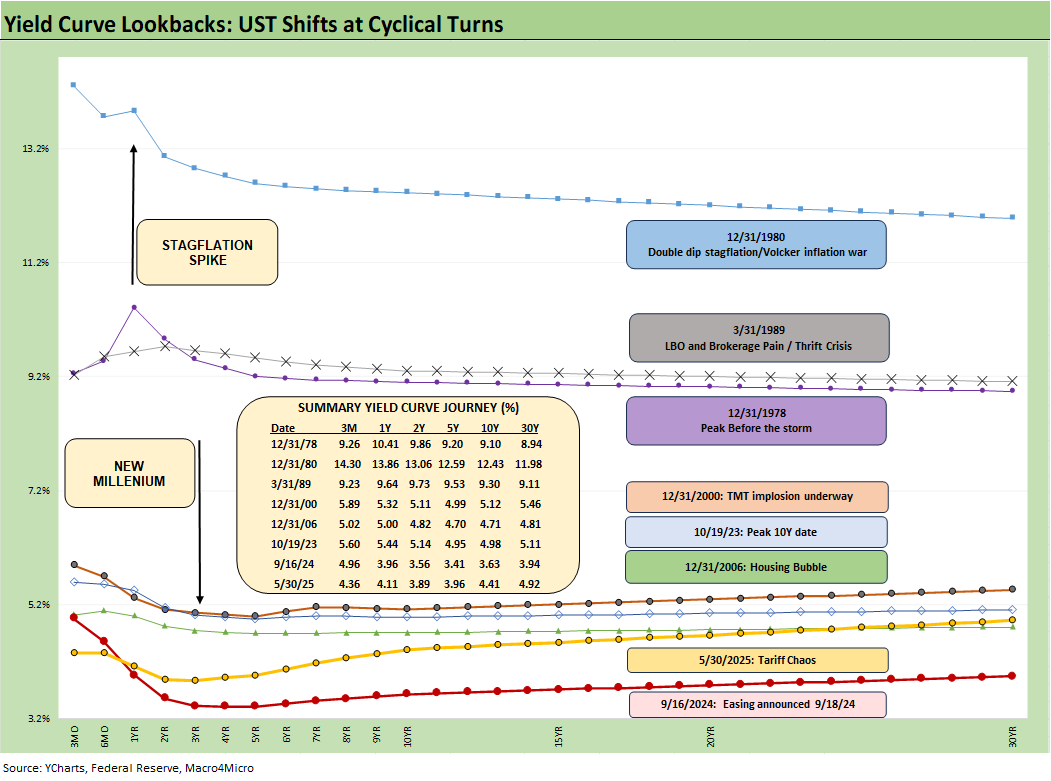
The above chart plots some key cyclical transition periods from the Carter inversion of 1978 across the Volcker years, the credit cycle peak in 1989, the TMT cycle faltering in 2000, and the housing bubble in 2006. The chart then jumps from 2006 to 2023 beyond the crisis period and the ZIRP years when the market saw QE and normalization distortions.
The bullish view for 2025 is that rates are very low today in the context of the pre-ZIRP years. Periods before 2007 had much higher rates and the cycles shown presented a mix of severe cyclical downturns and gut-wrenching changes in the structure of the US economy across time. The move from the post-Vietnam inflation and oil price shocks of the early 1970s culminated in a brutal double dip recession (1980-1982) and a scarring experience with stagflation (see UST Moves 1978-1982: The Inflation and Stagflation Years 10-18-23).
The stagflation of 1980-1982 eventually flowed into the Reagan boom years. Then came a fresh bout of risk-taking excess (1989 credit cycle peak, 1990 recession) during the Clinton years with those impressive bull markets. Those were superior economic performances under Reagan and Clinton – by a wide margin - and well ahead of those seen since 2000 (see Trump's “Greatest Economy in History”: Not Even Close 3-5-25, Presidential GDP Dance Off: Clinton vs. Trump 7-27-24, Presidential GDP Dance Off: Reagan vs. Trump 7-27-24).
The post-1990 Greenspan policies and what followed with the post-TMT FOMC support changed the rules of the game. The 9.2% 3M UST ahead of the credit cycle peak in late 1989 (recession started 7/90) was in a different zip code for absolute rates. Late 1989 saw bridge loan stress and an HY market meltdown into 1990. The changing yield curve profile is underscored by the 5% handle 3M UST at peaks in 2000 and 2006 and in 2023. The George HW transition years were tough (see UST Moves: 1988-1989 Credit Cycle Swoon 10-20-23).
We see asset bubbles pop (2001, 2007) and even a pandemic (not shown above). Greenspan’s FOMC reactions to the post-TMT bubble support in 2001 became a bigger problem with the next period of excess that led to 2007 (see Greenspan’s Last Hurrah: His Wild Finish Before the Crisis 10-30-22).
The US markets always came back strong even if the post-Clinton years from Bush to Obama to Trump condemned the US to “slow and low” growth with high systemic UST debt. Those decades are still a story of remarkable resilience in capital markets, but it all started with a balanced budget under Clinton and a GOP Congress and that now elusive concept of bipartisanship. You won’t see either of those again in a very long time (true bipartisanship and a balanced budget).
The time-honored “up and to the right” history can keep optimists in the game now, but the combined state of the US sovereign balance sheet, global trade war threats, and authoritarian ambitions are new elements. We should note that the markets have occasionally posted long stretches of time when equities materially unperformed history (2000 to 2009 with a bubble in-between). The 2008-2009 crisis brought the years when ZIRP and QE became major distorting factors.
If you buy into the themes of “This Time is Different,” high systemic debt levels assure low and slow GDP growth. Tariffs contribute to eroding consumer purchasing power for goods and weak growth.
As noted in the chart above, we use the Oct 2023 UST peak date on the 10Y UST as a key frame of reference. The UST rates now are very low by any historical standard but well above the Sept 2024 lows as we lifted off from the initial easing into another steepener.
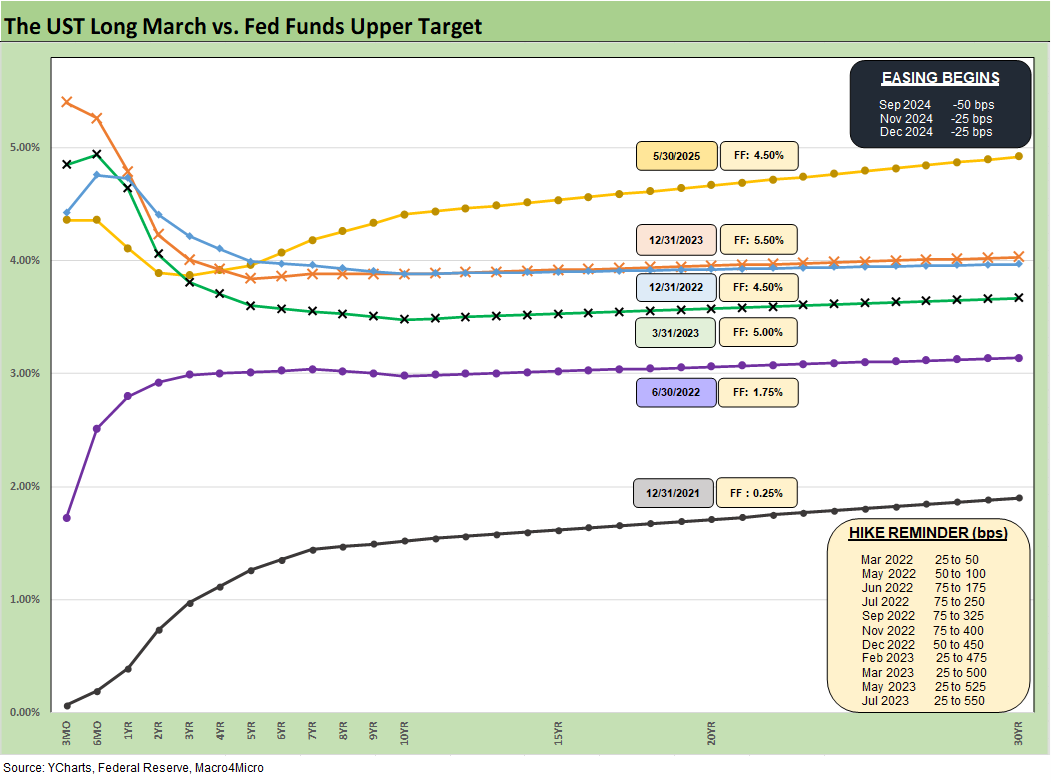
The above replays our weekly chart detailing the migration of the UST curve from 12-31-21 with memory boxes detailing the tightening dates and magnitude and more recently the easing. The UST curve seems to intermittently mix bear steepening patterns and flattening rallies since the Sept 2024 lows, but market fear was creeping into the shapeshifting after Liberation Day before calming down with the pause.
We shifted back into the bear steepening before this week’s rally as we detail in other charts below. The UST curve will not be helped by record supply and shrinking demand, fears around the dollar, and diminished confidence in US governance. We are looking at the highest risk of stagflation since the 1980-1982 double dip and tariffs will certainly not help.
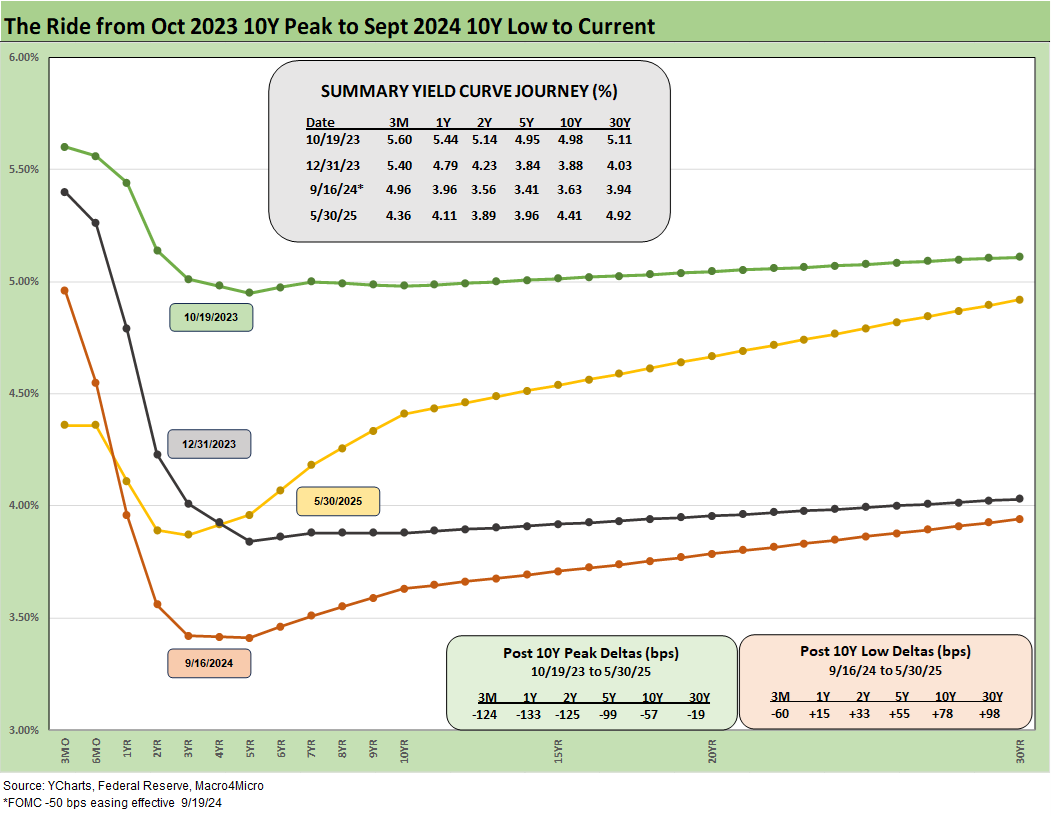
The above chart details the material move from the peak UST curve of 10-19-23 down into the UST bull rally of Nov-Dec 2023 and then eventually into the lows of Sept 2024. The Sept 2024 low tick only came after a bear steepener hit the curve through the summer of 2024. We then moved back into the bear steepener mode until the tariffs roiled the UST markets and initially sent 2Y to 30Y lower on cyclical fears.
The shift higher from Sept 2024 lows and the steepening from the low point at the end of 2023 is in the chart. We see the 10Y and 30Y notably higher with a more normal shape from 2Y out to 30Y. The challenge is still that front end inversion from 3M. This week we look at the 3M to 5Y UST slope history further below. The inversion anomaly during a protracted extension has been hard to shake with the FOMC holding the line over tariff related inflation questions.
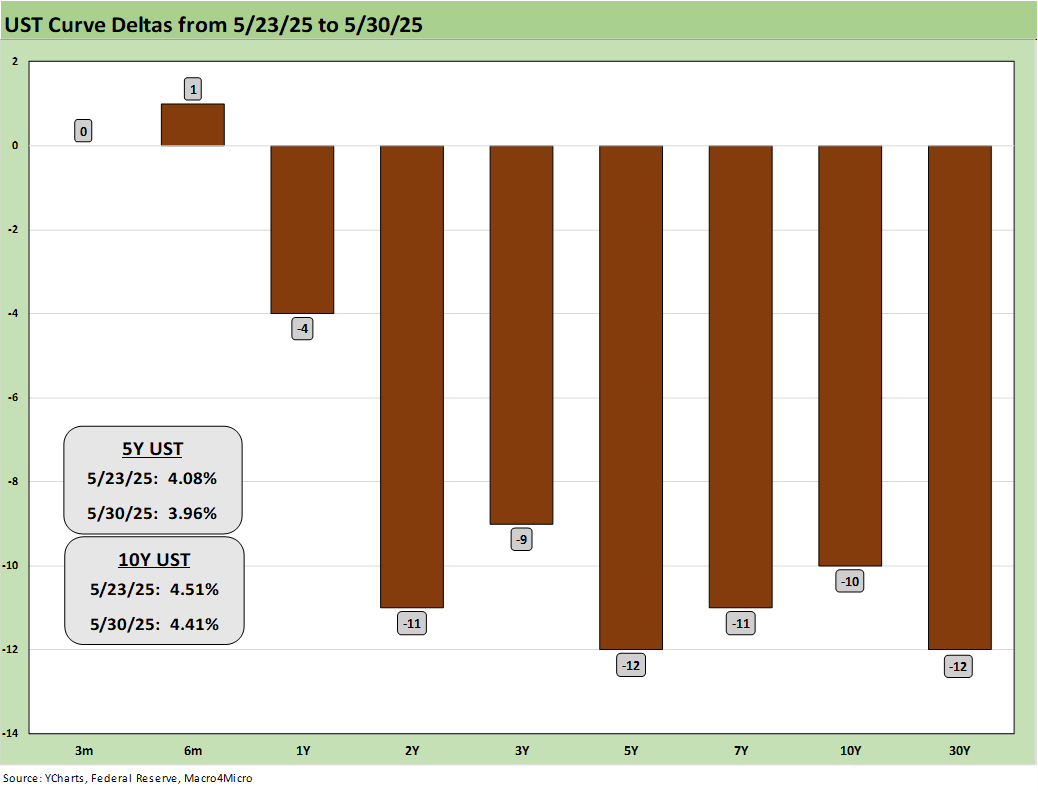
The above breaks out the weekly UST deltas that we already looked at in Mini Market Lookback: Out of Tacos, Tariff Man Returns 5-31-25. The week featured a rally but ended on a challenging note late Friday with another round of massive tariff threats on steel and aluminum in what will be perceived as a direct attack on Canada and the EU.
Meanwhile, the Big Beautiful Bill will open up a lot more debate this week with extreme positions taken on how threatening the systemic sovereign debt position could be in the future. The comments will be justified in many cases, but they also will draw a lot of attention around the world when coming from Washington.
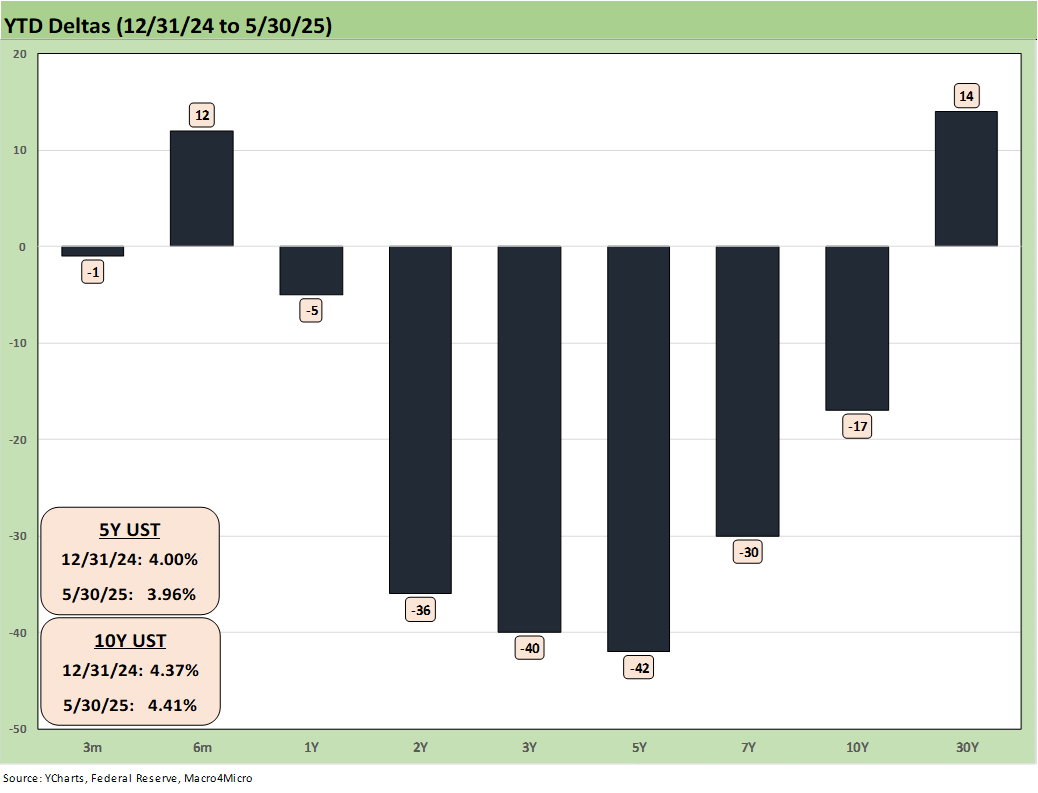
The YTD UST deltas are broken out above. We still see a rally from 2Y to 10Y, but the 30Y relationship has been breaking down in recent weeks. As noted in our separate asset returns Footnotes publications, we saw all 7 of the 7 bond ETFs we track in positive range YTD (see Footnotes & Flashbacks: Asset Returns 6-1-25). The UST ETF (GOVT) and long duration UST (TLT) was barely positive.
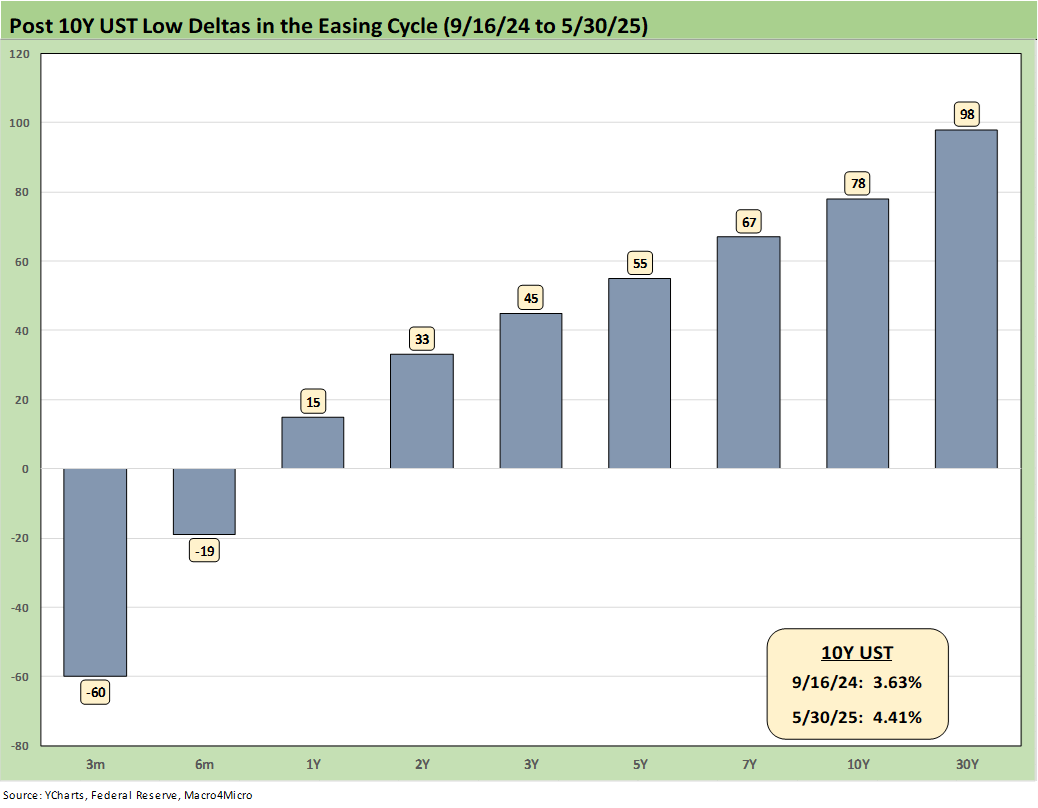
The above chart updates the UST deltas since the 9-16-24 lows that came alongside the easing. That has not worked as many market watchers predicted on the shape of the UST curve and number and pace of easing that was supposed to follow. While Trump rails at the Fed and Powell, the FOMC would likely be easing if it was not for Trump’s over-the-top and unprecedented tariff game plan.
The risks of an early move without clarity on the final tariff plan and some market-based data could be very costly by compounding the problem and leaving the Fed facing inflation and stagnant growth. The politics of tariffs is one challenge, but the fact remains that this tariff strategy has never been tried in the postwar era or in modern capital markets. That leaves confidence low and market risks high.
While Trump highlights low inflation during Trump 1.0 when the post-crisis markets featured ZIRP for a few years (until Dec 2015) and oil collapsed during a Saudi market share war before it all gave way to a pandemic, that does not change the fact that 2018 was a brutally bad year for asset returns, capex was dialed back into 2019 and the Fed eased in 2H19. The tariffs back then were low, narrowly targeted and still struggled to work (see Histories: Asset Return Journey from 2016 to 2023 1-21-24). What is unfolding today in tariffs is on a different planet in scale and in a global economy that featured global supplier chains fashioned over decades.
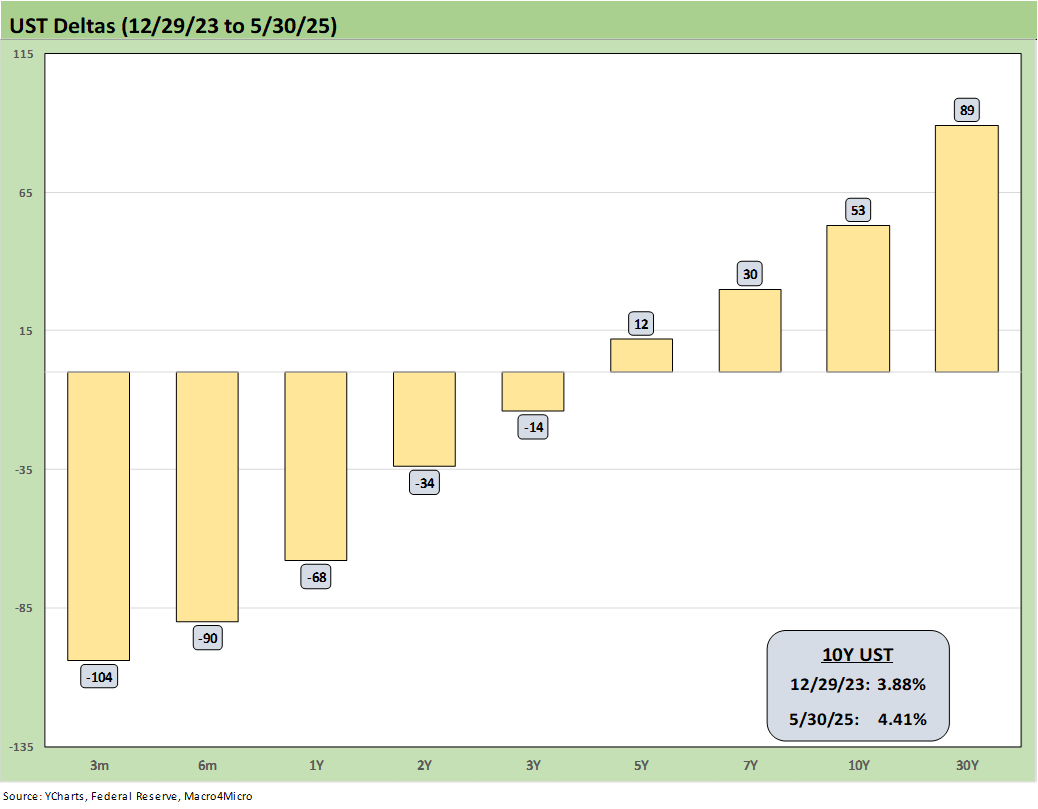
The above chart updates the UST deltas from the end of 2023 after a massive rally in rates and risk in Nov-Dec 2023. The follow-on in 2024 expected by the consensus mildly disappointed the UST bulls in the number of FOMC cuts (we did see 4 but not the 5 to 6 that had been expected). The pronounced bull flattening during 2024 did not play out as expected when a bear steepener prevailed by the end of the year.
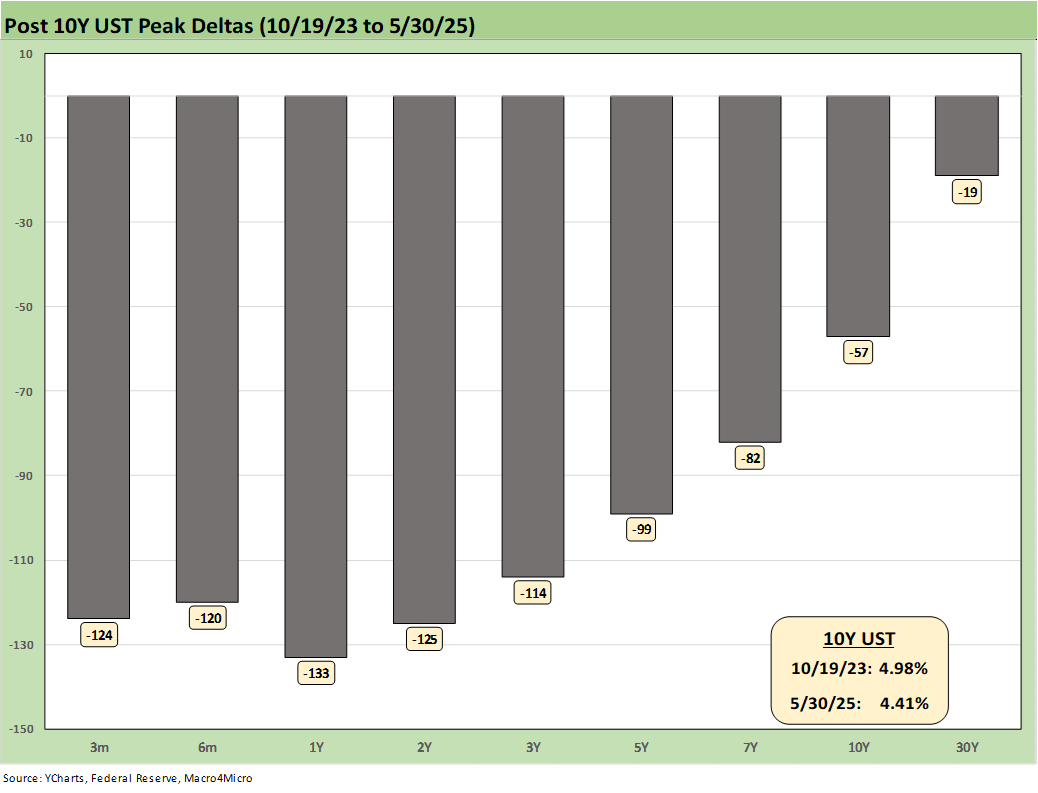
The above chart updates the running UST deltas from the 10-19-23 peak date of the UST 10Y when it barely missed the 5.0% line. For those looking for a frame of reference on what a bad move in inflation metrics might mean, these deltas at least offer a recent set of data points during an inflation fighting year such as late 2023 and into 2024 (until Sept 2024 began the easing process). That is why we keep revisiting that timeline. It reminds us what reversion could mean.
These rally deltas could reverse in part or in whole with the wrong inflation outcomes. We don’t need to see 2022 again, but the old saying “It happened before, it can happen again” resonates for many.
Losing a rally of -57 bps in the 10Y UST above would hurt the mortgage market and would lead to a material valuation headache in equities, M&A economics, and capital project planning. Mortgages have been a drag on housing (new and existing home sales). The risk of inflation heading the wrong way would do more damage. Stubborn rates or higher rates in the short end to 5Y would damage consumer durables financing and related volumes.
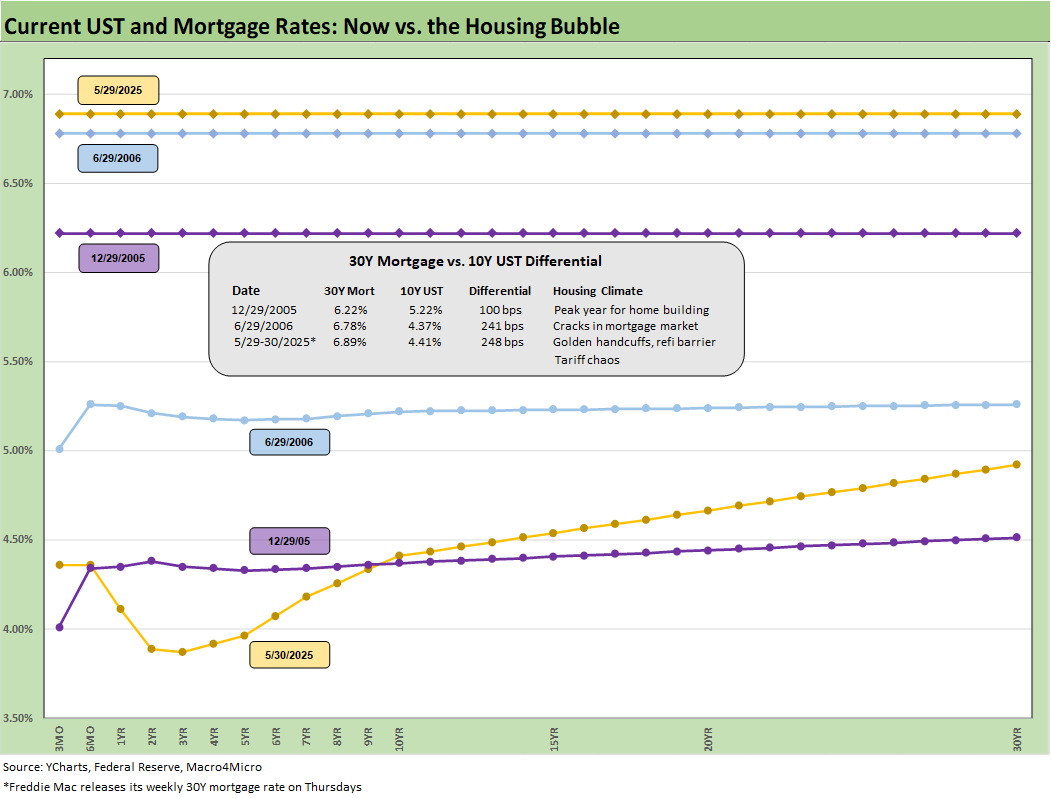
The above chart is one of those replay slides we update each week. This one posts the UST curve for this past Friday and the Freddie Mac 30Y Mortgage benchmark rate (noon Thursday release). We include two useful historical periods including the peak homebuilder year end of 2005 and mid-2006 when RMBS quality concerns were catching headlines as the housing bubble was peaking.
We post UST curves for each period in the chart. The past week saw rates move higher to 6.89% from 6.86% the prior week (and from 6.81% the week before that). The Mortgage News Daily survey ended Friday at +6.95%.
We include a column above detailing the differential between the Freddie Mac 30Y and the 10Y UST. That differential moved higher this week to +248 bps from +235 bps. The year 2005 posted a differential of only +100 bps and makes a statement on what the mortgage market was like in 2005. The mortgage market was very hot back then in the housing bubble as mortgage volumes soared during that peak homebuilding year and a very busy period of refinancing was running alongside as a source of funds for homeowners.
RMBS had run wild and risk senses were dulled. The history of that era is one for the record books and time-stamped with a consumer credit meltdown and systemic bank crisis.
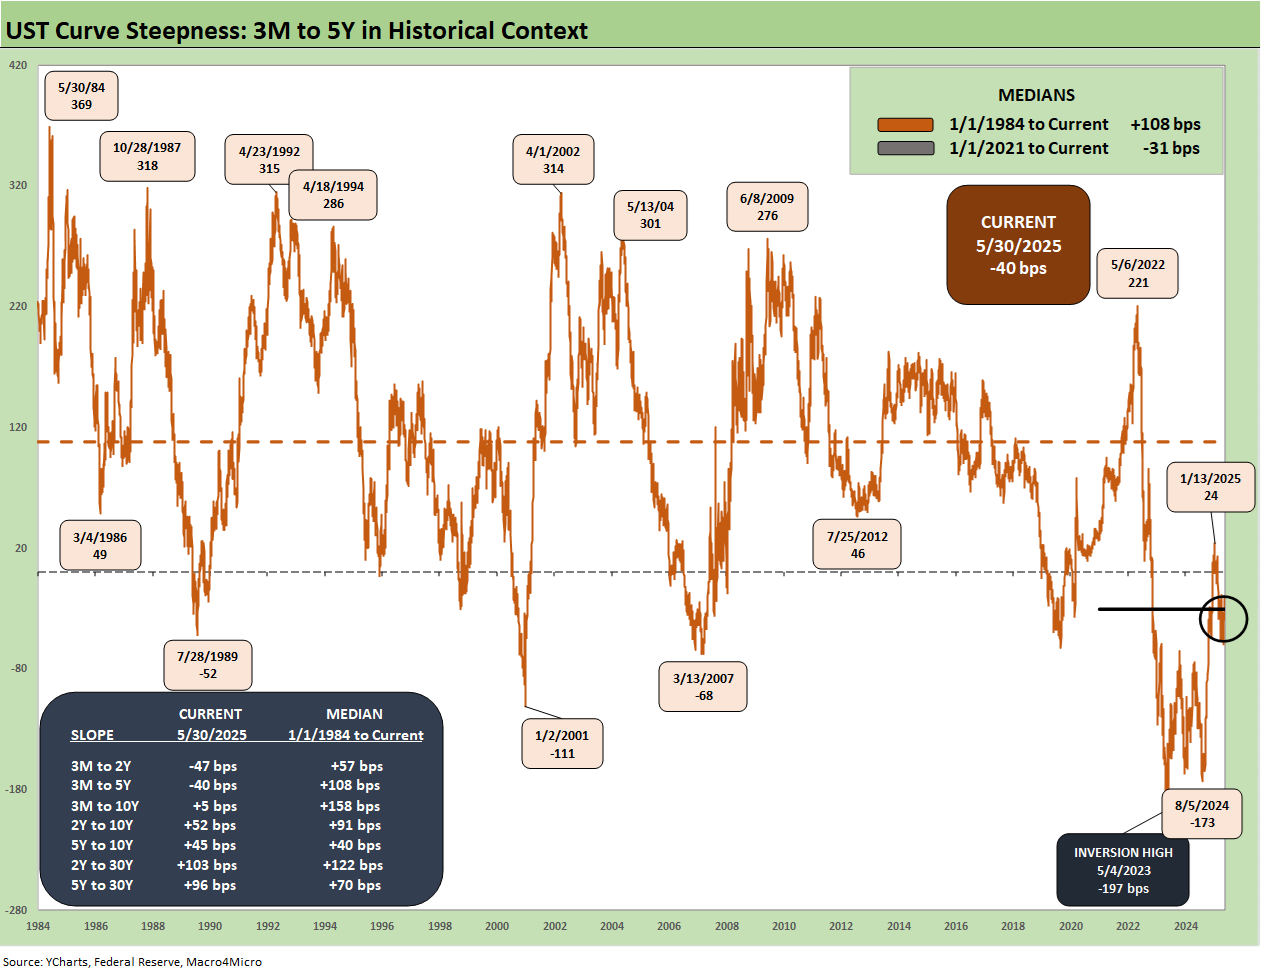
We update the 3M to 5Y inversion this week that currently stands at -40 bps vs. the long-term median upward slope of +108 bps. We also post the long-term medians for the other slopes we watch in the box. On a separate note, the 3M to 10Y slope is at +5 bps vs. a long-term median of +158 bps. That implies that “normal” could come from lower short rates and higher intermediate.
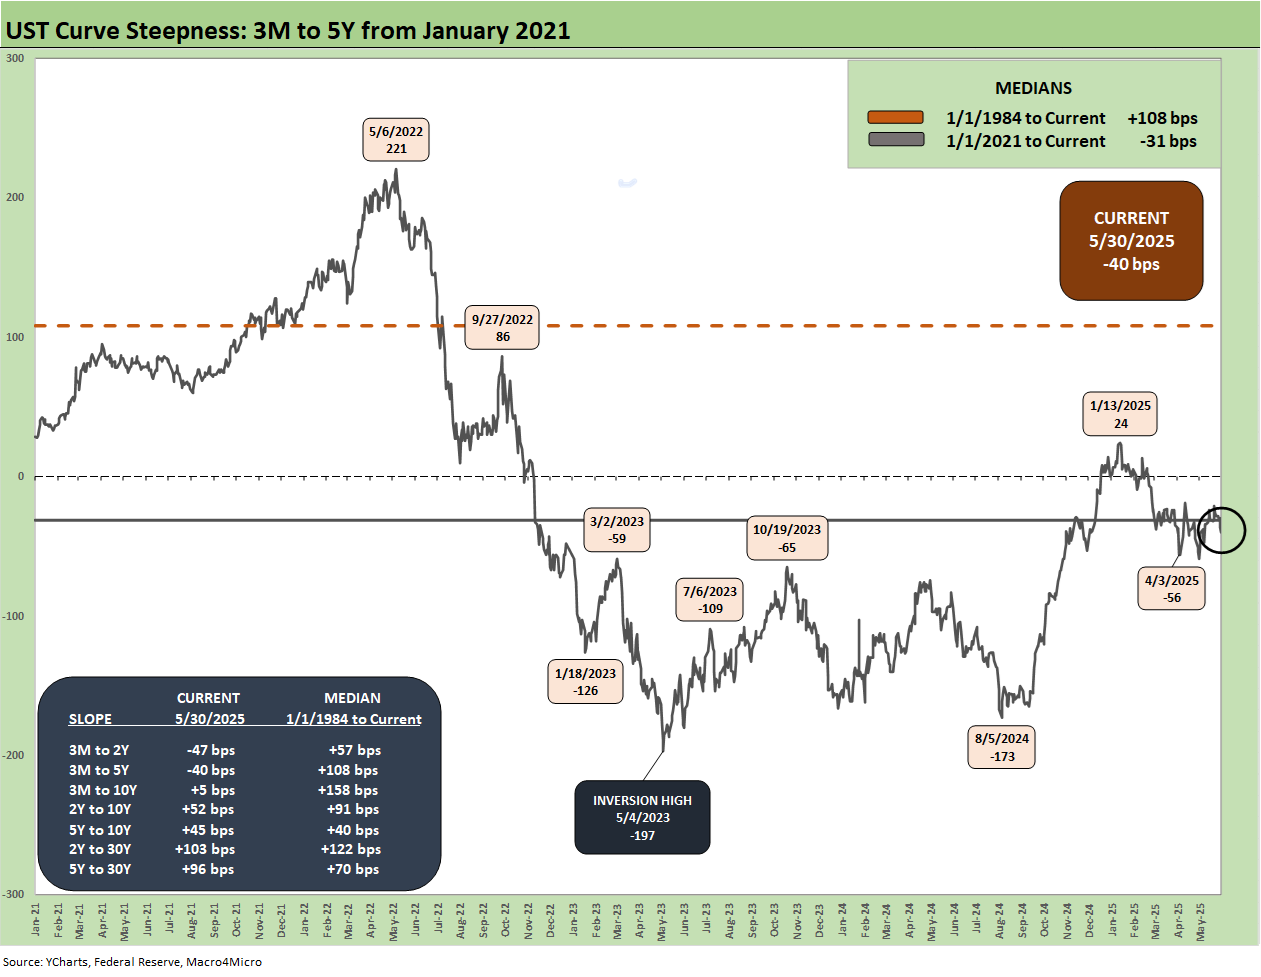
The above chart shortens the 3M to 5Y timeline from the start of 2021 during ZIRP. We see the steepening to +221 bps in May 2022 and then down to a peak inversion in May 2023 at -197 bps.
The current -40 bps presents a front-end inversion that is still not normal but that would also describe a range of inflation fighting experiences including the strangest stretch of inflation and monetary policy shifts back in 1980-1982. The 2022 inflation experience was the first one since that early 1980s period.
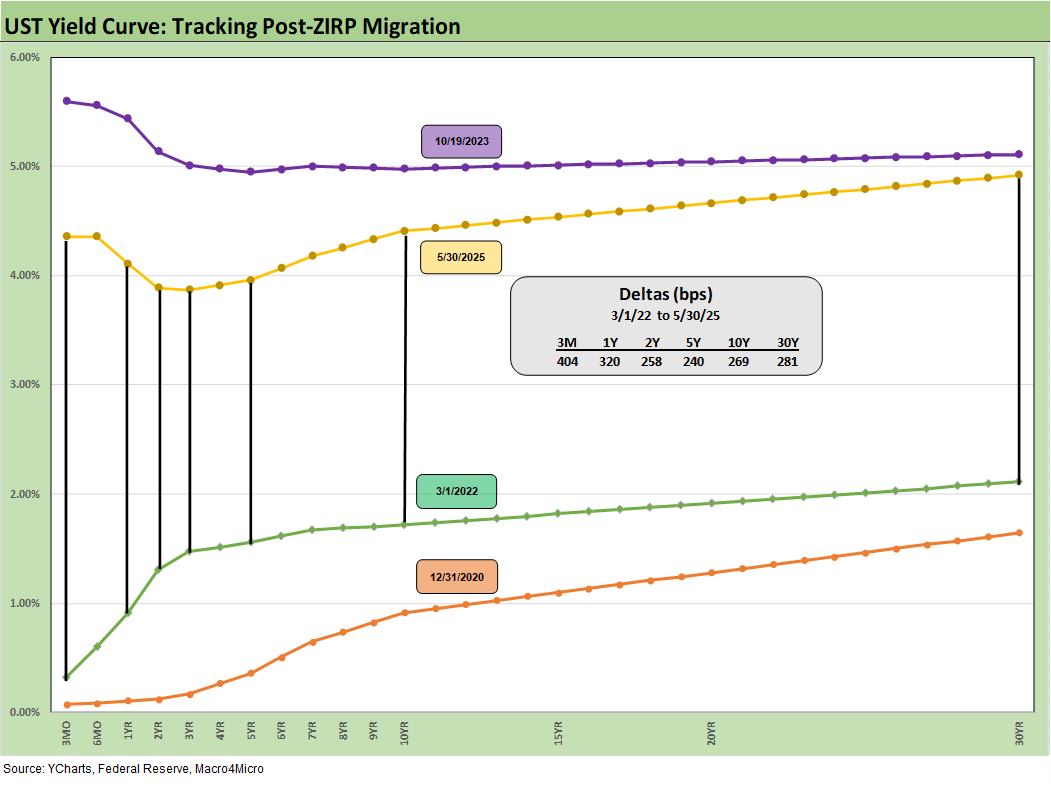
We wrap this week’s State of Yields with an update of the running UST deltas since March 1, 2022 just ahead of the end of ZIRP (effective 3-17-22). We include the 12-31-20 UST curve and 10-19-23 peak UST curve as frames of reference.
See also:
Footnotes & Flashbacks: Asset Returns 6-1-25
Mini Market Lookback: Out of Tacos, Tariff Man Returns 5-31-25
PCE April 2025: Personal Income and Outlays 5-30-25
Credit Snapshot: Meritage Homes (MTH) 5-30-24
1Q25 GDP 2nd Estimate: Tariff and Courthouse Waiting Game 5-29-25
Homebuilder Rankings: Volumes, Market Caps, ASPs 5-28-25
Durable Goods Apr25: Hitting an Air Pocket 5-27-25
Footnotes & Flashbacks: Credit Markets 5-27-25
Footnotes & Flashbacks: State of Yields 5-25-25
Footnotes & Flashbacks: Asset Returns 5-25-25
Mini Market Lookback: Tariff Excess N+1 5-24-25
New Home Sales April 2025: Waiting Game Does Not Help 5-23-25
Existing Home Sales April 2025: Soft but Steady 5-22-25
Credit Snapshot: Lithia Motors (LAD) 5-20-25
Home Starts April 2025: Metrics Show Wear and Tear 5-19-25
Footnotes & Flashbacks: Credit Markets 5-19-25
Industrial Production April 2025: CapUte Mixed but Time Will Tell 5-15-25