
Footnotes & Flashbacks: Asset Returns 6-1-25
We look at a rally for debt and equity that will run into some serious tariff tension dead ahead and a budget bill with major holes.


Tighter spreads and a favorable UST downshift made for a good week in bonds while equities rallied despite tepid economic indicators signaling consumer weakness and a mixed picture on corporate investment. We see a lot more tariff tension to challenge capital budgeting ahead after Friday’s late-week actions on steel and aluminum and some caustic exchanges with China.
All the major US equity benchmarks were in the green and 10 of 11 S&P 500 sectors were positive with only Energy slightly in the red. Bonds rallied but volatility has become the norm.
The latest tariff whipsaws may continue in court, but the move to 50% tariffs on steel and aluminum could tie into Trump game theory messaging for bigger challenges ahead on Pharma, Semis, and Aircraft/Engines/Parts – among others – where stakes are extremely high with the EU and Asia.
This coming week will see the follow-through from trade partners on the massive increase in the steel and aluminum tariffs, some more court drama on tariffs, and the start of Senate reactions to a bill nicknamed “BBB” (for “Big Beautiful Bill,” hopefully not the future sovereign debt rating of the US to match Italy).
Payroll numbers and JOLTs will keep the data input flowing as the market awaits the reciprocal tariff outcome from the court challenge and/or the levels that Trump indicated he could unilaterally assign soon. We will also get the more detailed International Trade data this week after the preliminary data showed a massive drop in imports after the pre-tariff of import wave of 1Q25 to beat the clock.
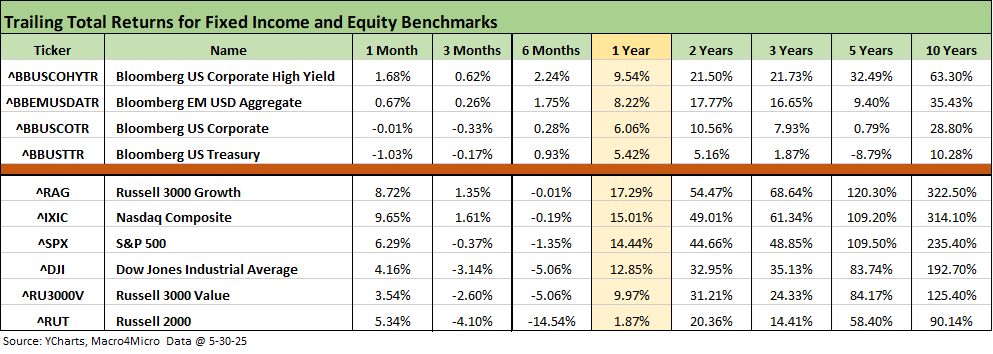
The above table updates the trailing time horizon returns for the high-level debt and equity benchmarks we update each week. We see the banner month posted in equities in the aftermath of the reciprocal pause and the China truce. Debt asset lines had more of a struggle with more volatility this past spring along the UST curve and the relationship of the dollar and UST yields breaking down as covered in earlier commentaries (see Mini Market Lookback: Trade’s Big Bang 4-12-25).
Japan headlines on duration risk and sovereign debt risk has not helped US sentiment while the Big Beautiful Bill is hurting US sovereign credit quality metrics. While the loss of the last Aaa was a big headline, the reality is that UST debt % GDP is gaining on Italy (a BBB tier sovereign). Objective debt metrics and exploding deficits and record supply needs are not helping the Golden Age “sale pitch.” Confidence in the US dollar and risk-free nature of UST is facing some question marks, and the very inarticulate policy dialogue and trade hostility eats into the faith of many offshore investors who have to worry about both UST supply risk and dollar weakness.
The May 2025 vs. May 1990 headlines…
The recent banner headline for May 2025 of “the best May since 1990” has its limits. After all, May 1990 gave way to a 2H90 meltdown that included the recession start date in July 1990 before life got even worse with the Aug 1990 invasion of Kuwait by Iraq, a spike in oil, plunging consumer confidence, and sustained asset quality problems at major banks (notably Citibank). We looked at those periods in earlier commentaries (see UST Moves: The 1990-1991 Risk Factor Pig Pile 10-24-23).
The good news for the May 2025 vs. May 1990 comparison is that the credit markets had already cracked in 1989 with bridge loan stress and poor performance at securities firms in the Glass Steagall years. Numerous brokers had imploded into 1990 (Drexel Chapter 11) and were bailed out (including my employer at the time, Shearson Lehman). Bellwether investment banks of the time such as First Boston and Kidder were rescued.
Those brokers and some of the weak banks of yesteryear are gone or were radically overhauled after 2008. The post-Dodd-Frank, post-Volcker Rule banks of 2025 are much healthier. Fears of credit contraction are much lower as highlighted by the explosion in credit funds under management whether in private credit or the record scale of IG bonds outstanding at a material multiple of 2007. We also have the eurozone credit markets that were not around back in 1990.
The rolling return visual
In the next section, we get into the details of the 32 ETFs and benchmarks for a mix of trailing periods. Below we offer a condensed 4-chart view for an easy visual on how the mix of positive vs. negative returns shape up. This is a useful exercise we do each week looking for signals across industry groups and asset classes.
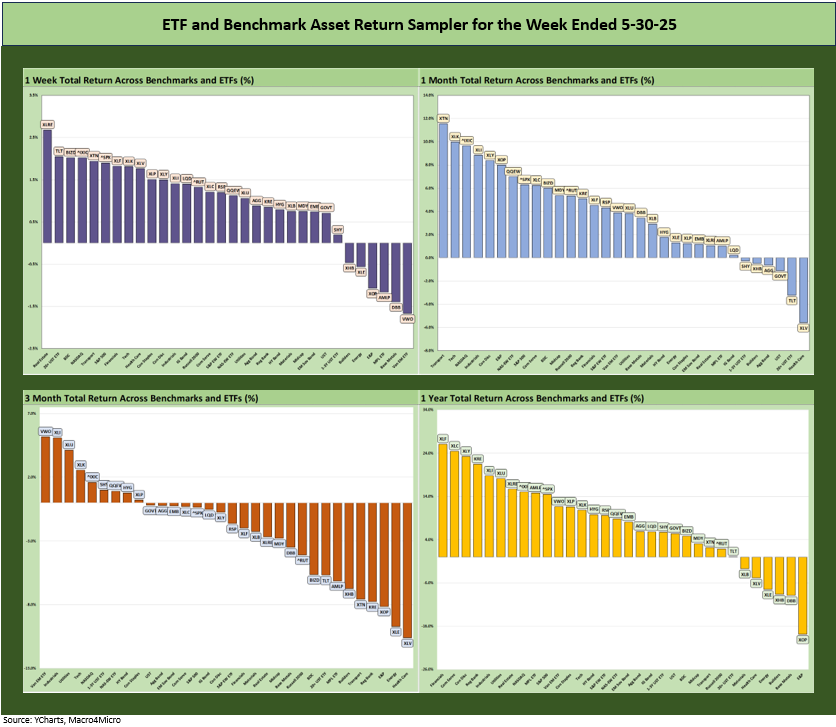
The performance symmetry above highlights the strong 1-week and 1-month positive vs. negative score as detailed in charts further below. In contrast, the 3-month score at 9-23 makes a statement.
We also post a YTD chart below (not shown above) that weighs in at a relatively more balanced 19-13 with the good start to the year. That was before tariffs and UST supply anxiety spiked up, a steepening curve unfolded on the long end, massive deficits in the budget bill and before a weaker dollar and challenging rollout of the IEEPA tariffs (“reciprocal tariffs”) raised a lot of concerns both onshore and offshore (see Reciprocal Tariff Math: Hocus Pocus 4-3-25, Reciprocal Tariffs: Weird Science Blows up the Lab 4-2-25).
The Magnificent 7 heavy ETFs…
Some of the benchmarks and industry ETFs we include have issuer concentration elements that leave them wagged by a few names. When looking across some of the bellwether industry and subsector ETFs in the rankings, it is good to keep in mind which narrow ETFs (vs. broad market benchmarks) get wagged more by the “Magnificent 7” including Consumer Discretionary (XLY) with Amazon and Tesla, Tech (XLK) with Microsoft, Apple, and NVIDIA, and Communications Services (XLC) with Alphabet and Meta.
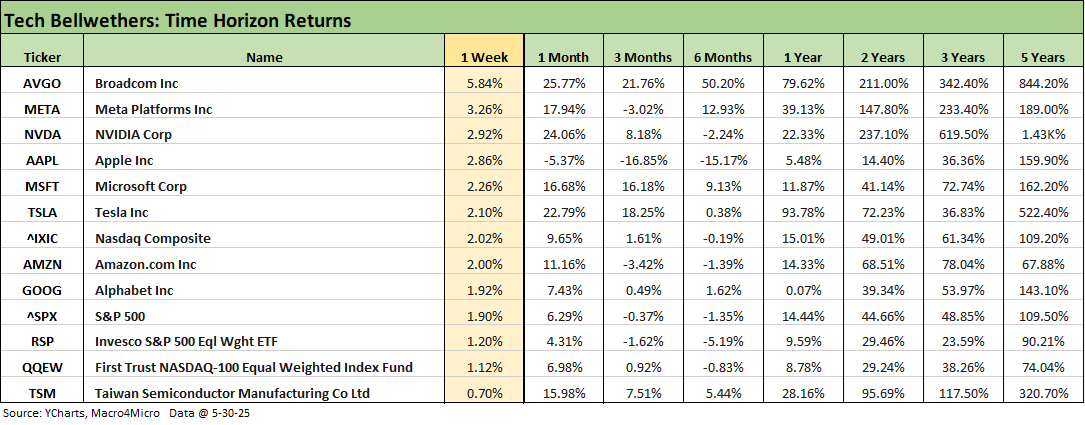
We already looked at the performance of tech bellwethers in Mini Market Lookback: Out of Tacos, Tariff Man Returns (5-31-25). NVIDIA earnings were solid and did not wag the number much and Trump left Apple alone this week. The Big Beautiful Bill unleashes freedom for AI and puts a check on states charting their own course, so that will make for some upcoming headlines and political debate.
As much as politics is an unpleasant topic and was generally verboten on Wall Street just as it was in our “street years” as a topic, the reality is that politics = policy = economics however you want to look at it. If the Progressives were at the helm executing on low growth policies and putting the macro story at risk, they would face the heat. For now, we have tariffs that are the main event. Since 2000, both parties have been driving the budget deficits and UST backdrop into the realm of the US having a riskier sovereign credit profile (see US Debt % GDP: Raiders of the Lost Treasury 5-29-23). US sovereign systemic debt might dominate the 2026 debate. For now, it is tariffs at #1 and UST supply #2.
In the narrow case of tech, higher rates are supposed to hurt valuation math on the long-term growth story lines and vagaries of discount rates used by analysts. We were never a fan of the term “long duration equities,” but higher rates and a steeper curve will be factors.
In contrast, the tariff issues will also loom large for tech in the months ahead since tech is on the EU target list with their anti-coercion instrument defense. The semiconductor Section 232 process and the attacks on Asian imports could also roil valuations in tech bellwethers for many obvious reasons. Trade wars lead trade partners to target US strengths in the global markets. That will be a risk factor to watch. Agriculture and tech are the two top strengths of the US. Tariffs are often more associated with goods, but services are now in the game also as trade battles escalate.
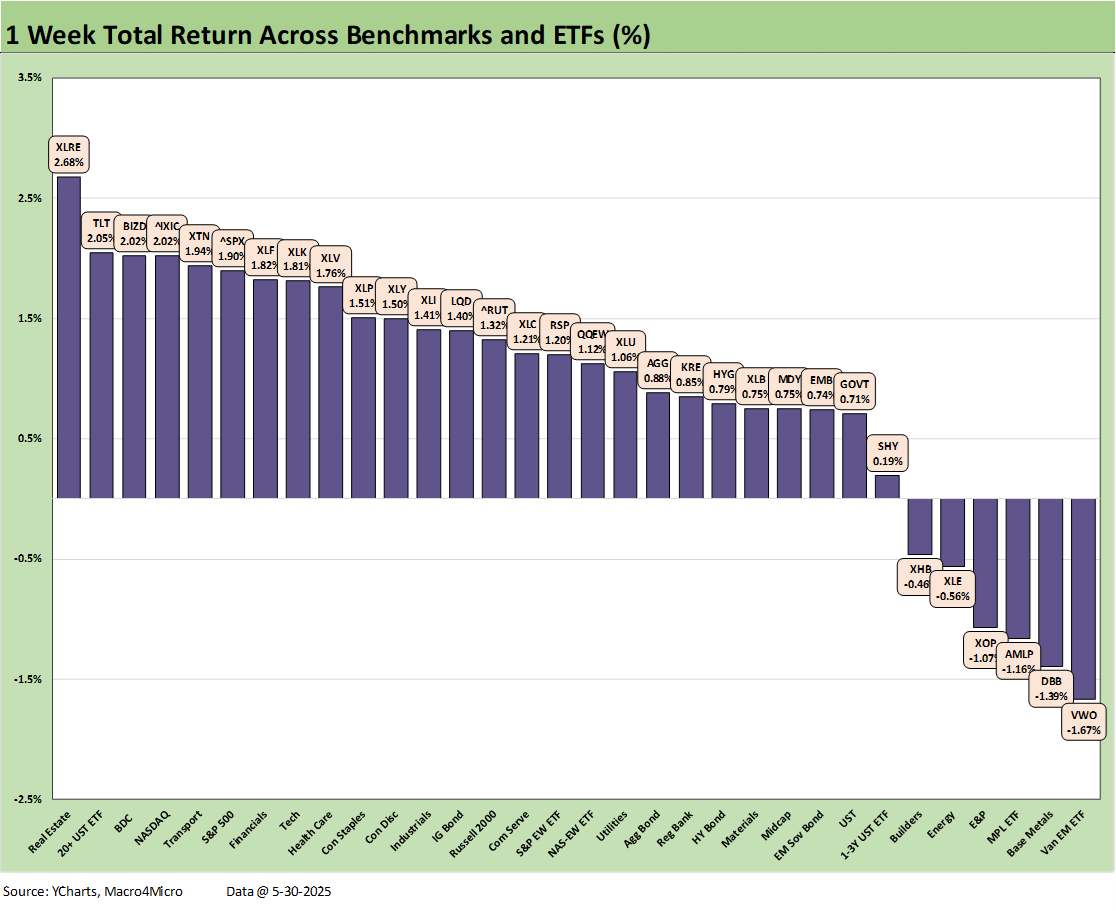
The 1-week return above at 26-6 marks a major reversal from the 3-29 score last week. The rally in the UST curve was already detailed in Mini Market Lookback: Out of Tacos, Tariff Man Returns (5-31-25) and included a rally in the 30Y that sent the long duration UST 20+Y UST ETF (TLT) to the #2 spot in the top quartile just below the curve-sensitive Real Estate ETF (XLRE).
The rally was broad with the NASDAQ and S&P 500 in the top quartile with BDCs (BIZD), Transports (XTN), Financials (XLF), and Tech (XLK). With Friday’s news on 50% tariffs, the focus could return to heightened trade war risk again. The latest steel and tariff move will hammer a number of major trade partners with Canada and the EU at the top of the import list for steel and Canada the dominant low cost importer of aluminum (Aluminum and Steel Tariffs: The Target is Canada 2-2-25).
Separately, the Trump attacks on China violating the terms of the pause combines with the widespread headline in banning Chinese students to make trade talks even more challenging. As we covered in our earlier commentary, Hegseth was aggressively rattling the US saber at China over Taiwan. For China, that is a well known red line. Taiwan lost its UN seat and the US embraced one-China status in the 1970s across GOP and Democratic White Houses. At this point, the administration’s plan is unclear at a time of critical trade talks. Rubio’s move to revoke Chinese student visas will add to the headwinds on trade progress.
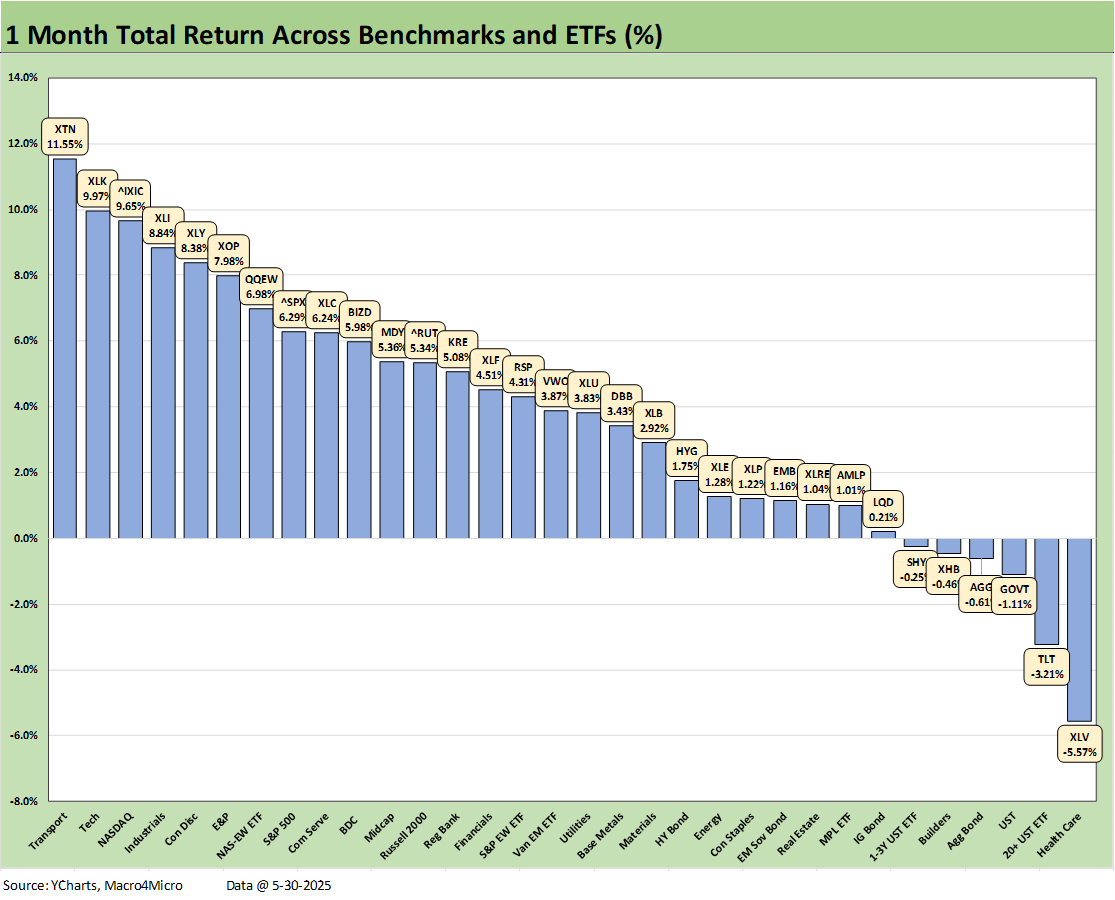
The 1-month time horizon was an equity celebration over the measurement period with the China truce and pause in reciprocals. The score of 26-6 includes 4 bond ETFs in the negative return mix. We also see Homebuilders (XHB) and Health Care (XLV) in the red.
Health Care (XLV) has been under siege on multiple fronts in terms of tariff risks, relocation pressures (back to the US), the UnitedHealth headlines, and Trump talking about price controls. The Section 232 ambitions for pharma make trade war risk with the EU close to a sure thing (even if “sure thing” can be a curse in markets). The retaliation risk associated with pharma, which is by far the #1 EU import, also flows into health care inflation risk and the costs of medication. Awareness of the threat of China’s domination of generics is important if the US-China battle heats up again. That generics and ingredients import dependence has not gained as much airtime, but it gets frequently cited by people in that business.
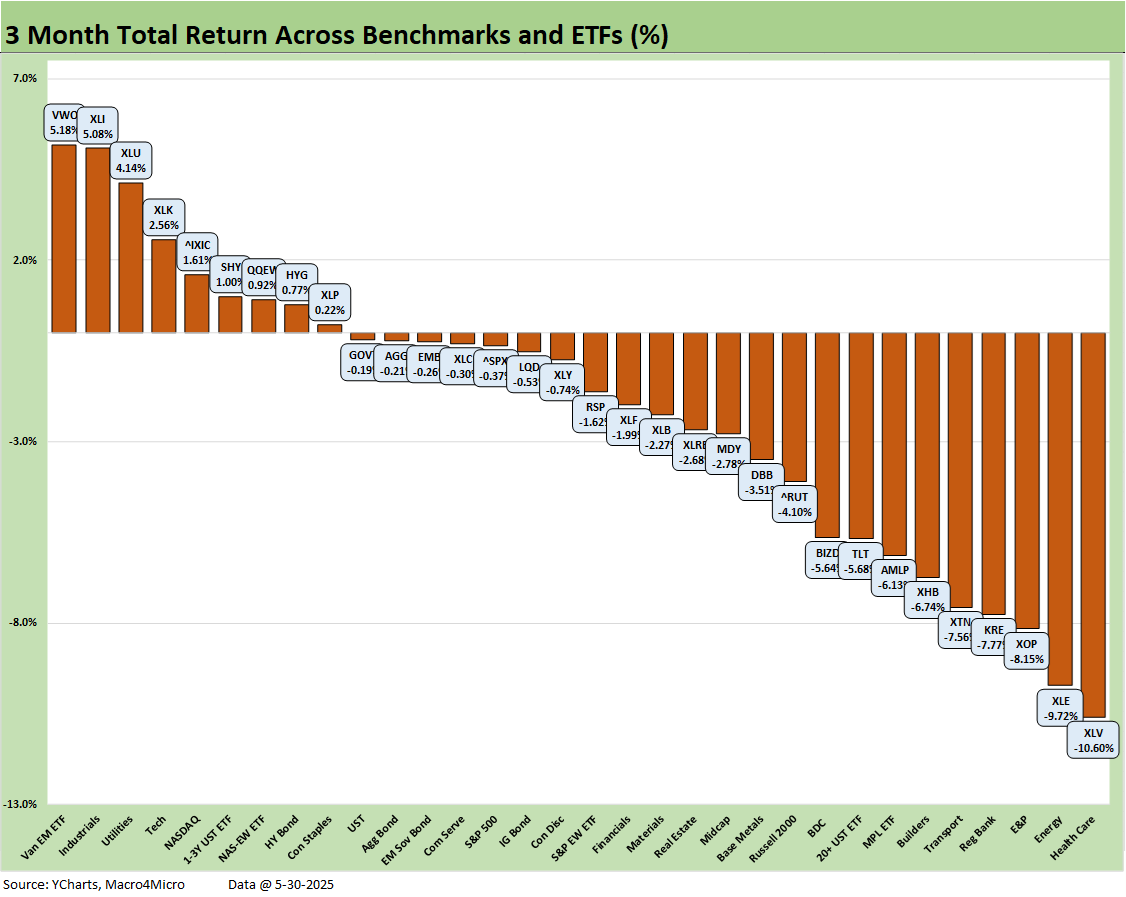
The 3-month score of 9-23 is a reminder that it has been a volatile year. You could make the top quartile for 3 months with less than a 1% return. You needed to post a -5.7% return to make the bottom quartile. Last place was Health Care (XLV) at -10.6% while the #1 slot of EM Equities (VWO) posted +5.18% with Industrials (XLI) just behind it at +5.08%.
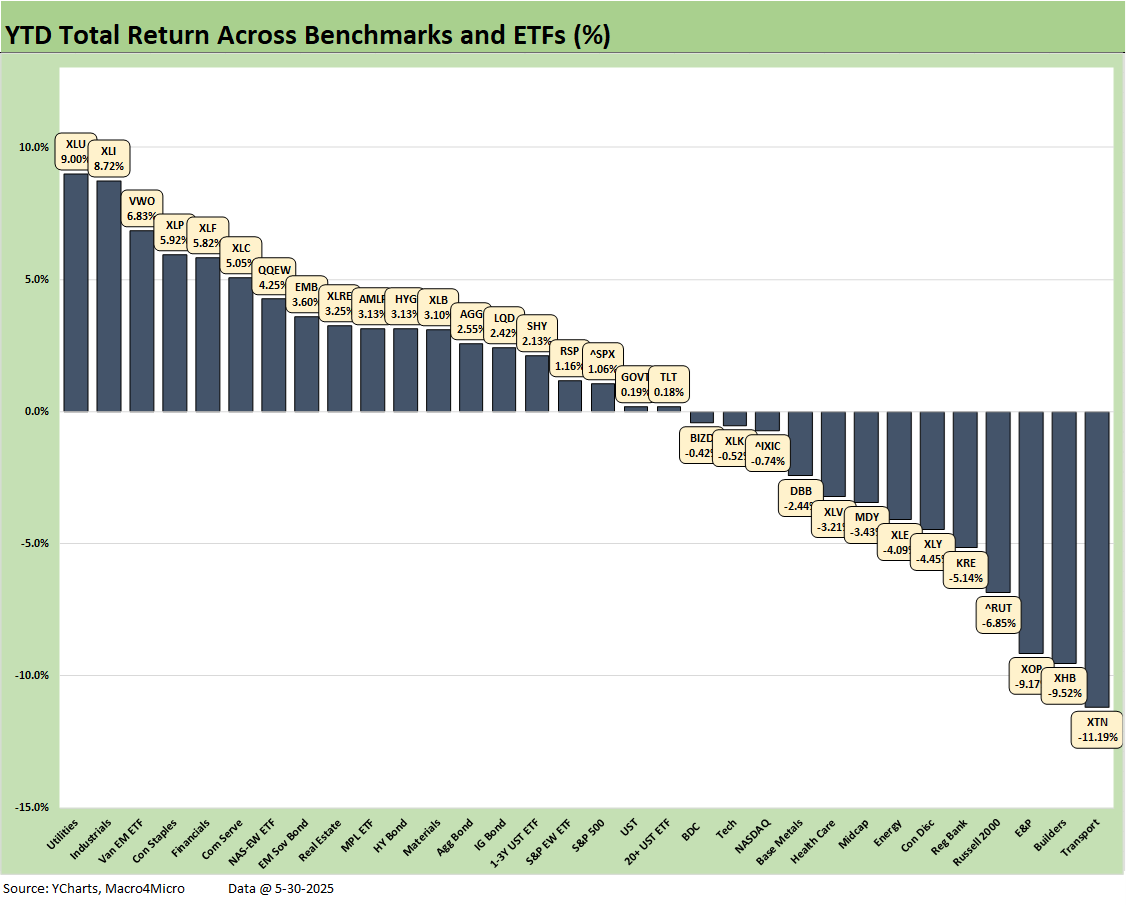
The YTD score of 19-13 highlights the good start to the year before tariffs seized the headlines. As a reminder, the month of January 2025 posted a 29-3 month (see Footnotes & Flashbacks: Asset Returns 2-2-25). Then the world got mired in trade debates and handicapping what were “negotiating strategies” and what was real. We know now that the tariff floor is very high in historical context.
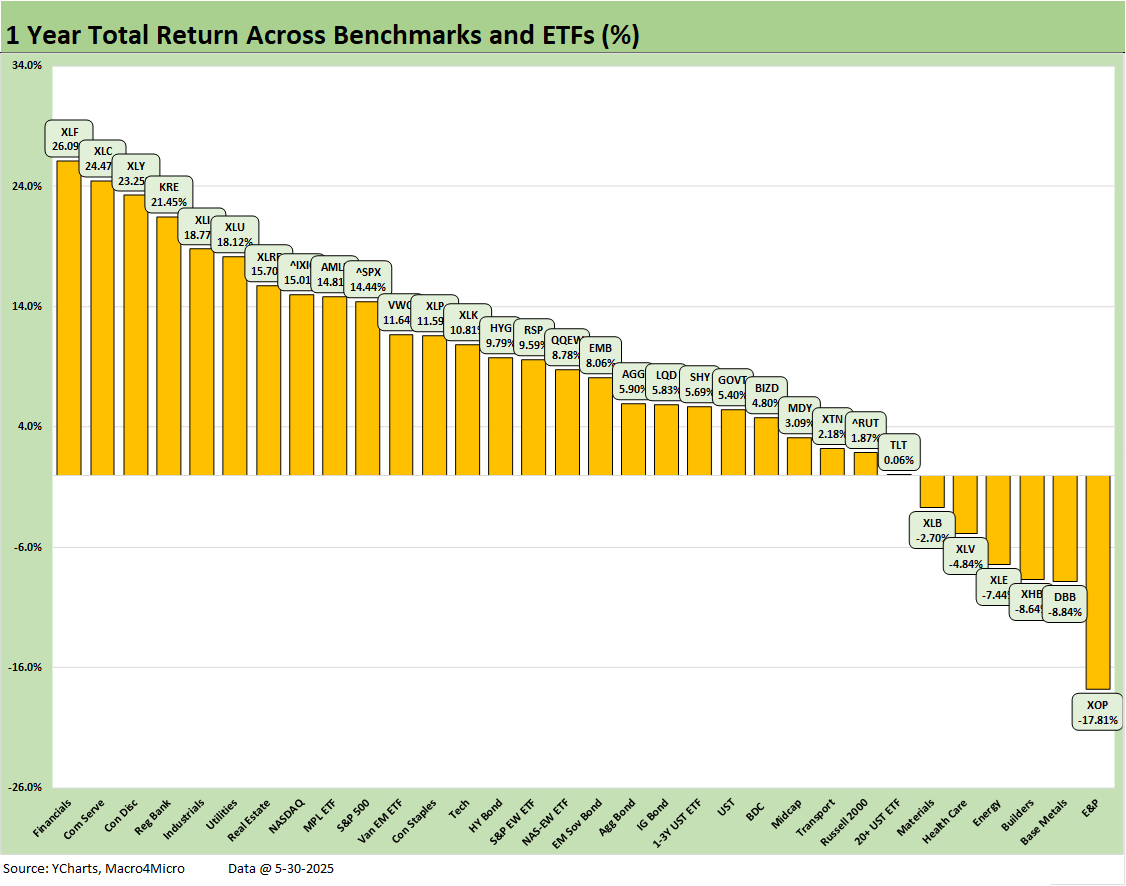
The 1-year numbers are still riding the wave of a very strong two years for equity returns and the first back-to-back 20+% returns for the S&P 500 since the late 1990s. We see the broad market benchmarks above spread across the quartiles for the trailing 1-year with the NASDAQ in the top quartile, the S&P 500 in the 2nd quartile, Midcaps in the 3rd quartile and the Russell 2000 in the bottom quartile. We see 1 bond ETF (HYG) in the 2nd quartile, 5 in the 3rd quartile (EMB AGG, LQD, SHY, GOVT), and 1 in the bottom quartile (TLT).
See also:
Mini Market Lookback: Out of Tacos, Tariff Man Returns 5-31-25
PCE April 2025: Personal Income and Outlays 5-30-25
Credit Snapshot: Meritage Homes (MTH) 5-30-24
1Q25 GDP 2nd Estimate: Tariff and Courthouse Waiting Game 5-29-25
Homebuilder Rankings: Volumes, Market Caps, ASPs 5-28-25
Durable Goods Apr25: Hitting an Air Pocket 5-27-25
Footnotes & Flashbacks: Credit Markets 5-27-25
Footnotes & Flashbacks: State of Yields 5-25-25
Footnotes & Flashbacks: Asset Returns 5-25-25
Mini Market Lookback: Tariff Excess N+1 5-24-25
New Home Sales April 2025: Waiting Game Does Not Help 5-23-25
Existing Home Sales April 2025: Soft but Steady 5-22-25
Credit Snapshot: Lithia Motors (LAD) 5-20-25
Home Starts April 2025: Metrics Show Wear and Tear 5-19-25
Footnotes & Flashbacks: Credit Markets 5-19-25
Industrial Production April 2025: CapUte Mixed but Time Will Tell 5-15-25