


My God lovie, those people actually expect positive real wages!?
We detail July payroll trends with targeted payroll deltas from the Establishment Survey from the top down. We also dig into Construction, Manufacturing, and Service-providing lines.
July brought the 7th negative month for payroll additions since Jan 2025, which also comprises the only payroll declines since the tightening cycle began back in March 2022. The July BLS release saw 2 material downward revisions for May and June.
July eases some (not all) of the concerns around FOMC getting nervous on job trends and flowing into a tightening plan, but the negative real wage growth is not making those on the payroll any happier. As we go to print, the odds from CME FedWatch show the probability of a Fed easing by the Dec 2026 FOMC at 22.0% for no action, 44.5% chance of 1 hike, 27.4% chance of 2 hikes, and 5.2% chance of 3 hikes.
We would expect the negative real wage growth seen in the July payroll release and in the 2Q26 Employment Cost Index data to drive a major national minimum wage increase advocacy program given how that topic can raise pressure in the Senate and House and down into the state houses at the Governor and legislature level. We see several proposals in process including some phase-ins to $25 per hour. The political heat will need more headline advocacy from a Democratic party that cannot get out of its own way (see Employment Cost Index June 2026: Inflation > Wage Growth 7-31-25).
The negative real wage topic will be the “mirror test” for Democratic party policy planners and something where centrists and “progressives” can find common ground. The minimum wage is about working-class support and affordability. The last legislation was phased in from 2007 to 2009 to $7.25 per hour. Prior to that, the 1997 legislation was $5.15 per hour. Note: some state and local entities legislated their own given GOP opposition at the Federal level.
On wages and affordability, there is a clear history that makes minimum wages mainstream. To quote Theodore Roosevelt’s 1912 Progressive Party platform statement: “We stand for a living wage. Wages are subnormal if they fail to provide a living for those who devote their time and energy to industrial occupations.” Please note that was “Teddy” and not Marx or Lenin (not that Trump has read a single page written by either of the latter two).
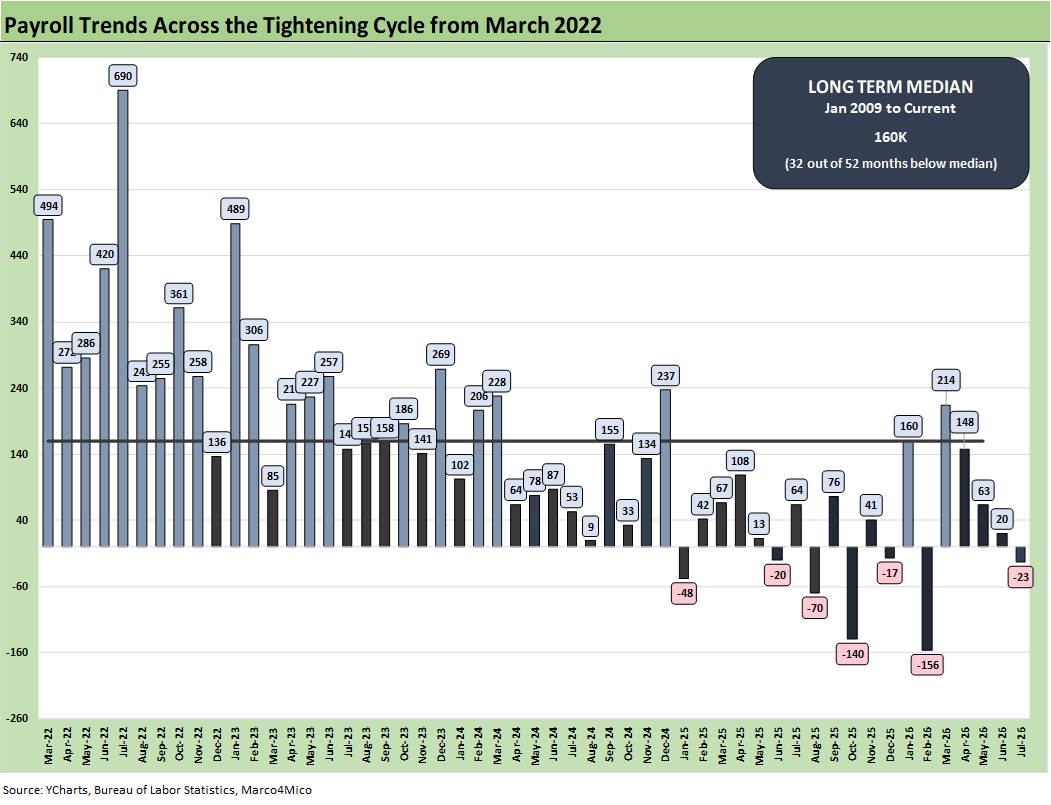
The above monthly payroll additions chart brought another negative month on payroll declines. Since Jan 2025, we have seen 7 of 19 months in negative range under Trump. Those are the only negative months in the chart as shown since the start of the tightening cycle in March 2022. Prior to that date, the last negative month we saw was Dec 2020 in Trump’s last month in his term. Welcome to the Golden Age.
One can make qualitative assessments on the mix of occupations reporting increases and decreases in payrolls, but the reported number in July flunks the “MO jobs, MO money” rule needed to support consumer spending volumes.
Now the question is “How much money is left for discretionary spending after the effects of inflation and lower real wages?” Add in even more tariffs and more energy cost pressures rolling into the working capital cycles (materials, power, transport, etc.) and households are facing a problem.
That long-term median from Jan 2009 of +160K includes a slice of the longest recession since the Great Depression, so it is not a high bar to clear. Since the Jan 2025 inauguration, Trump has exceeded the post-Jan 2009 median in a single month (April 2026) with Jan 2026 on top of the median. We don’t expect Hassett or Bessent to raise that topic.
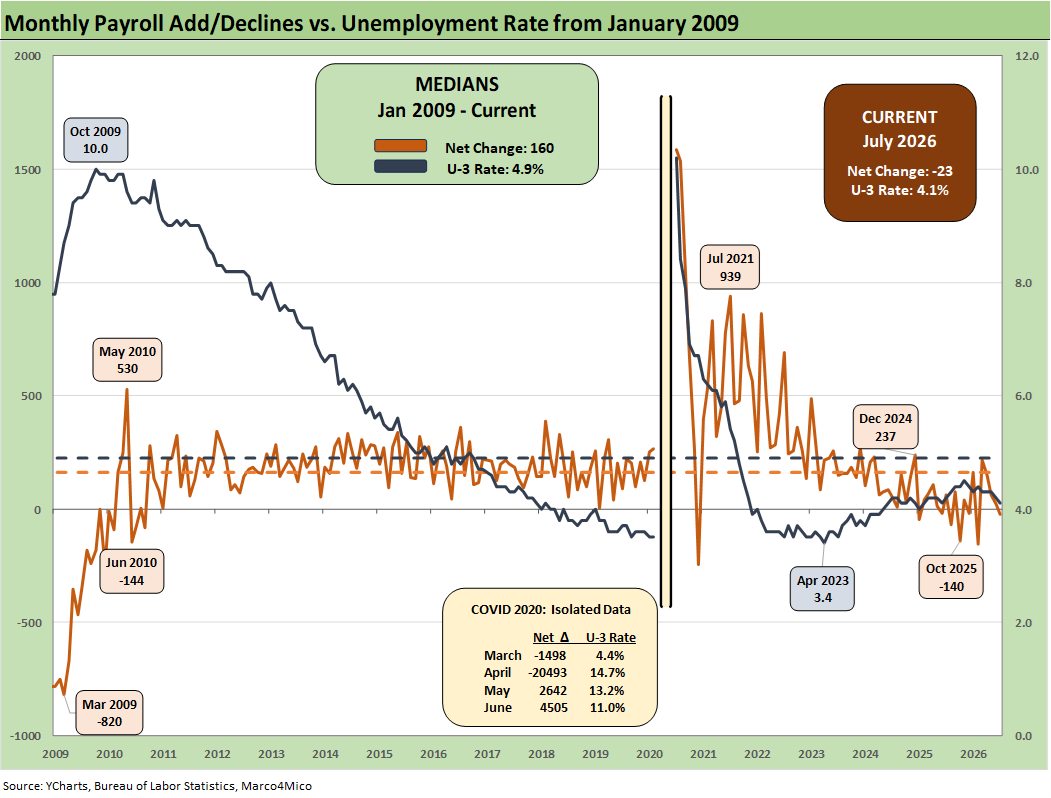
The above chart plots the running job adds/declines since Jan 2009 against the unemployment rate, which at 4.1% (4.09%) remains a full employment level even if the Household Survey data (addressed in a separate chart below) is showing material contraction in the labor force denominator.
In the chart, we isolate the worst months of the COVID dislocations in the box for better visuals to capture the other periods. The 4.1% U-3 is below the long-term median from Jan 2009 of 4.9% (5.0% from 1994).
Payroll has been struggling somewhat in relative terms in 2025-2026, but history is very kind to 4.1%. The U-3 is a different exercise than “counting employed heads” in narrow context. As we cover below, the total employed are down by -963K YoY.
If the 2025-2026 frame of reference for payroll additions is 2024 (not a good jobs year) then the 2025-2026 numbers are acceptable (not great). If we compare 2025-2026 monthly adds to the 2022-2023 period, the current job add run rates are weak.
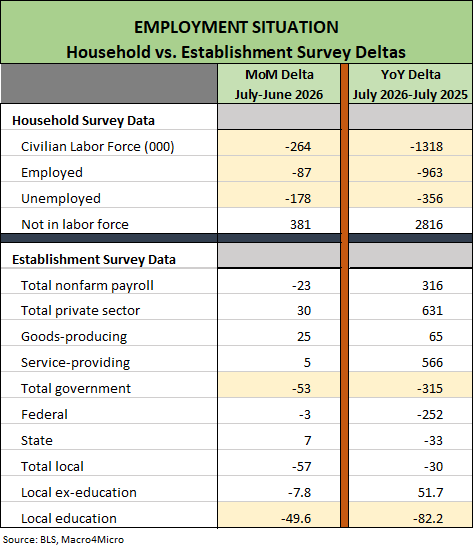
The above chart and the following 2 charts are essentially cut and pastes from LinkedIn post on Saturday:
The above chart details the monthly data dance between the Household Survey Data vs the Establishment Survey. The unemployment rate of 4.09% as always has a few moving parts with the total of employed, total unemployed, and civilian labor force all lower.
For those of us who work off the “total paycheck rule” the paycheck count translates into purchasing power – or simply the ability to service growing debt burdens. The monthly PCE reports show steady consumption but also much lower savings rates.
By the total “jobs added” metrics, the payroll trends are not very impressive in 2025-2026 or simply soft. The numbers came in well below expectations after also coming up short vs. the ADP estimates. The UST 10Y initially traded down by less than 2 bps and the 2Y UST and just under 5 bps lower as we go to print. We look at UST deltas for the week separately. The week saw another healthy rally with the need to digest latest gamesmanship on peace terms.
The usual high-level focal point around the “body count” metrics is total labor force and participation rates and related deltas. The participation rate is 61.4%, down from 62.2% YoY and 61.5% sequentially from June. A growing population and basic demographics should translate into higher GDP, higher payrolls, higher production, and higher trade flows. Otherwise, people dig out old movies to watch (think “Soylent Green”).
Some of the decline can be tied to factors such as local education that gets rolled back into the numbers in the fall, but we are seeing YoY declines in local education as well. Local ex-education is up YoY. We will look at more occupation lines separately, but the -40K MoM in “Leisure and Hospitality” could be telling a story on the K recovery and affordability. The same could be the case for the -19.4K in MoM in Retail Trade.
The theme of “low hire, low fire” is still playing out but against a backdrop of weak affordability as covered in other commentaries. Wage growth has been lagging inflation (or slightly over/under inflation) by various metrics. The latest wage growth rate of +3.2% in the BLS payroll release is below headline PCE inflation (3.7%) and headline CPI (3.5%). That is negative real wage growth. Maybe Trump can peek at that relationship while claiming “affordability” is a fake term made up by Communists. It is long division and subtraction/addition taught in grade school.
Some limited good news from JOLTs (1-month lag) this past week was that June hires were up MoM but only fractionally higher YoY. In our view, that is offset by lower job openings and higher separations that leave payroll prospects muddled at best with AI remaining a wildcard everyone is still trying to figure out. In JOLTS, we at least see hires focused more in Durable Goods and Construction. Leisure and hospitality hires were down materially in June (reminder: 1-month lag for JOLTS).
The education lines at the local level jumped out in the BLS payroll release. In what seems to be a fact-free world some days where reading is considered a superfluous activity, education is more important than ever. As a subjective assessment, we see fewer people reading (referring to Congress) and fewer teaching according to these BLS statistics. That only serves the interests of a certain crowd that prefers their voters ignorant and uninformed factually. They know who they are…
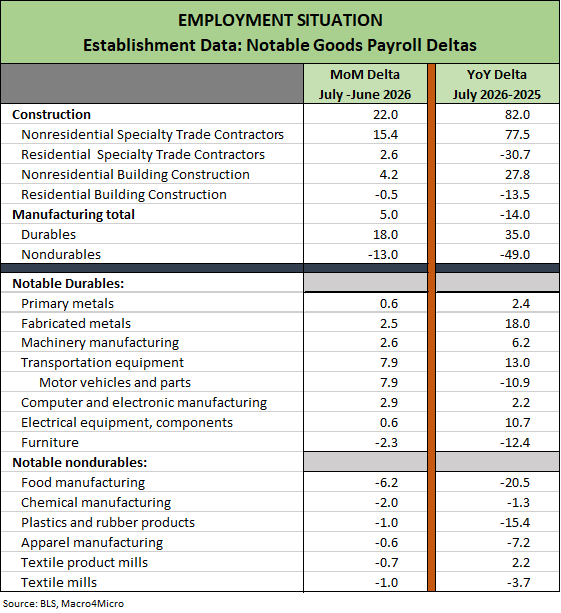
The chart above breaks out useful MoM and YoY payroll deltas for some important goods-producing occupation lines in Construction and Manufacturing. The prior chart posted deltas from total payroll down across the high-level categories of private, government and notable lines within those groupings such as total goods, services, and key government groupings. The above lines address some of the more politically charged sectors in goods that are being supported through tariff policies.
Overall, payroll tallies by group added up to a mediocre month that drove a slight rally on the day in the 2Y UST and minimal downtick in the 10Y. A strong jobs report would have fueled some inflation anxiety with wage growth lagging and real wages in the red. The wage trends are a missing link for a higher level of inflation anxiety. This coming week we get a fresh print on CPI and PPI with a return to higher energy costs in July after the June energy relief.
Construction and Manufacturing payroll deltas in the chart tell a mixed story. The use of tariffs are questionable in terms of the economic conceptual foundation. Trump will still not admit that the buyer writes the check for the tariff, and the media is too cowed to ask him that direct question again in live Q&A. His econ and policy team simply lie or evade.
We would expect in a growing economy (it grows every year with rare exceptions) and growing population, total payroll should be rising outside a major macro shock. That is broadly what is unfolding despite some negative months. We see some YoY declines by industry as noted. Some declines are linked to sector weakness (residential), some are structural at the industry level (nondurables), and some of the pressure is secular and permanent (Apparel and Textiles).
The Construction business has been booming in nonresidential with residential still feeling the pain of mortgage rates, supply constraints, and post-COVID housing affordability stress. The increased payroll in nonresidential vs. residential construction is very clear.
In Manufacturing, we highlight some bellwether industries within Durables and Nondurables. Durables are doing better YoY within a range. Notable declines YoY include “Motor vehicles & parts” at -10.9K within the broad “Transportation equipment” group that rose by +13K YoY. The “Furniture” decline was significant given the dubious goals of tariff support that we also saw with autos. While it is a data exercise for another day, Manufacturing, Durables and Motor Vehicles are also lower in July 2026 than they were in Dec 2024 at the end of Biden’s term.
Nondurables were down YoY. Numerous lines lend themselves to “capital replacing labor” via automation. The barriers of labor costs in the US (notably Apparel and Textiles) make tariffs a policy of “brooming water up a hill” if the goal is to bring those jobs back. Prices will rise for consumers and retailers will face cost pressures to pass on. Tariff policies will not bring jobs and investment to undo that damage in such nondurable industries that are tied to low-cost labor and automation.
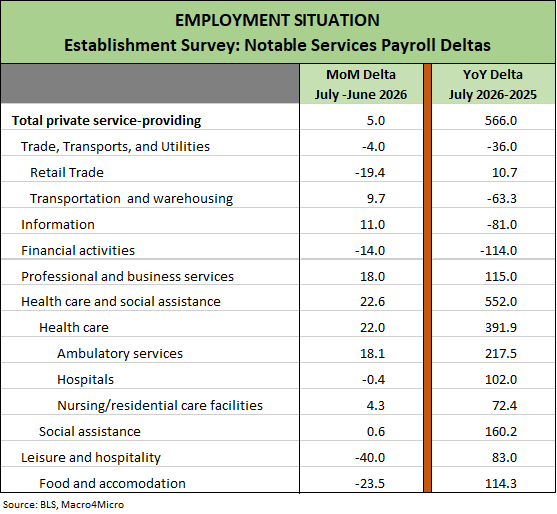
The chart frames the MoM and YoY payroll deltas for private “service-providing” occupation lines. This is a selection of key industries that roll up under the umbrella of “total services” payroll that comprises 84% of private sector headcount. The “goods-producing” payroll is the other 16% of the private sector. Service-providing payrolls are almost 72% of total payroll if we include the 23.3 million jobs listed under the Government heading (Federal, State, Local). It is not a hot news item that the US is a services economy.
Services drove a +566K delta YoY in payrolls for July 2026. Among interesting trends, we see a YoY decline in Transportation and Warehousing that include declines spread across a range of lines under air, rail, and truck transport. The backdrop of trade disruptions will be a factor to watch with highly uncertain policies potentially undermining expansion plans near term.
The multiplier effects that come with goods crossing the border in turn flow into freight and logistics and finance revenues and generate jobs and profits in the US. The “MAGA myopics” tend to ignore that reality of how many economic multipliers come with imports on their intra-border journey to the eventual buyer. Trump still sees a trade deficit as simply an invoice and a check written to other countries. He cannot comprehend the US buyer made that decision for economic reasons relating to profitability goals (some textbooks call political leaders overruling such private sector decisions “communism.”)
The most glaringly obvious takeaway is the outsized role of the personnel-intensive health care sector and its range of subcategories. Health care comprises 18.5 million jobs. “Health care and Social assistance” combine to a total just under 24 million. That scale of headcount is no surprise given that the health care industry, more broadly defined, amounts to around 18% of GDP. The moving parts of Health care and Social assistance demand is part of an aging society.
The many challenges from health insurance premiums (notably ACA) and how it all flows into coverage affordability overlaps with a maze of health care products, services, and government programs. That in turn makes this broad sector one that dominates political conflicts.
The “Obama vs. Trump” themes in health care have made health care more about party conflicts than economics. With a somnambulist zombie of limited experience and low talent running national health care, the situation keeps getting worse for collective health and household healthcare economics. The reality of demographics is as important as the politicization of the topic. It is no surprise we see steady payroll growth across the years in a range of the services lines catering to the senior citizen ranks of the boomers. The desire to just cut rather than improve the flows of heath care goods and services is apparent as well as cruel.
The other big services line that can swing around is Leisure and Hospitality with -40K MoM for July but +83K YoY. The theme of “eat, drink, and get sick” is hard to escape.
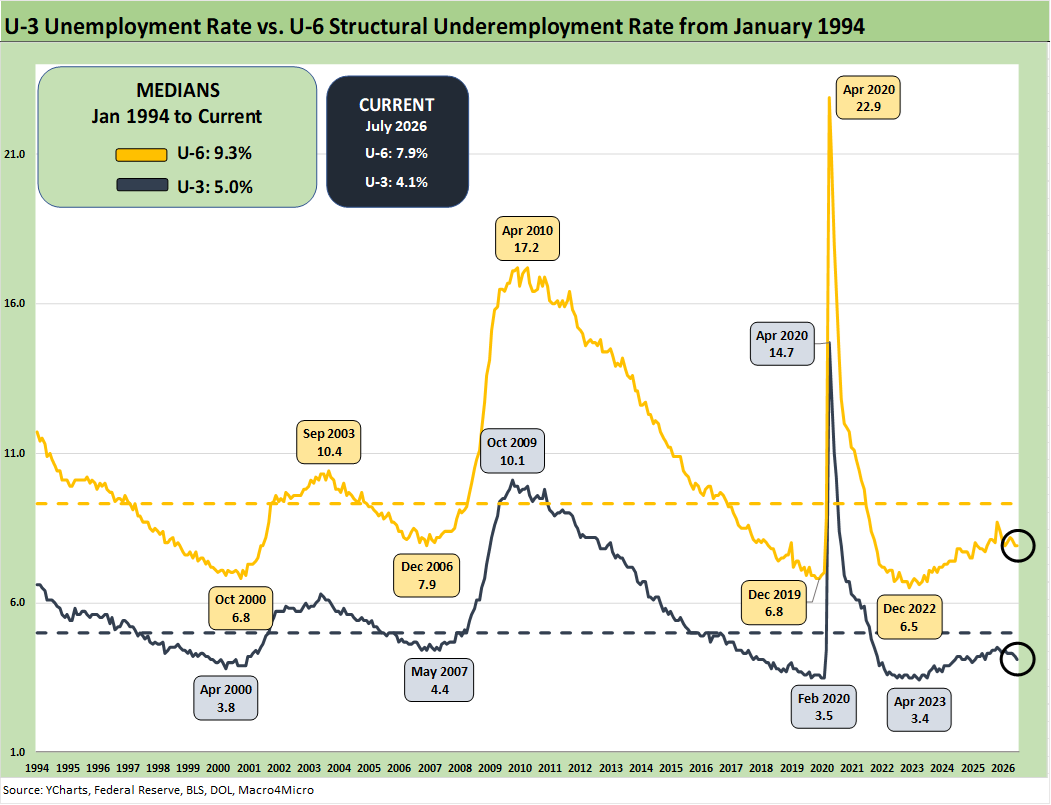
The jobs deltas saw the U-3 dipping slightly below the 4.1% line (4.09%). The U-6 was also steady moving sideways at 7.9%.
As a reminder, the U-6 metric is defined with the numerator as “total unemployed + persons marginally attached to the labor force + total employed part time for economic reasons.” The denominator is “civilian labor force + workers marginally attached to the labor force.”
As we covered earlier in the YoY deltas and the Household Survey data, the civilian labor force is down sharply YoY with the category of “not in labor force” spiking. “Not in labor force” can be as simple as someone who wants a job but is not actively looking. The turmoil in the tech services headcounts of late and downsizing of government departments are easy ways to envision why this trend is unfolding.
The U-6 is the structural underemployment metric that is always useful to watch. To start 2025, the U-6 rose sharply in Feb 2025 to 8.0% from 7.5% in Jan 2025. The U-6 jumped to 8.7% in Nov 2025 from 8.1% in Sept 2025.
The current 7.9% marks a decline from 8.1% in May and 8.2% in April. That is good news. The current U-6 is well above the 6% handles seen in spring of 2023. The U-6 is still below the median from 1994 of +9.3%, which notably includes the post-crisis shock and the longest recession since the Great Depression.
In the chart, we isolate the worst months of the COVID dislocations in the box for better visuals to capture the other periods.
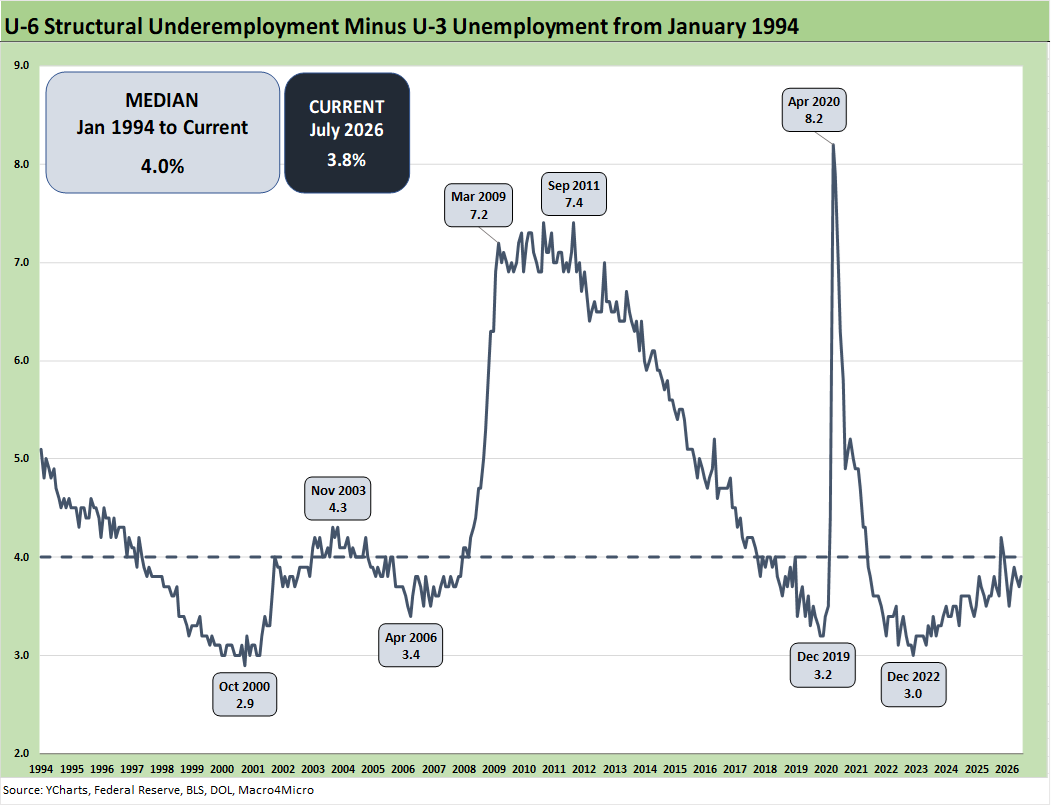
The time series above updates the U-6 minus U-3 differential as a measure of relative employment quality and to flag risks of major dislocations in large swaths of the economy (think oil patch collapse in the late 1980s, tech bubble imploding into a weak 2001-2003, and financial services and automotive meltdown in 2009).
The current 3.8% differential is below the long-term median of 4.0%. The job ranks are still vulnerable now with stubbornly uncertain and erratic developments in Iran. The risk (notably the FOMC, consumer health, and goods costs) will necessarily be a factor to consider in hiring decisions.
The anxiety around where the UST curve, energy costs, and raw materials go from here remains high in terms of the impact on working capital cost inputs and employer decisions. The feedstock costs have been ugly until the recent adjustments in more than just oil. Iran peace promises are often heard as settled, but “it ain’t over ‘til it’s over” clearly applies. The housing sector remains quite vulnerable to any UST steepening risk.
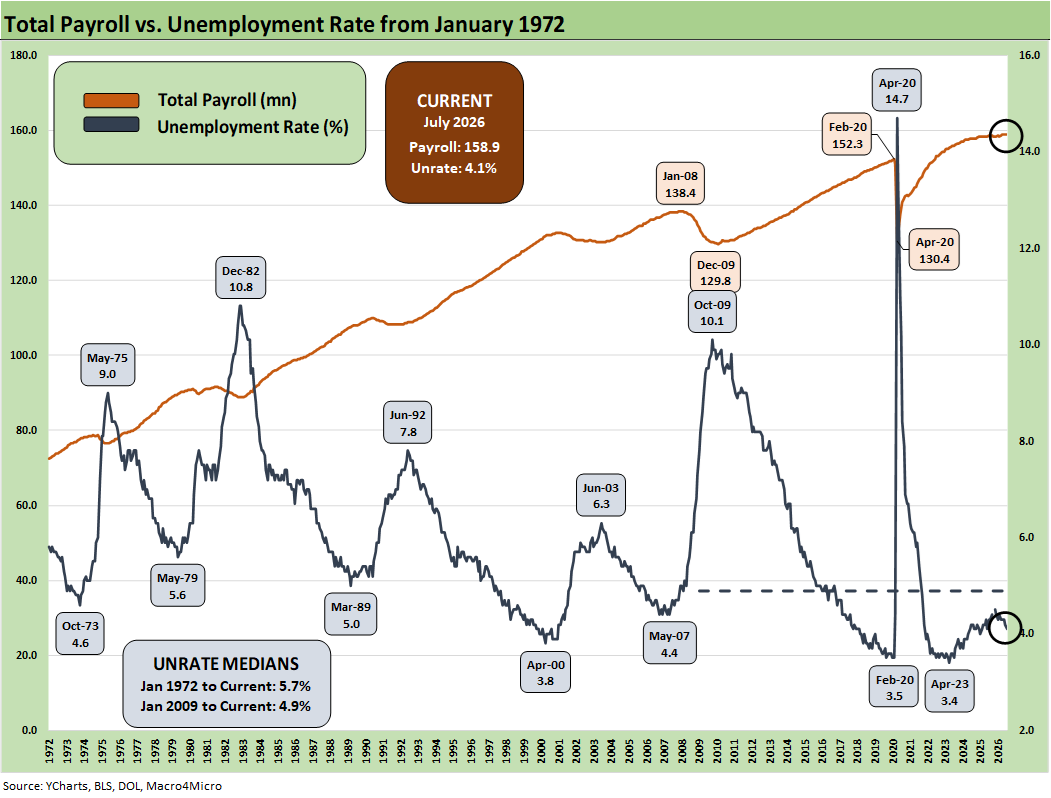
The above chart updates total payroll vs. the unemployment rate. The trend needle has not moved much in 2026 and has been in a narrow range. More bodies with more paychecks are always a good thing but July was a setback. Meanwhile, the Household Survey data pushes back on the Establishment Survey in terms of the direction of total employed heads.
The trick from here is how the consumer deploys their paychecks and whether the zero-sum realities of household budgets undercut spending. The PCE line in the GDP accounts is a critical driver of growth and negative real wage growth. In reality, this can be a leading indicator for spending or wage demand pressure.
That PCE growth represents 68% of GDP, so the improvement in 2Q26 GDP after a very weak 1Q26 GDP offered some tangible cyclical relief (see 2Q26 GDP: Good Underlying Numbers Despite Headline 1.5% 7-30-26, GDP 1Q26 Final: PCE Growth Plunge 6-25-26).
The consumer sector was a worry, but you never heard the talking heads in the White House (notably Hassett) discuss the weak PCE growth until some good 2Q26 numbers arrived. The PCE growth is well below what we saw in 2024 when it was near 4.0% for the last few quarters (back when the country was “dead” per Trump). Numbers are objective, but the adjective-heavy crowd avoids them.
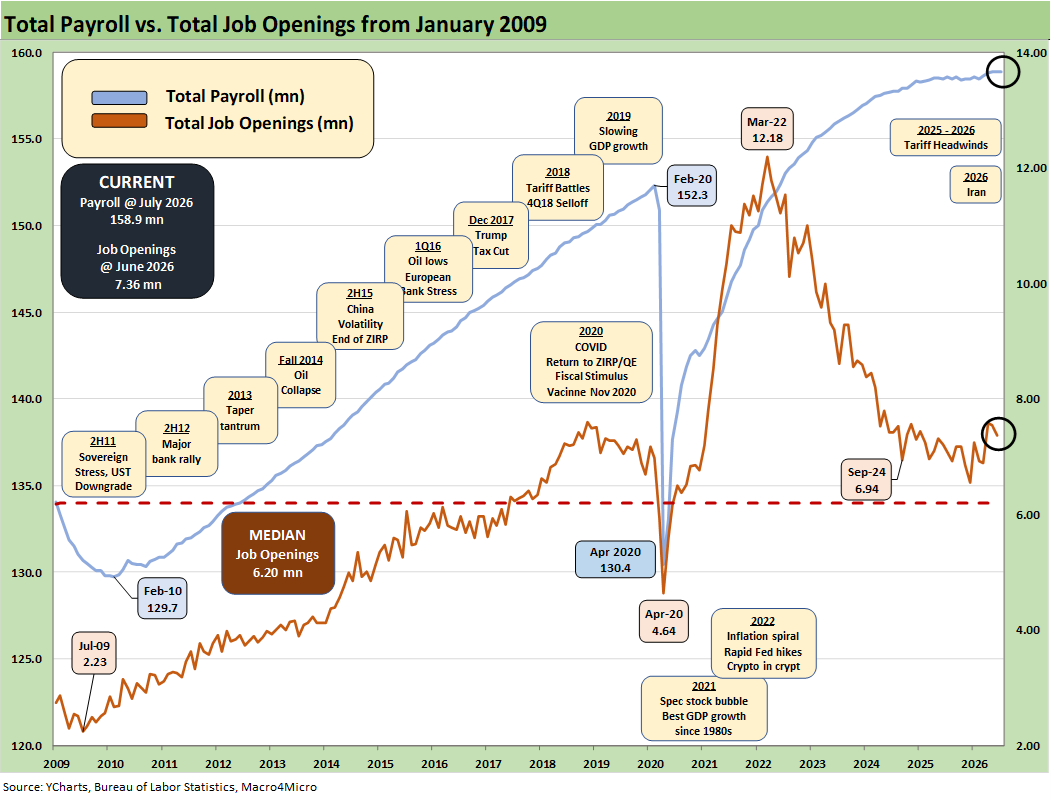
The above chart updates the total payroll numbers vs. job openings. Management teams have a lot of moving parts to factor into planning whether quantitative or qualitative before they fill the openings. The potential for a wave of new tariffs ahead with the USMCA demise or replacement and clear ambition to aggressively tariff Canada and the EU are not incentives for employers to rush out and fill the job openings or launch more initiatives where the economic inputs are in a state of flux. It is also an election year where political risk is rising to levels that the US has not seen since 1860.
The final IEEPA decision from SCOTUS came in against Trump, but he was prepared to start slapping on tariffs under Section 122, 232, and 301. More recently, Trump has unearthed a clause with the Smoot Hawley tariff legislation of 1930 using Section 338. When in doubt, a natural plan is to go to the Hoover playbook (that worked so well).
Trump’s priority is to maximize tariff revenue no matter how contrived and specious the grounds. My personal favorite remains the Section 232 national security tariffs for upholstered furniture. The need for a good cushion is critical to US defense (!?).
The trade flows have been looked at in many past commentaries (see Trade Deficits: The Moving Parts and Macro Goals Matter Most 6-24-26, Meanwhile…Back in Economics and Tariffs 3-2-26, US Trade with the World: Import-Export Mix 2-25-26). The US has a goods trade surplus with Canada ex-oil. Canada is also the leading export market for almost 3 dozen US states. Those states, including every central and northern swing state, might have something to say about that…perhaps in midterm elections.
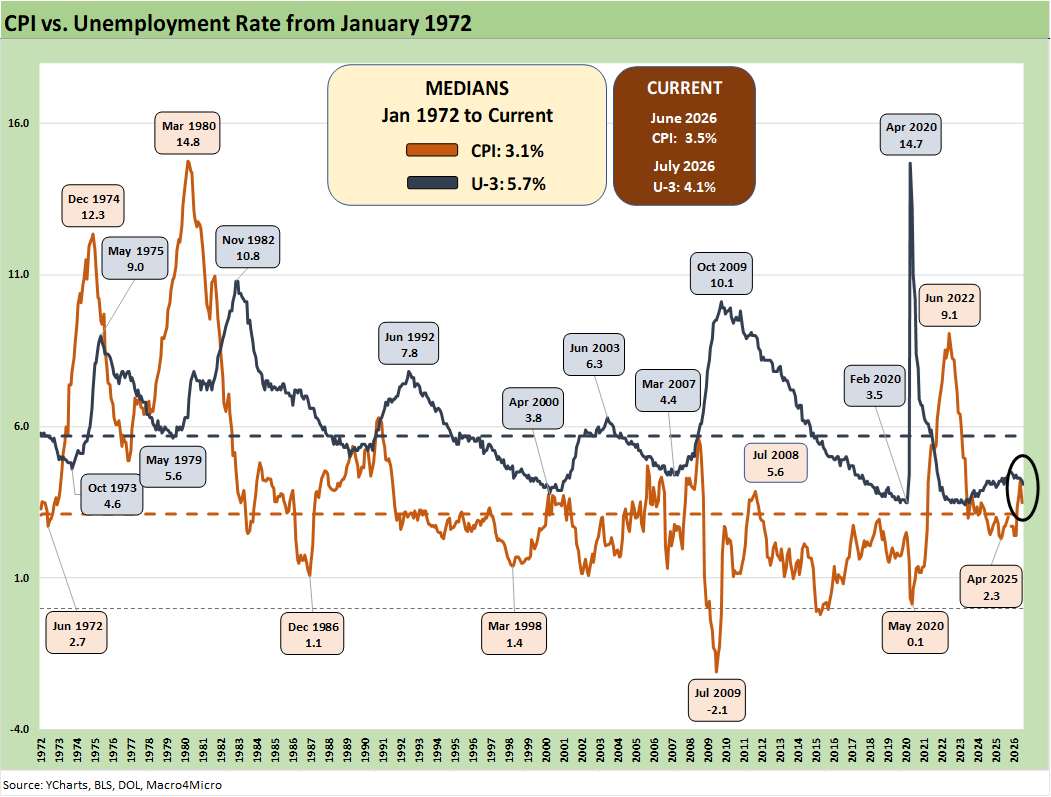
CPI vs. unemployment rate is plotted above. The big worry back in March was fear of stagflation – something not seen since the 1980-1982 double dip under Volcker (except a brief touch of worry in fall 1990). That has subsided in recent weeks despite the higher inflation numbers. It would take a massive setback in US-Iran escalation risks to change that, but the weekend brought more bad news on the Strait reopening and the end of Gulf conflicts. At some point, China will ramp up buying oil on a grand scale again.
The overall economic impact of tariffs has been far less than feared given the reality that most trade partners backed down in 2025. That still could change in 2026 with the latest wave of Section 301 and Smoot Hawley 338 attacks on supplier chains and trading partners. There is always the chance that Trump might push Canada and Mexico too far and the same for the EU. Notably, export taxes on Canadian resources would be an inflationary game changer.