


Maybe we will hold off…
Mortgage rate pressure and some cyclical nerves just delivered a weak set of housing starts for July. The delta for total starts was -12.4% MoM and -13.5% YoY with single family at -9.9% MoM and -15.7% YoY. Cost pressures and uncertain turnover are keeping builders on the defensive.
Permit trends were favorable in comparison just by being positive growth, so there is a debate to have on when activity could step back up if oil takes a favorable turn and pushes the 10Y UST lower (and thus 30Y mortgage rates). The direction of the curve since Iran has been a headwind for residential (see Market Commentary: The Curve 8-17-26).
Multifamily also took a sequential beatdown at -15.6% from June and -7.1% YoY but permits also eased fear of more dire scenarios (+9.1% MoM, +6.3% YoY).
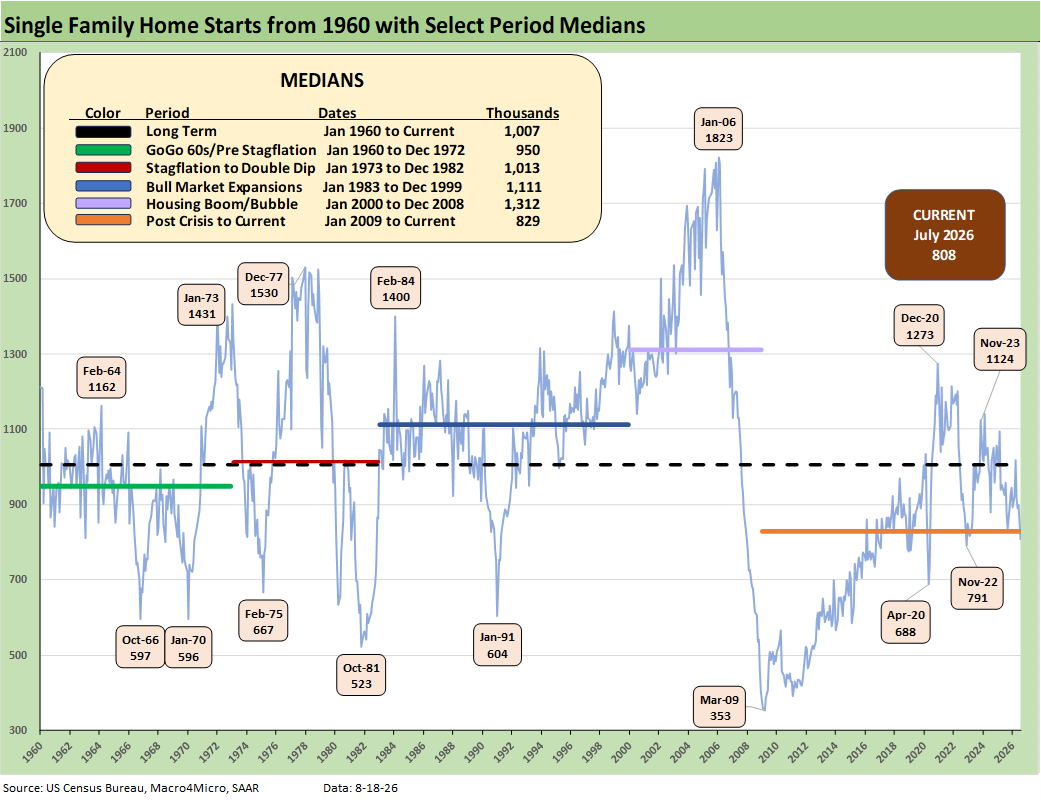
The above chart offers a clear reminder of the wild single family residential construction cycles across the decades. With favorable demographics for housing demand, the current starts run rate of 808K (vs. 897K in June) is still well below the long-term median of 1007K and below all the timeline medians posted above.
The current backdrop includes mortgage rate pressures undermining the affordability of monthly payments with the Mortgage News Daily 30Y survey most recently closing at 6.75%. Mortgage rates are not likely to get much better from here with steepening the theme of the markets and rising 10Y and multi-decade headline highs (since 2007) for 30Y UST rates.
The Iran War and Strait of Hormuz crisis is threatening UST bear steepening even if a bull flattening can be in the prayers of those hoping for peace and an oil crash. The steepening and negligible odds of easing come after seeing mortgage rates flirt very briefly with crossing below the 6.0% line in Feb 2026, just before the Iran War. That is one more missed opportunity that fell prey to “Geopolitics Amateur Hour” that used an inner circle of real estate “friends and family” and not regional experts and experienced diplomats.
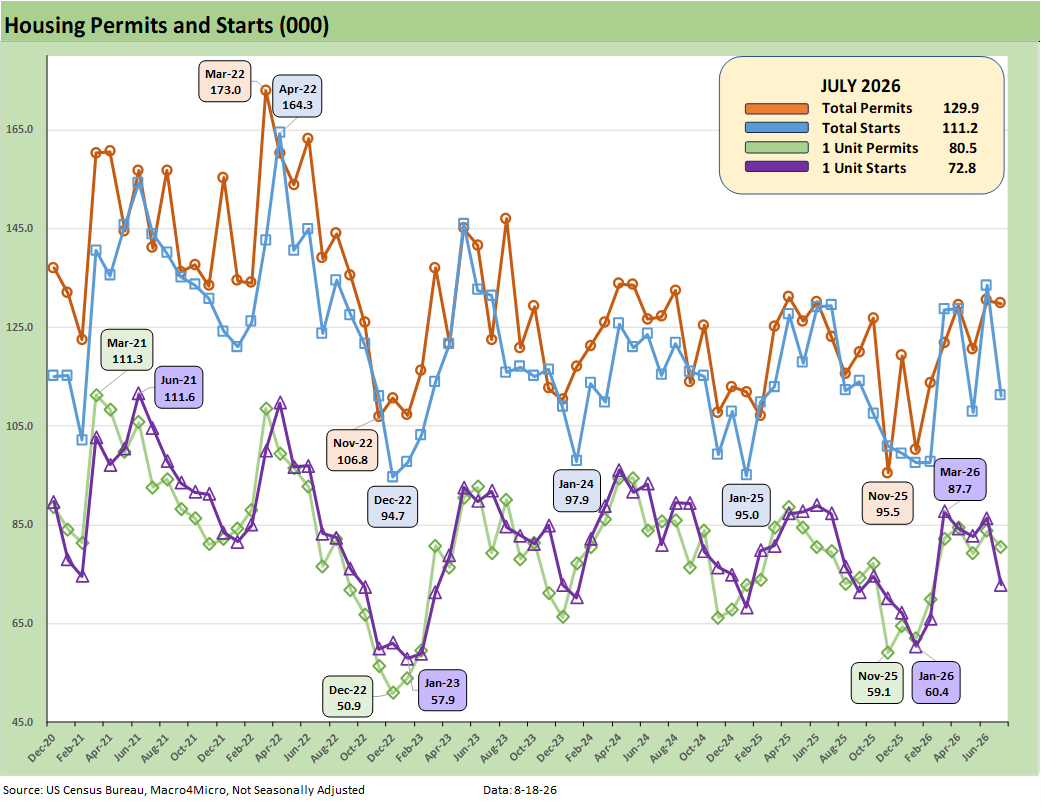
The above chart plots total permits and total starts and single family starts and permits on a Not Seasonally Adjusted (NSA) basis. NSA is viewed as closer to what is going on in the trenches without the SAAR model assumptions.
For July 2026, we see NSA total permits +5.5% higher YoY. Single family permits were higher by +1.1% YoY. Total permits were -0.5% lower MoM with single family permits lower by -3.9% MoM.
For total starts and single family starts on an NSA basis, we see total starts down by -14.1% YoY and down by -16.7% MoM. For single family NSA starts, the YoY deltas were lower by -16.7% while MoM was down by -15.6%.
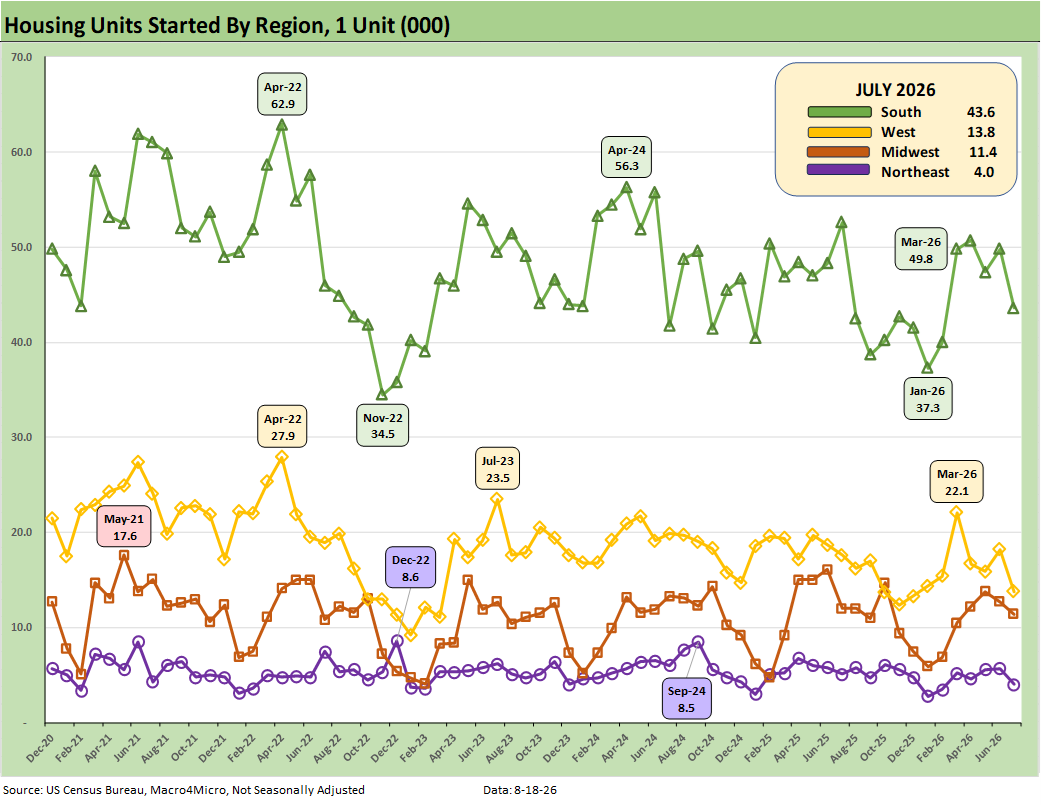
The above plots the single family starts by region (NSA). On a MoM basis, the critical South region (totals 50.6% of total NSA starts and over 59.9% of single family starts) was down in single family by -12.5% MoM and down by -17.1% YoY.
The West as the #2 single family market (16% of total) was down by -24.2% MoM. The Midwest region MoM in single family was -10.2% with the small Northeast market at -29.8% MoM. The YoY NSA starts were all lower.
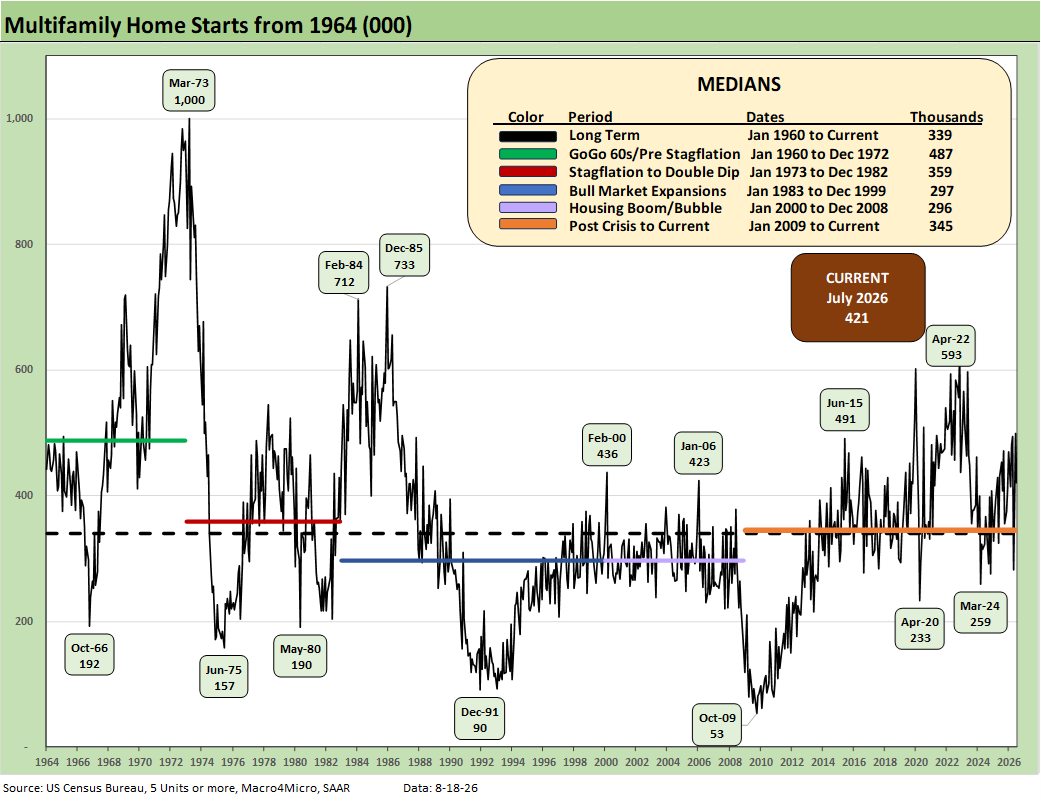
The above chart updates running multifamily starts. At +421K (SAAR) for July 2026, multifamily starts decreased by -15.6% MoM from June after a massive rise in June over May. The 421K is still substantially above the +282K in May and below the 494K of April. The decline in May was an outlier.
The 421K for July is well above the long-term median of 339K but below the highest timeline median from Jan 1960 to Dec 1972 of 487K. That 1960-1972 period was when the urbanization boom was ongoing.
The 1960s was a period of explosive growth for multifamily with the back end of the baby boom, the postwar rise of urbanization, and the high racial migration from the South to the North all part of the multifamily tailwinds. Immigration also played an important role.
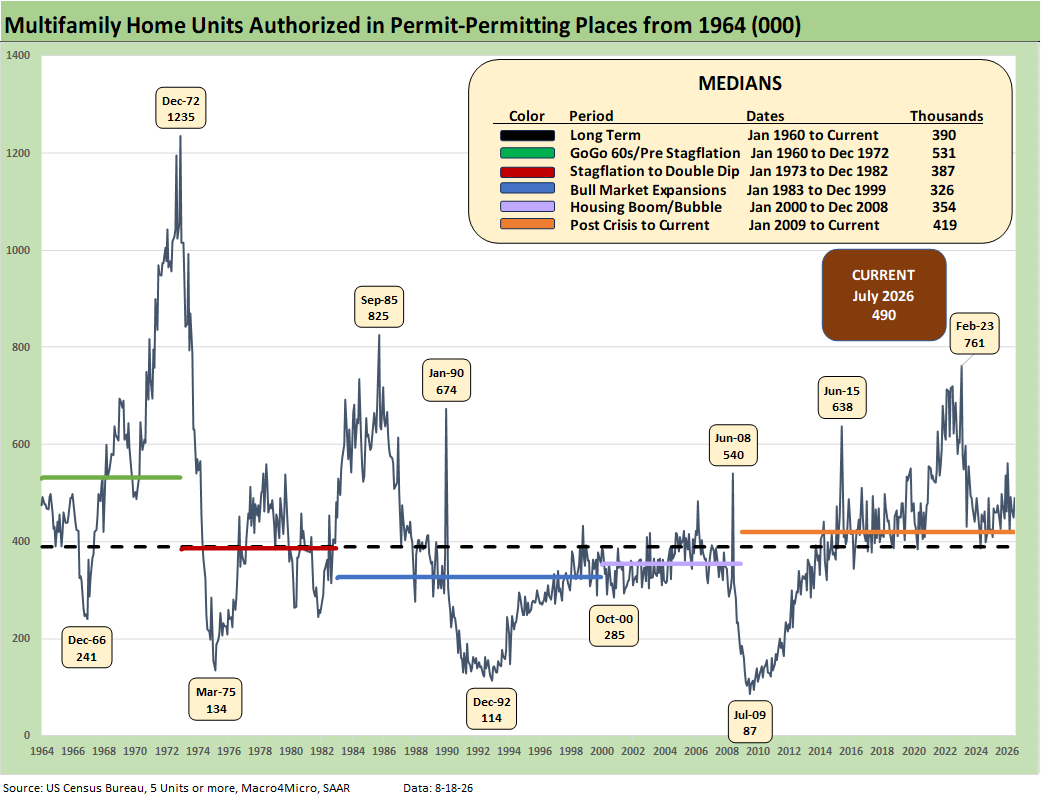
The above chart updates Multifamily permits (SAAR). The 490K in July 2026 multifamily permits rose by +9.1% MoM and was up by +6.3% YoY.
The bottom line on home starts as we move further into the peak selling season is that 2026 was already shaping up as a mediocre year at best for homebuilders. Now the numbers are trending even worse with mortgage rates under a cloud and builders overall growing defensive in working capital management on higher interest rates and pressure on costs.
See also:
Industrial Production July 2026: Resilient, Steady, Hopeful 8-18-26
Market Commentary: The Curve 8-17-26
Market Commentary: Asset Returns 8-16-26
PPI July: When Lower is Better but Still Bad 8-13-26
CPI July 2026: Slight Breeze, No Chill 8-12-26
The ChatGPT Living Wage Test 8-11-26
Existing Home Sales July 2026: Slow Row 8-11-26
Payroll Deltas July: Mixed Bag, Mediocre Numbers 8-9-26
The Curve: Steeper, Inflation Anxiety Remains 8-2-26
Employment Cost Index June 2026: Inflation > Wage Growth 7-31-26
June 2026 PCE: Inflation, Income, and Outlays 7-30-26
2Q26 GDP: Good Underlying Numbers Despite Headline 1.5% 7-30-26