

A little help please…
Declining volumes ran alongside a slight uptick in inventories and a sequential decline in median home prices to below the $400K line to $393.8K vs. $403.1K in June 2026 and $397.3K in July 2025. That is a rare decline below $400K over the past 4 years.
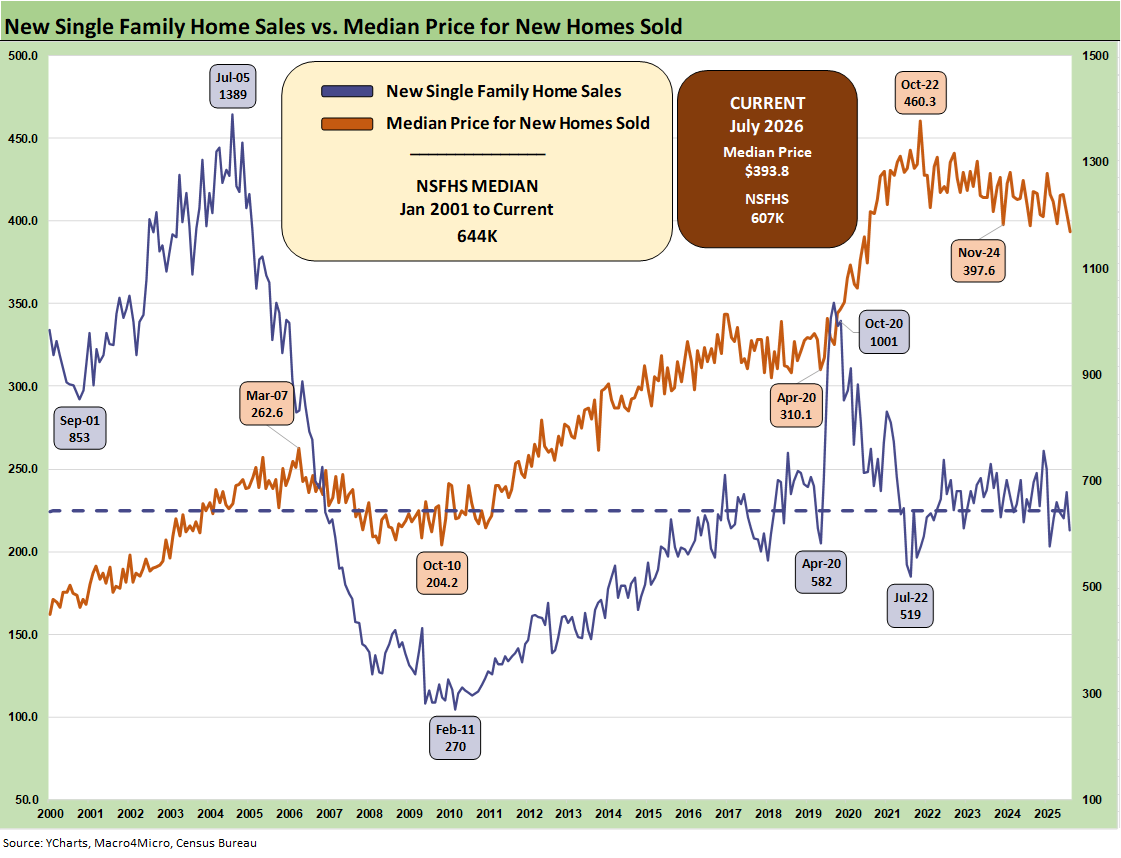
The 607K SAAR units for new home sales is the 2nd lowest over the past year with only Jan 2026 lower at 576K.
The critical South region (63% of sales) was down -13.0% MoM and -5.2% YoY while the #2 region in the West (23% of sales) was up by +6.2% MoM and posted +2.2% YoY. The smaller Midwest market (7% of sales) was down sharply by -42.7% MoM and -50.6% YoY. The Northeast (7% of sales) rose by +30.3% MoM and +95.5% YoY.
The homebuilders will now face the added challenge of a wide array of tariffs on material costs to go with high mortgage rates. Whether it be tariffs on supplies from Canada or latitude provided domestic suppliers to raise prices with less Canadian competition (and soon Mexican?), life will stay challenging for builder margins.

The above chart updates the new single family home sales series from 1963, and the current 607K (SAAR) is below the long-term median (636K) despite the more favorable demographics and pent-up demand in this cycle. That gets back into the affordability debate around both price and monthly payment pressures as well as the tight supply of entry level and starter homes. The current UST curve and cost pressures from tariffs will not help there.
The median of 989K in the housing boom/bust cycle from 2001-2009 is 63% higher than current volumes. As we look back to the peak of the housing bubble, we see 1389K in July 2005 at over 2x the July 2026 volume. The COVID panic buying and relocation spree in Aug 2020 saw sales of 1036K in a wild period for new home sales and home starts in a ZIRP market with very low mortgage rates. The market today is facing much higher prices since COVID and 30Y mortgage rates that ended at 6.74% this week (Mortgage News Daily survey).
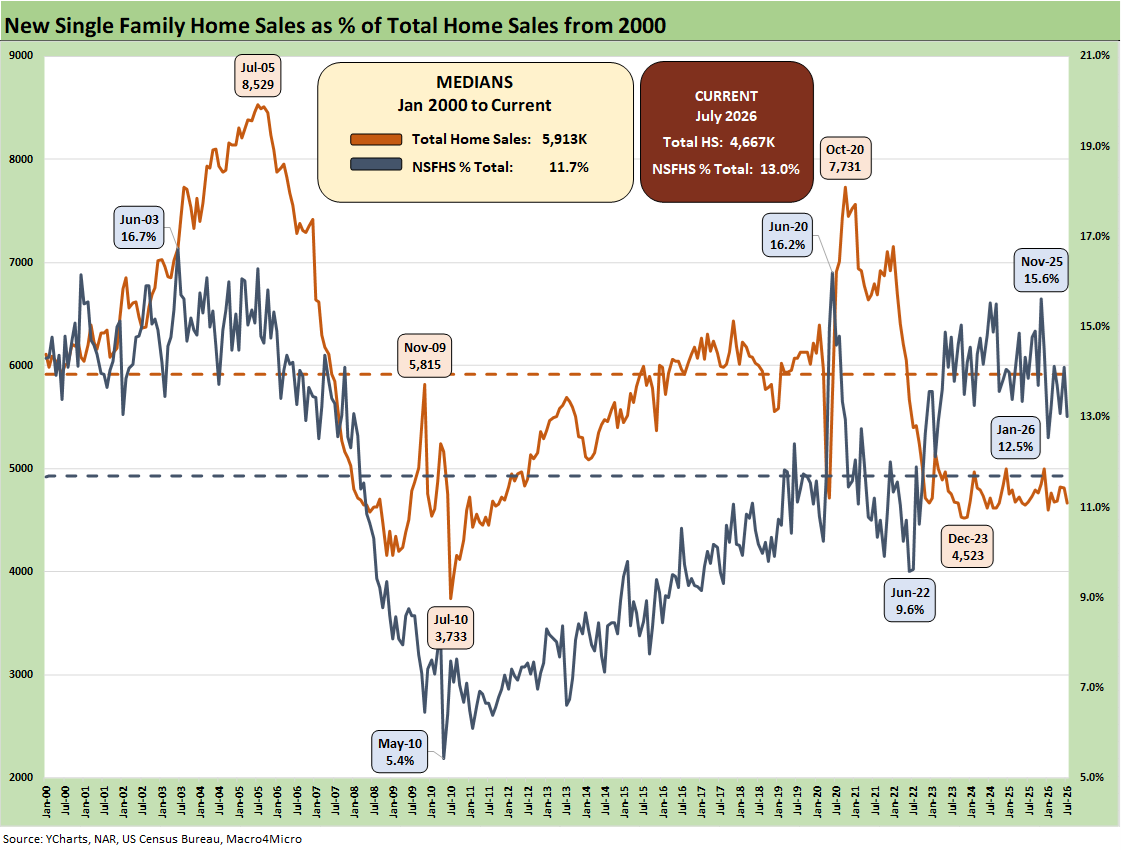
The above chart plots the share of total home sales (new + existing) that were captured by the “new home” builders. We see the share is now at 13.0% vs. the long-term median of 11.7%. When inventory is scarce, the right home at the right price wins. The challenge overall for new home sales has been mixed for builders by region.
Major homebuilders generally continue to report gross margin compression in 2026 and guide to similar expectations for the year. We see lower prices from the builders even if that comes with the asterisk of product tier and geographic mix.
The market edge for closing a sale favors builders vs. existing home sales (note: existing is still the vast majority of sales volume). Homebuilders have the ability to use incentives and financing support (see Existing Home Sales July 2026: Slow Row 8-11-26), and the homebuilder can tailor packages to close sales.
Given the mortgage rate headwinds undermining volume in the existing home sales market whether “golden handcuffs” or a challenging monthly payment bar to clear for many, the shortage of existing housing inventory at economic all-in costs (price and mortgage rates) has been a recurring drag on that side of the home sales tally.
In new home sales, the gap between the expectations of the seller and buyer is easier to bridge through the incentive programs or the ability to offer variations in home design and specs to make a transaction work.
The new home sales volumes are softer with total new homes down by -6.3% YoY. Prices posted this month dipped back below the $400K line. The 10Y UST is the key benchmark for the direction of 30Y mortgages and that has been moving in the wrong direction YTD despite some relief this week (see Market Commentary: The Curve 8-24-26). The hot headline today is a potential deal between Oman and Iran to get a plan in place on the Strait. We see WTI off by -$2.65 per bbl and the 10Y UST -8 bps lower.
The oil wildcard could potentially ease pressure on the longer end of the curve, but that has been erratic around policy actions, the Iran vs. Trump dynamics, and on-off progress in striking a deal on the Strait of Hormuz. Trump needed to get into the headlines on the Strait today with these other headlines, so he spoke about mines now being cleared and warning Iran not to plant any more.
The CPI, PCE and PPI inflation metrics have been grim despite the inflation easing in June and July showing some mixed progress (we get July PCE inflation this week). May saw headline numbers over 4%, but June-July are seeing comparative energy relief sequentially even if YoY numbers remain ugly for energy (see PPI July: When Lower is Better but Still Bad 8-13-26, CPI July 2026: Slight Breeze, No Chill 8-12-26, June 2026 PCE: Inflation, Income, and Outlays 7-30-26).
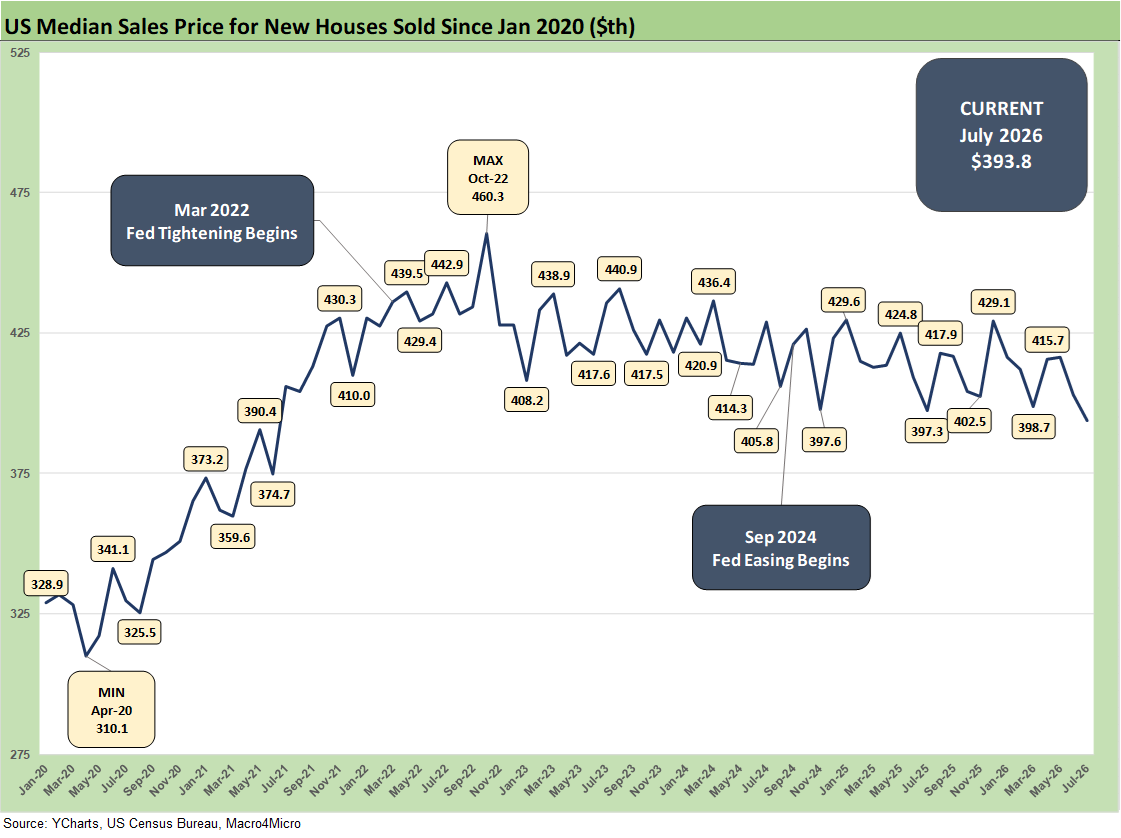
The median home price time series tells a simple story that prices had been under modest pressure after a period of record highs and a long stretch over the $400K threshold with a few dips below the $400K line. We had a dip below that threshold in June before being revised this month to $403.1K. July shows another move below $400K at $393.8K.
The move lower can have a lot of contributing factors from mix to region, but a decline is consistent with the major builders reporting. The South’s lower ASP mix can factor in as a lower ASP region, but the “South” by itself has a very wide range as well. The South posted a -13.0% sequential MoM decrease in volumes (-5.2% YoY) in July while the West was higher by +6.2% MoM (+2.2% YoY).
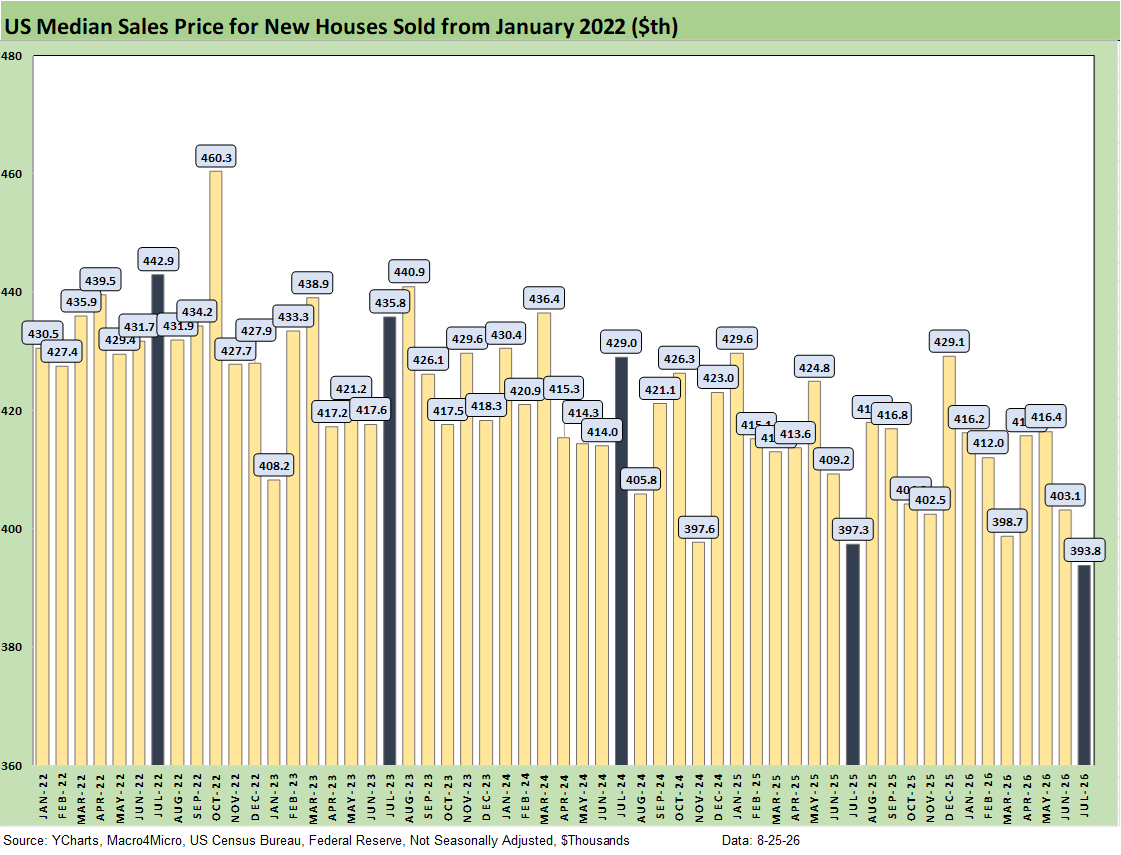
The above chart gives a different visual angle on the median new home sales prices from early 2022. That is a lot of $400K handles with some sub-$400K outliers. The $393.8K in July 2026 is the lowest in the mix.
The price metrics can shift with regional mix as well as home price tiers and related supply issues. The affordability question is still more intertwined with the monthly payment pressures from mortgages. It is about more than price. Those monthly payments are very sensitive to mortgage rates more than home price moves.
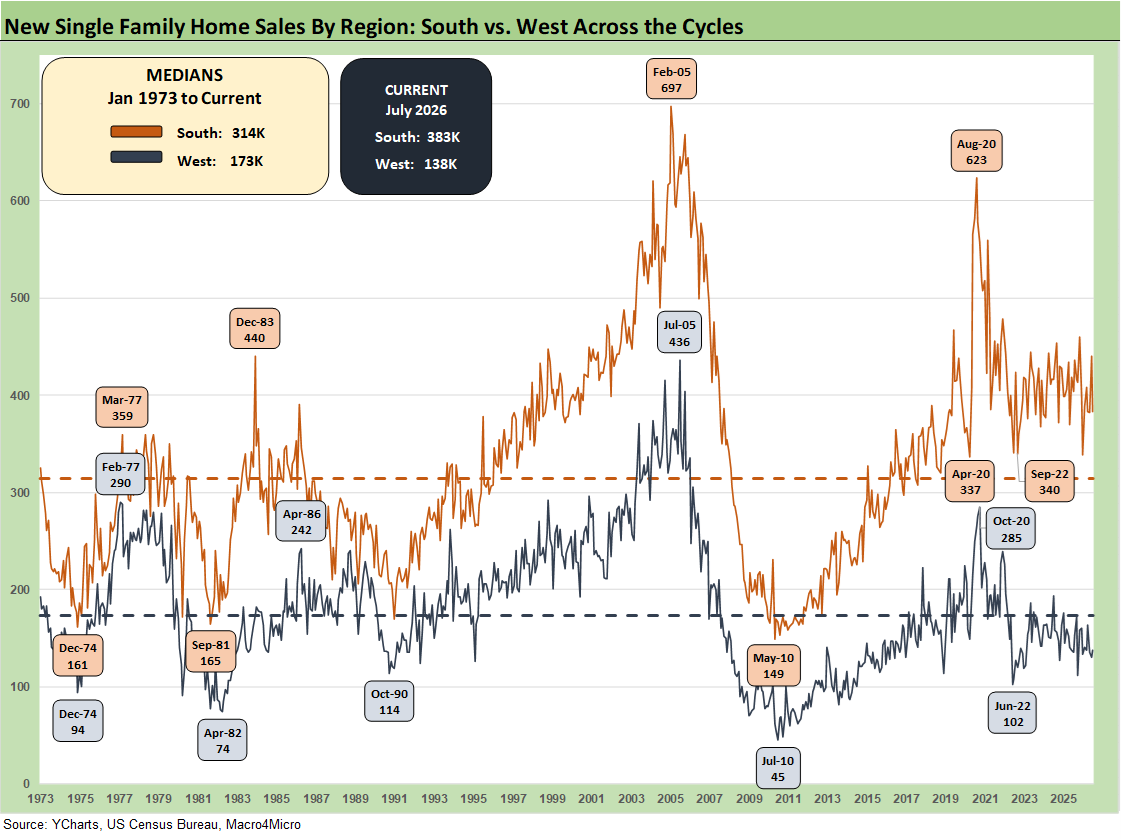
The time series above updates the new single family home sales across the cycles since 1973 for the #1 and #2 regions of the South and the West. The 383K for the South is around 63% of the total of all single-family new home sales (SAAR) and marks a sequential decline of -13.0% from June 2026 and is down by -5.2% YoY.
The West at 138K is 23% of the total. For the month, the West was higher by +6.2% sequentially and by +2.2% YoY. The South is running ahead of the long-term median of 314K while the West is materially below the median of 173K.
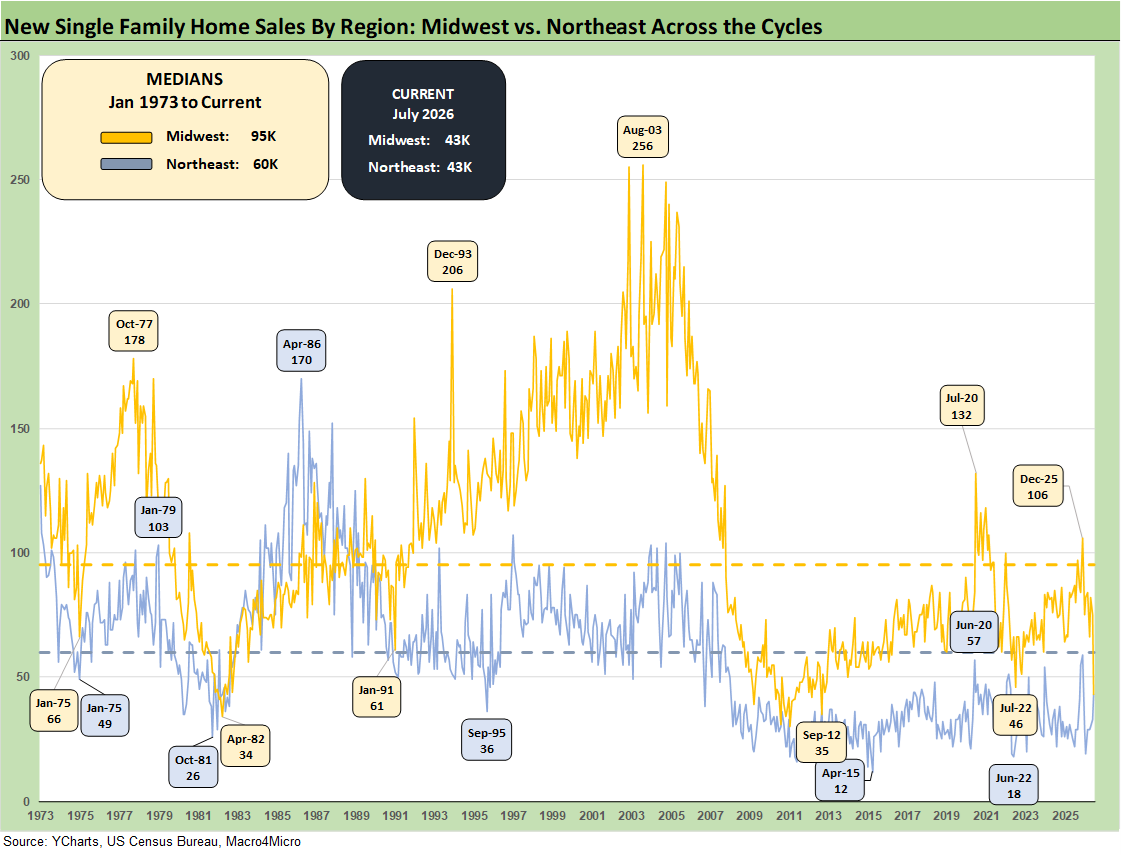
The timeline for new home sales for the smaller Midwest and much smaller Northeast market is detailed above. The Midwest (7% of July total) was -42.7% sequentially and -50.6% YoY. The Northeast market (7% of total) was +30.3% sequentially and +95.5% YoY. Both of the two smaller regions showed dramatic variance this month.
See also:
Market Commentary: The Curve 8-24-26
Market Commentary Asset Returns 8-23-26
US-Canada: Benches Ready to Clear 8-22-26
US-Canada Tariffs: Protection Racket 8-19-26
Housing Starts July 2026: Grim Numbers 8-18-26
PPI July: When Lower is Better but Still Bad 8-13-26
CPI July 2026: Slight Breeze, No Chill 8-12-26
The ChatGPT Living Wage Test 8-11-26