


Let’s “low key it” for a while…we know the plan.
We detail another favorable yield curve shift this week that could be set to head in the other direction when CPI and PPI are released after a very strange mood swing in the White House (“low-keying it”). The latest twist leaves the geopolitical backdrop as uncertain as ever after escalating Iranian demands were made that amounted to “get out and stay quiet (Or more literally STFU to Trump).” That may not play well for too long.
The week moves into CPI and PPI mode on Wed-Thurs as oil also starts to climb on the latest round of Iranian shell games (except the shells explode). With WTI crude oil back over $82 and Brent just under $88 as we go to print, the real pressure is still over in refined products during peak driving season with diesel and aviation fuel still ugly.
The bond ETFs were all positive this week with mortgage rates still a headwind at just under 6.8% and monthly payment strain still a major problem for affordability. Existing home sales get reported this week along with retail sales for a fresh round of cyclical signals.
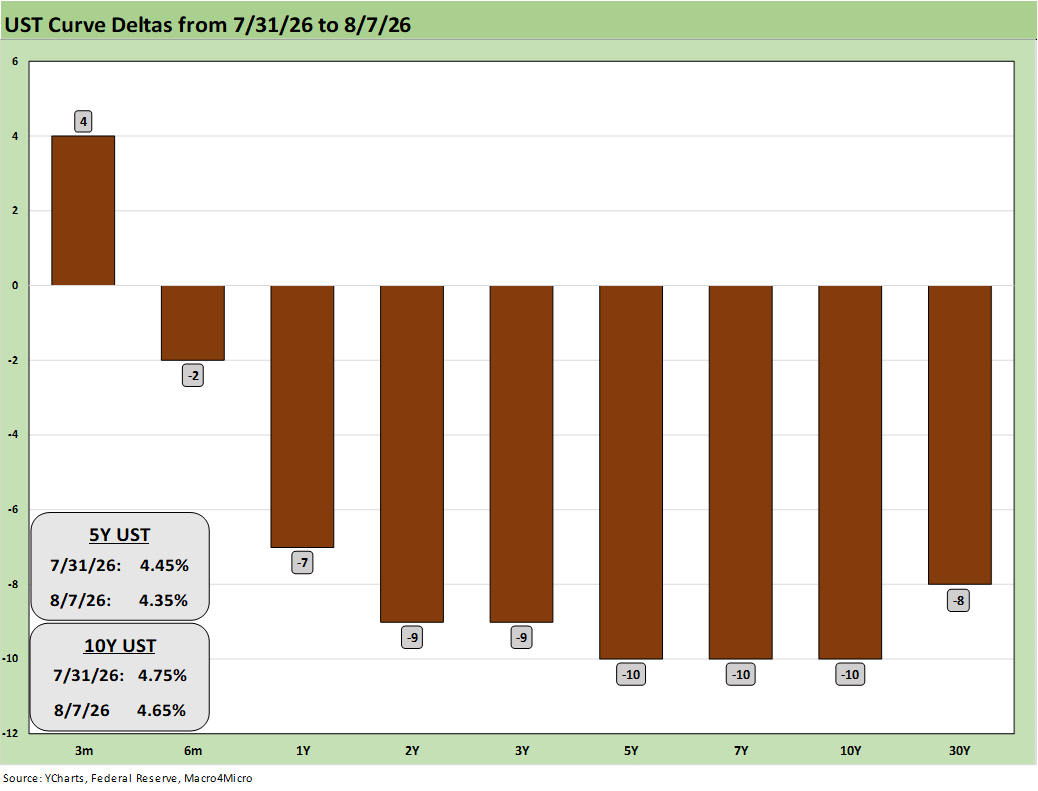
The above UST deltas frame the weekly changes as of Friday. Today (Monday) was a minor move higher with the 5Y UST (4.41%) and 10Y UST (4.71%) ticking higher.
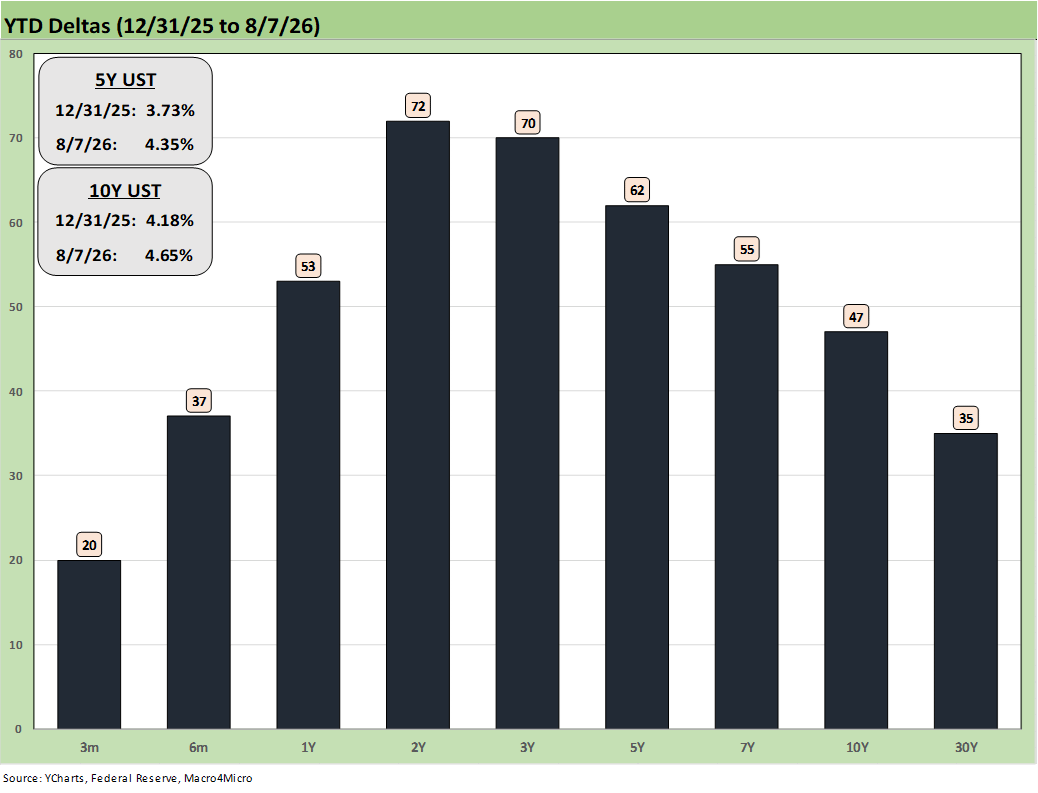
The YTD UST deltas tell a tale of FOMC tightening fears in the 1Y and 2Y UST move, but the 30Y UST has been catching all the headlines with comparisons to more troubled times. The 30Y UST is at 5.25% as we go to print.
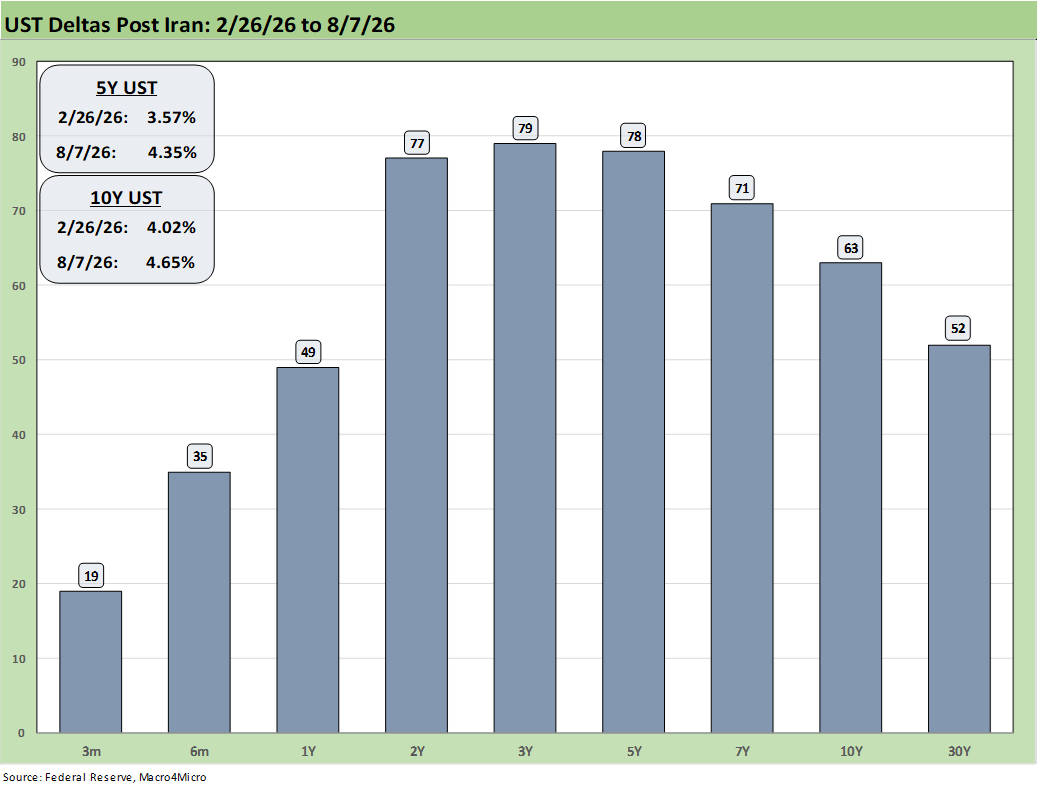
The post-Iran UST deltas show a bear flattening from 2Y to 30Y, and there is no hiding from the cause, which is not Biden. The UST pressures come from the policies of Trump, Iran effects, and tariffs along with decent growth in demand in the economy. The annual GDP growth in 2025 under Trump was materially lower than 2024 GDP growth under Biden (see 4Q25 GDP: More Adverse Revisions in the Golden Year 4-9-26).
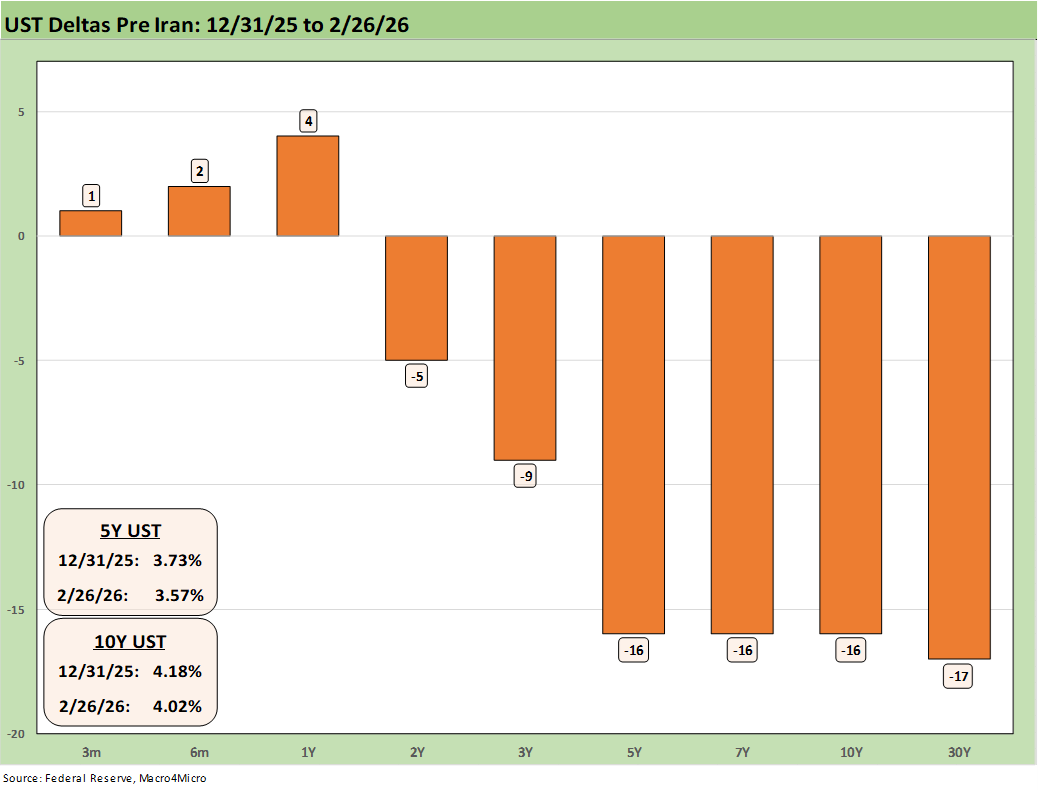
The pre-Iran UST deltas hammer home that life was better before Iran, but the “imminent nuke threat” will be repeated over and over to mask and distract attention from more than just the adverse UST moves.
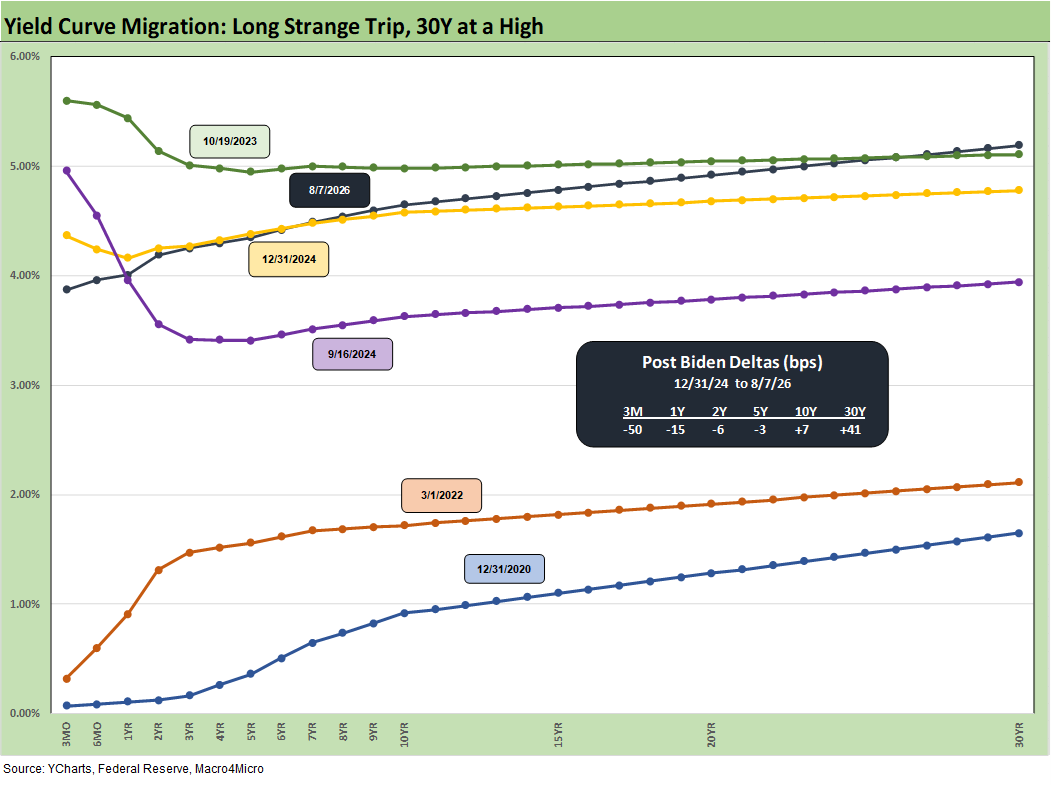
We update the UST curve migration that we reviewed in more detail in a recent commentary (see The Curve: Steeper, Inflation Anxiety Remains 8-2-26). That 9-16-24 curve will make it hard for Trump, Bessent, Hassett et al. to talk about their great UST curve management. Trump won the election a few weeks later and the next round of inflationary pressures and UST supply anxiety went into overdrive. The ugly bear steepener ensued in 4Q24.
On the long end, the UST curve is out near the fall 2023 highs when mortgages hit a cyclical high with some mortgage surveys nearing 8% and with Freddie Mac in the high 7% range (see Footnotes & Flashbacks: State of Yields 10-21-23).
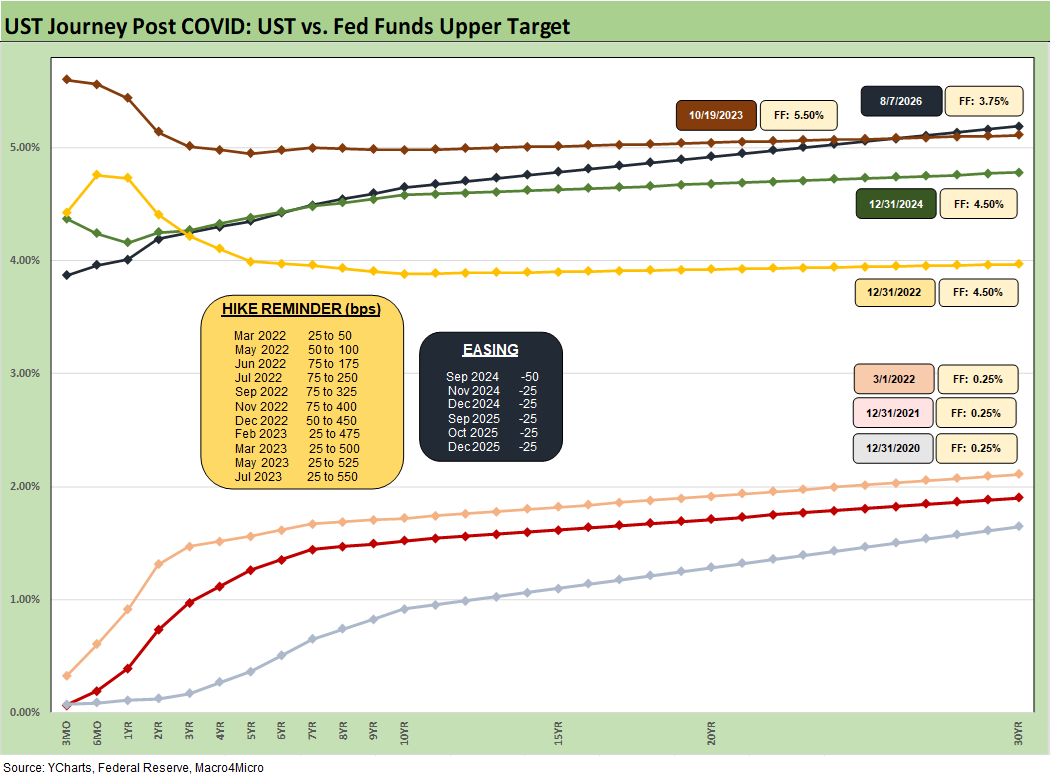
The above chart is one we include as a memory jogger on the troubled journey from COVID and ZIRP across the tightening and easing cycles. We see the shift after March 2022. This timeline cuts across the easing in Sept 2024 that defied many predictions of a bull flattening in 2025 and instead moved into a bear steepener.
The FOMC oddsmakers (CME FedWatch) are calling for fed funds tightening by year end with the “steep vs. flat” outcome to be heavily influenced by views on oil and new trade clashes and tariffs. Many eyes are also looking out for any hint of wage pressures that have not shown up at all at this point (see Payroll Deltas July: Mixed Bag, Mediocre Numbers 8-9-26).
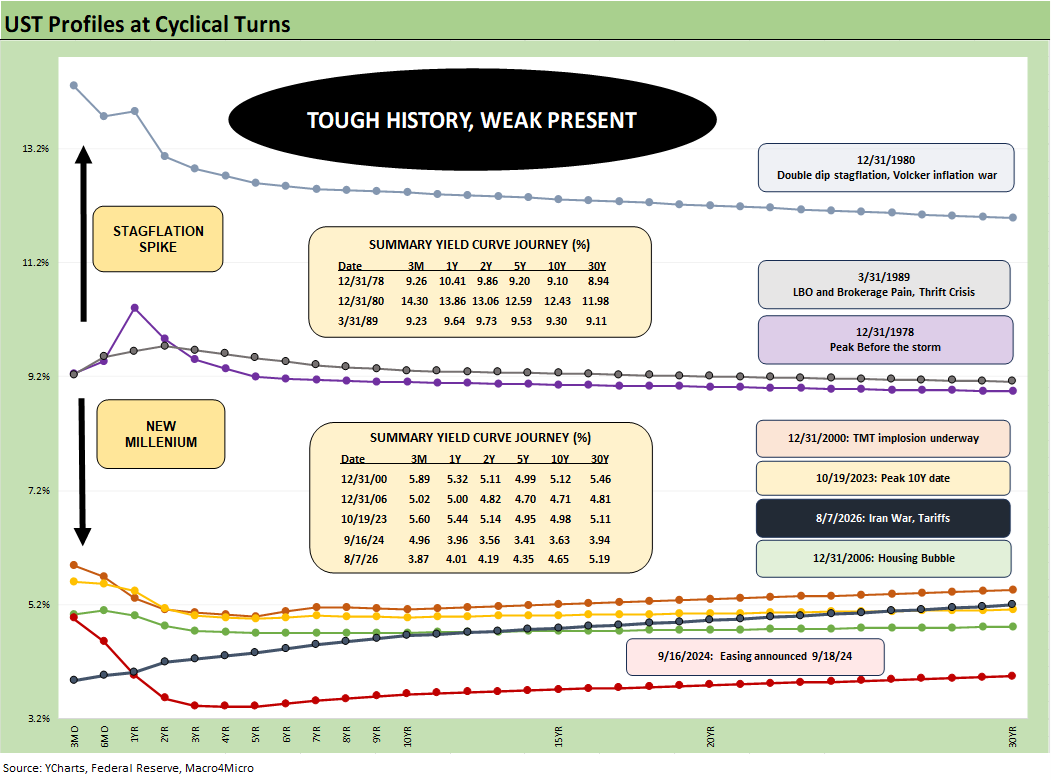
The above UST history revisits the shift from the Carter inversion and peak of 1978 across the stagflationary 1980-1982 double dip that kicked off with an Iranian oil crisis in 1979. We see the 9-16-24 UST curve sitting on the bottom, but we suspect Trump, Hassett, and Bessent will not be flagging that memory.
One of the key takeaways is that flat curves that arrive after some FOMC tightening in a cyclical peak can lead to trouble. That is especially the case if we start to see an inversion. Credit market peaks such as the transition across 1989 into 1990, the move into 2000 after a +86% NASDAQ year in 1999, and the tail end of 2006 on the way into 2007 all make for some interesting compare-and contrast-drills.
We look at some of these histories in the links at the end of this commentary.
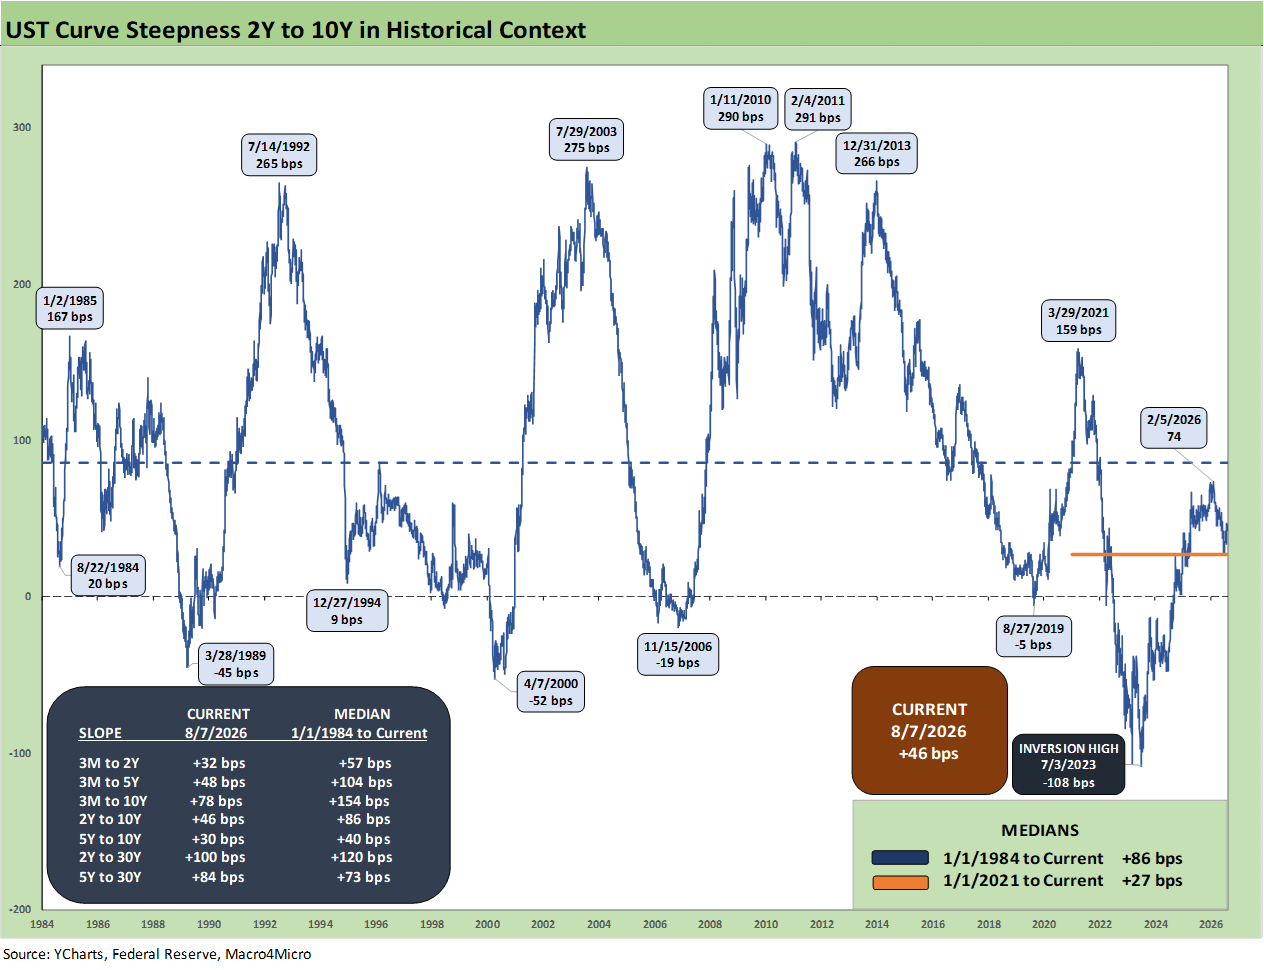
The above time series updates the 2Y to 10Y across the cycles. We see the current +46 bps slope running well inside the long-term +86 bps median from 1984. The peaks and lows are noted with the current fear likely to be more about an upward shift if the Fed tightens and oil rises sharply during a time of resilient cyclical demand in fixed investment and a recovering consumer (see 2Q26 GDP: Good Underlying Numbers Despite Headline 1.5% 7-30-16, GDP 1Q26 Final: PCE Growth Plunge 6-25-26).
The AI capex boom may lead to inflated stock valuations, but demand is solid all along the chain from materials to equipment and a wide range of finished goods and services (financial, freight, and logistics, etc.).
That firm demand is going to be hard to derail even if the stock market loses confidence. The economic activity is buzzing. An AI reassessment is when the market might start to see contraction risk, but it is hard to see that now and into 2027. Lead times and backlogs are a fact of life.
The missing ingredient for material inflation increases has been wage pressure, and recent releases are showing negative real wage growth (see Employment Cost Index June 2026: Inflation > Wage Growth 7-31-26). There will be lead time to get there.
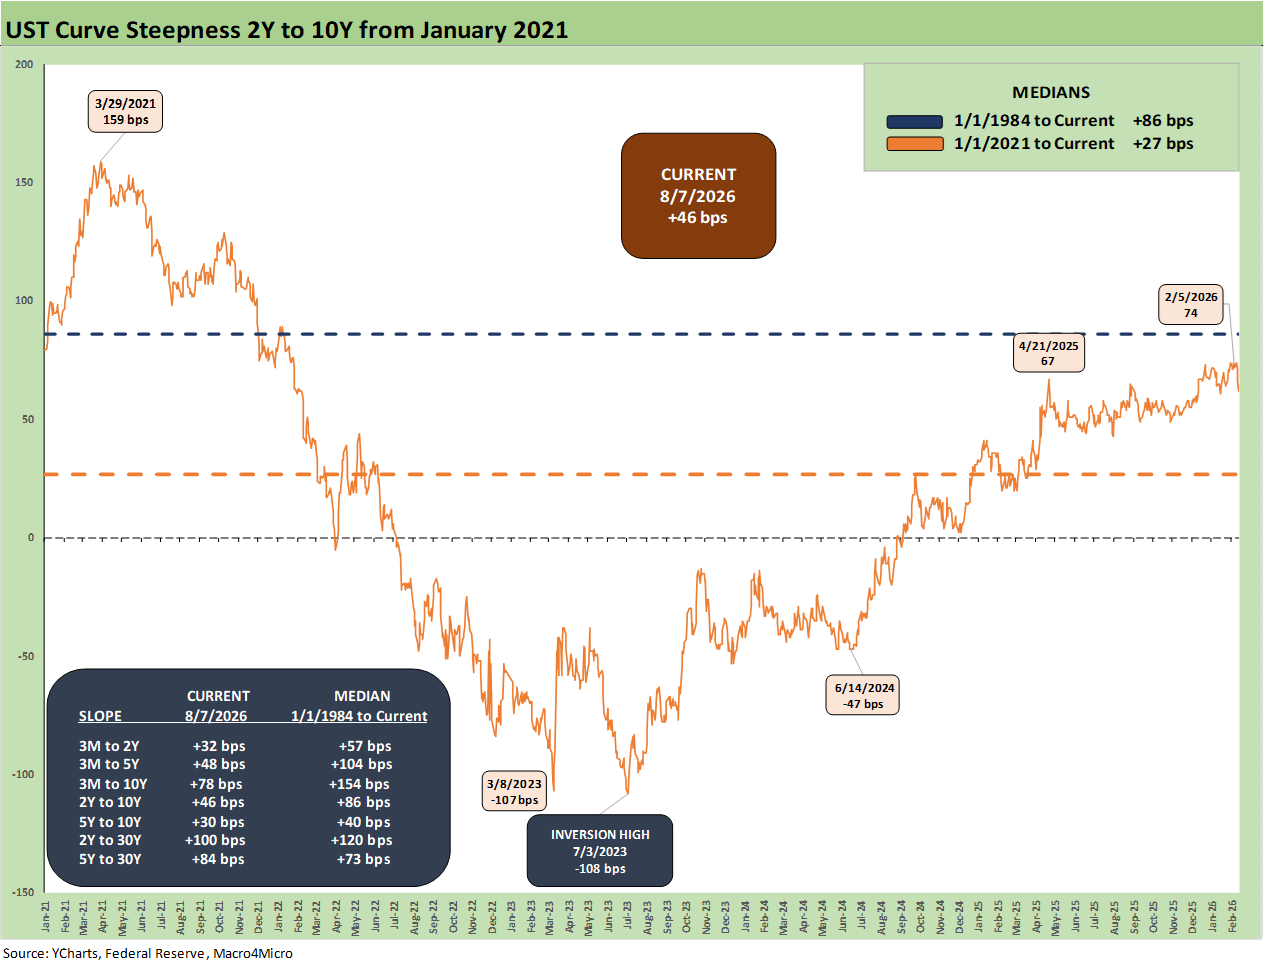
The above 2Y to 10Y UST slope chart shortens up the timeline to get a better view of the moves from the ZIRP boom year of 2021 across the ensuing inflation spike and tightening cycle and then into the steepening period of 2025-2026. At +46 bps, the history shows plenty of room for more UST steepening in the market.
Some UST curve histories:
Business Cycles: The Recession Dating Game 10-10-22
UST Curve History: Credit Cycle Peaks 10-12-22
Bear Flattener: Today vs. 1994 and Aftermath 10-18-22
Fed Funds, CPI, and the Stairway to Where? 10-20-22
Greenspan’s First Cyclical Ride: 1987-1992 10-24-22
UST Curves: Slope Matters 10-25-22
Greenspan’s Last Hurrah: His Wild Finish Before the Crisis 10-30-22
Wild Transition Year: The Chaos of 2007 11-01-22
UST Slope Update: Some New Inversion Highs 12-8-22
Yield Curve Lookbacks: UST Shifts at Cyclical Turns 10-16-23
UST Moves 1978-1982: The Inflation and Stagflation Years 10-18-23
Here are my Jul CPI estimates which have been better than Wall Street's about 70% of the time:
https://arkominaresearch.substack.com/p/jul-2026-cpi-estimate