Footnotes & Flashbacks: State of Yields 10-21-23
A fresh round of painful steepening ignores flight to quality.

After a week that elicited more than a few superlatives around the UST markets, it is safe to say that the UST curve steepener has been playing out in force and taking its toll on duration and driving some equity market fallout.
One question is whether we have finally reached a crossroads on the duration trade with the Fed likely in a holding pattern or perhaps one more hike to go subject to the next few rounds of inflation data and econ indicators.
The Powell speech was sufficiently mixed to keep the argument going, so the question will still turn back to term premiums and which curve segments remain more vulnerable to the “steepening toward a flattening” effects that have been a focus for months among those who don’t see a recession pulling in the driveway.
With a frothy GDP expected by many this week and street forecast revisions biased higher of late, questions of more upward UST migration vs. a flight-to-quality effect on geopolitics still have to be framed in the context of a massive supply of UST borrowing ahead that could get even higher with a war footing (or at least war readiness) in the prep stages.
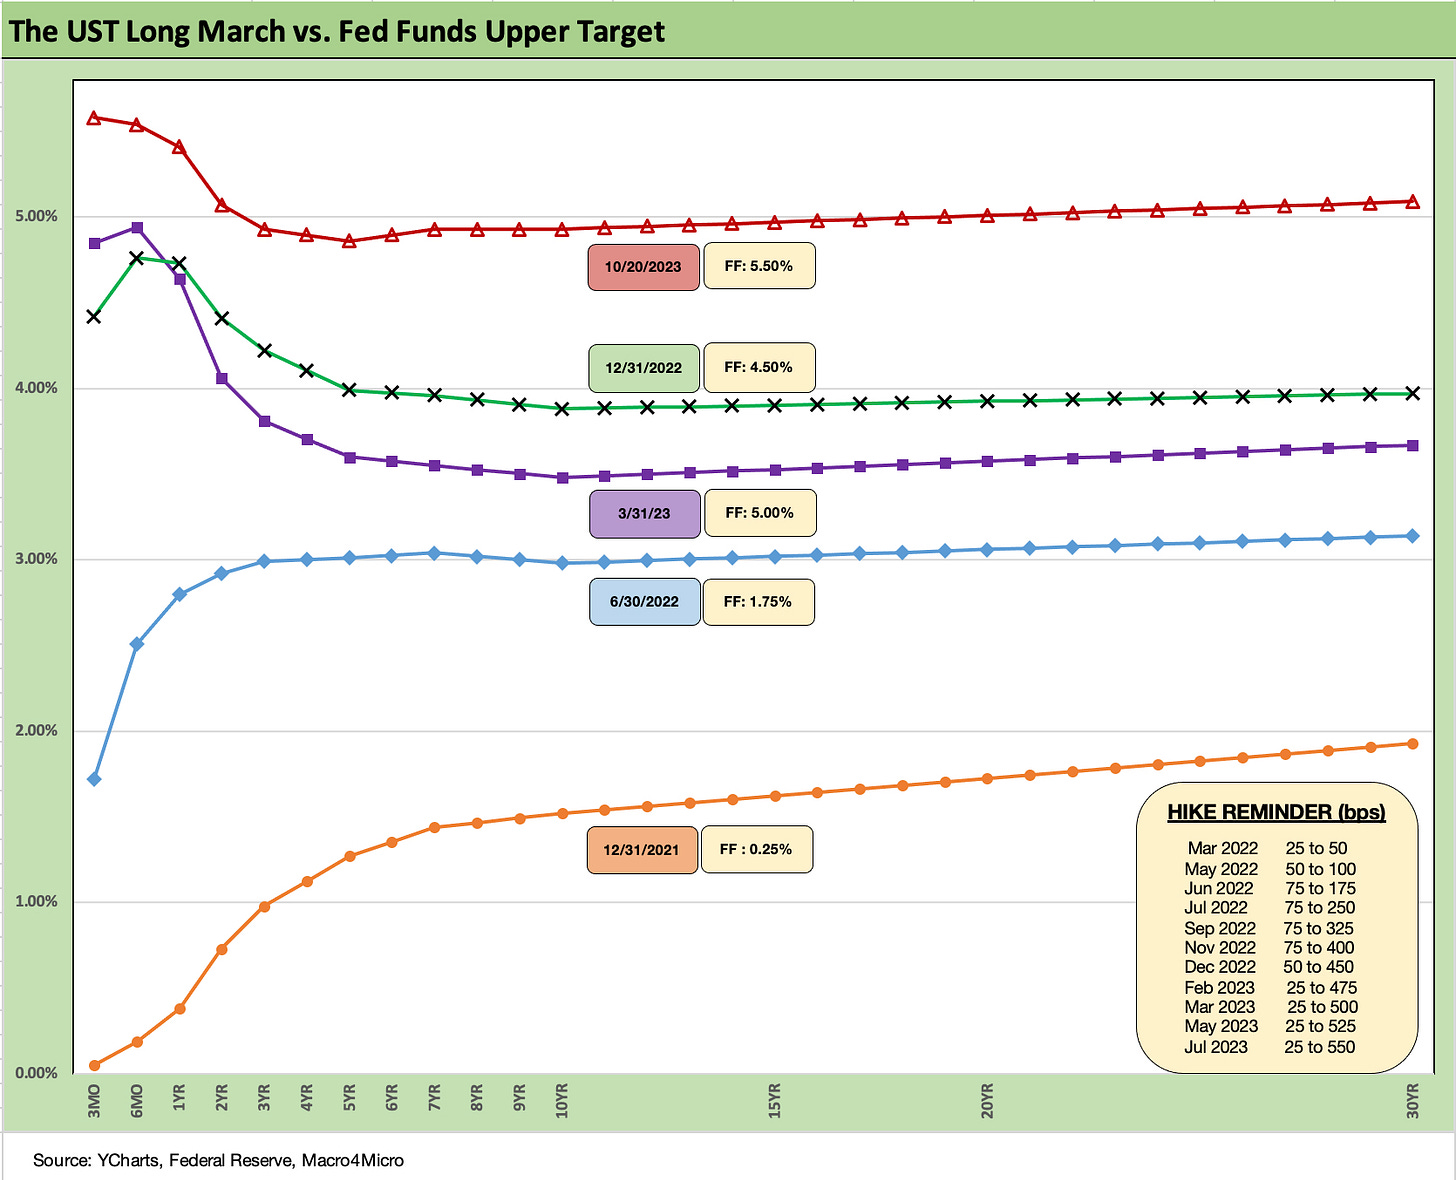
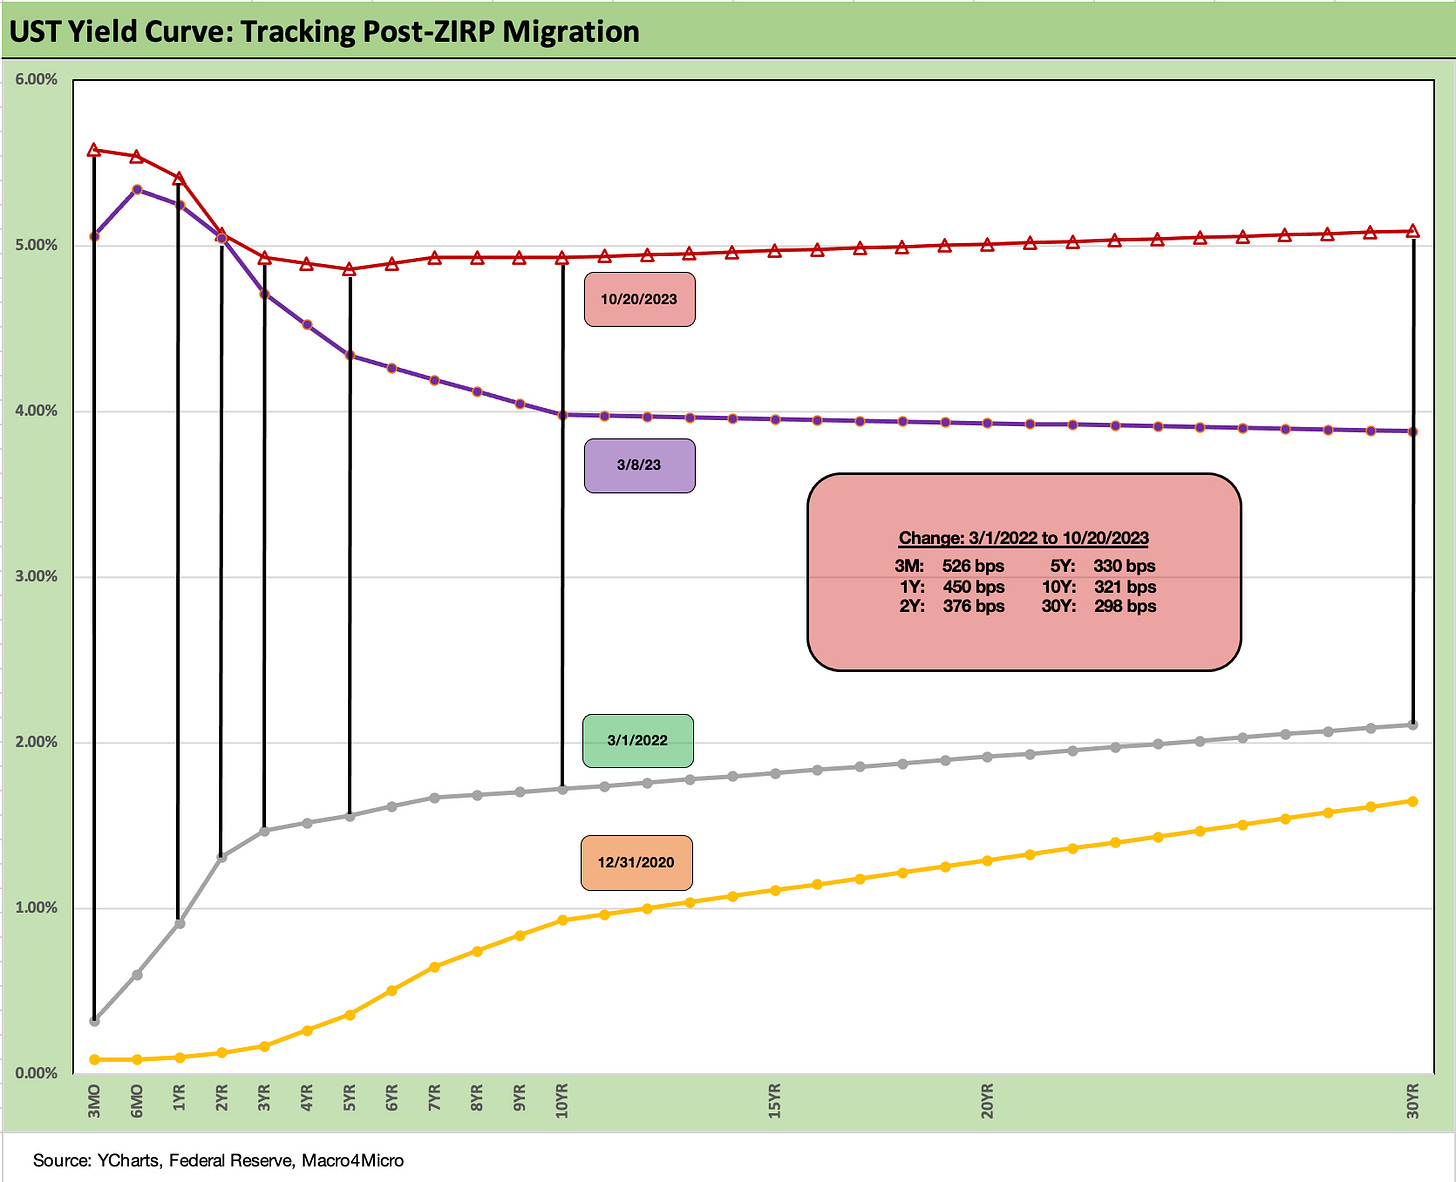
The UST curve has been dominating the story line for equities this past week once again, and the market has put flight-to-quality effects on the sidelines for now. The above chart plots the path of the migration from the end of 2021 through current days. The journey has been a long one but especially rapid and pronounced from the end of 1Q23 to today.
Last fall there was a lot of talk about inversions, recessions, pauses and cuts. The strong consumer, positive effects of various legislative initiatives and the need to run positive real fed funds has moved most away from last year’s thought process. Every day is a new day for the axed.
With geopolitical risks rising sharply this week on the hospital explosion, we are seeing levels of protest in the streets more like the Arab Spring than the more usual Middle East protests. That is going to raise the stakes for polarization of parties and less middle ground. The evidence clearly supports the fact that the hospital was hit by terrorist rockets, but as one reporter restated from the old quote collection: “A lie can travel halfway around the world before the truth can put its boots on.”
The US has plenty of experience with big lies that stick in biased brains despite evidence to the contrary, and this is now the high-stakes geopolitical version. The event did serve to galvanize more protests and add more pressure points for the military clashes to escalate. The anger factor arms Hezbollah and Iran with more to play with subject to their ambitions to exploit the situation.
The aims and motives of Iran and terrorists are a constant, but the situation awaits the next major move (ground invasion, etc.). It will just have to play out, but the issue has infected NATO ally Turkey and rolls some loose (and unreliable) allies of convenience back on their heels. If more parties get involved directly in the fight, that is when scenarios around oil prices, impaired economic activity, and defense budget issues will get a lot of airtime.
UST supply matters, but it takes a budget…
The relevance to the UST markets is that the developments make a major defense and domestic security budget of considerable size more important and more front loaded. That means bigger deficits that are already being upsized in various forecasts this past week. The headlines showed a $1.7 tn budget gap that was up 23% and that will get a lot of political focus in the speaker and budget battle. The geopolitical situation also means more immediate timing on the next round of outlays. The trillions add up after a while.
That in turn rounds back to a House Speaker process that went from limping to crippled to potentially dying this week as Jim Jordan fell short as the second replacement who could not get the votes (Scalise was first). The Jordan process only ended after more damage was done with some “GOP on GOP” violence, both literal and figurative, creating more obstacles and ill will for the next round. One GOP spouse cited a need to sleep with a gun under her pillow after death threats from Jordan fans. Another (a hard-core right wing House member) got an eviction notice for his office from a landlord who wanted Jordan.
The inability to find a speaker will see the Nov 17 deadlines for the continuing resolution budget creeping up quickly. The ability to get even that done is not clear. These side events tend to bring too much “human” to the human nature variable.
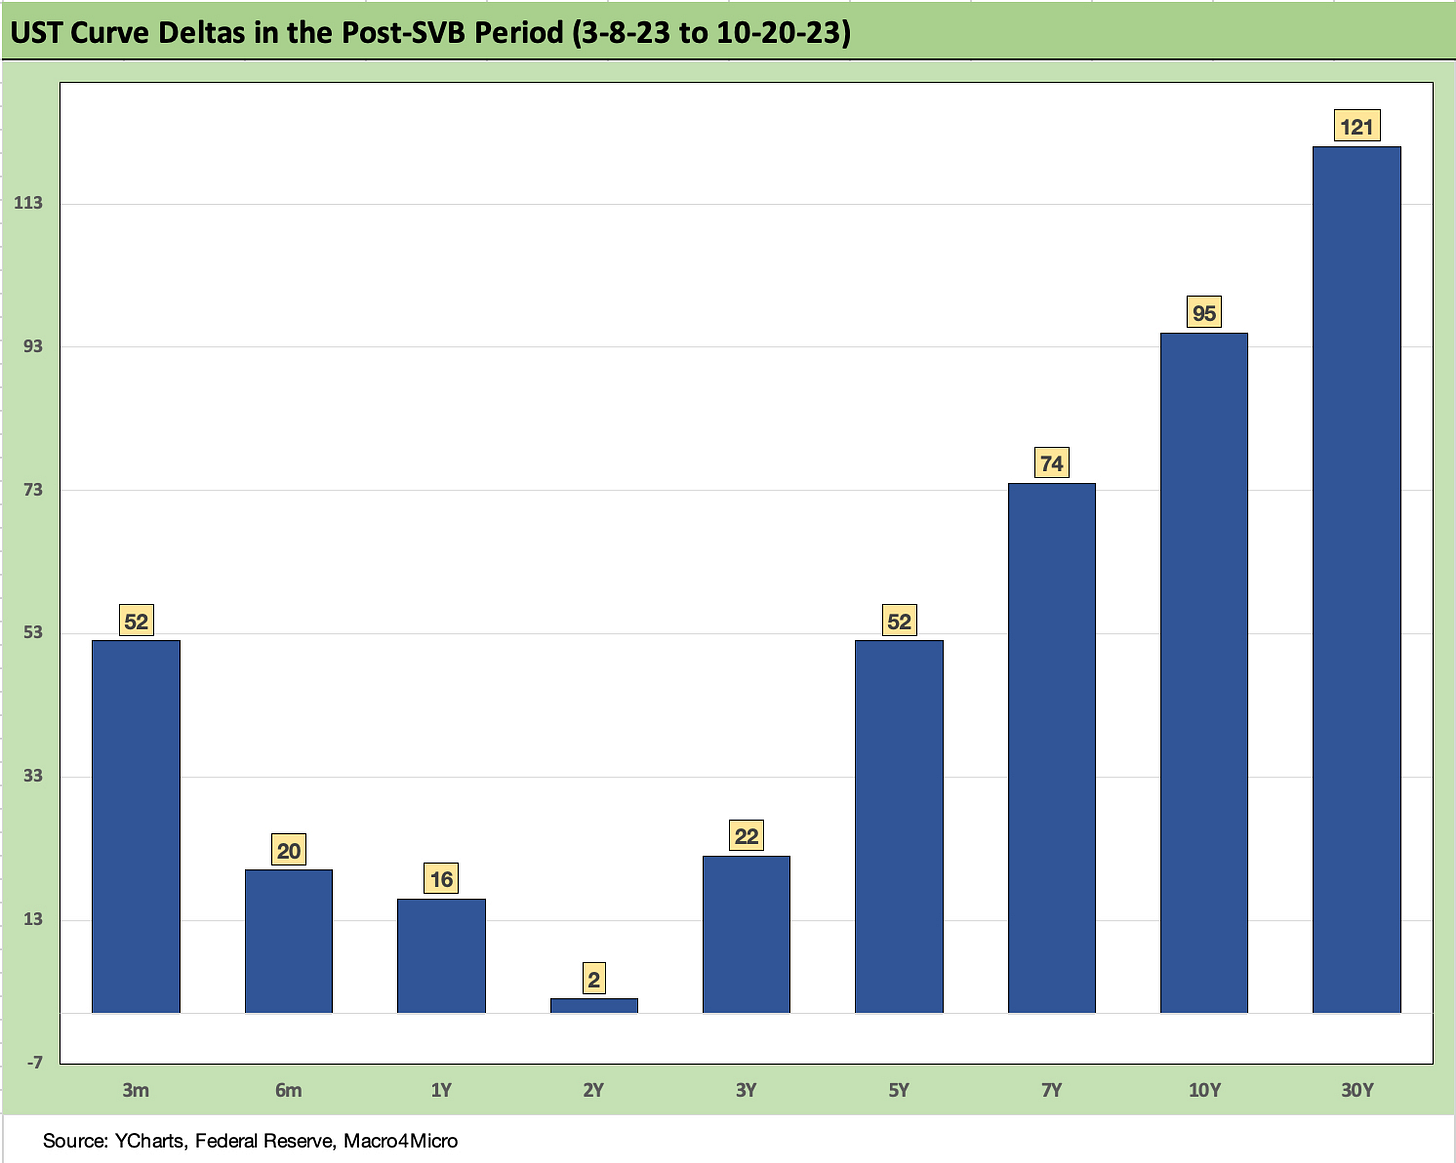
The above chart details another week of steepening of the UST curve in another round of duration pain despite a small rally on Friday. These were very sharp moves on the long end and generated a lot of “highest since” headlines.
When you consider the protracted ZIRP after the crisis and then COVID, that takes some of the headline value out of the “highest in 16 years” significance. Absolute rates in historical context are not that high. It was the speed of getting here for portfolios where the coupons had been refinanced and repriced.
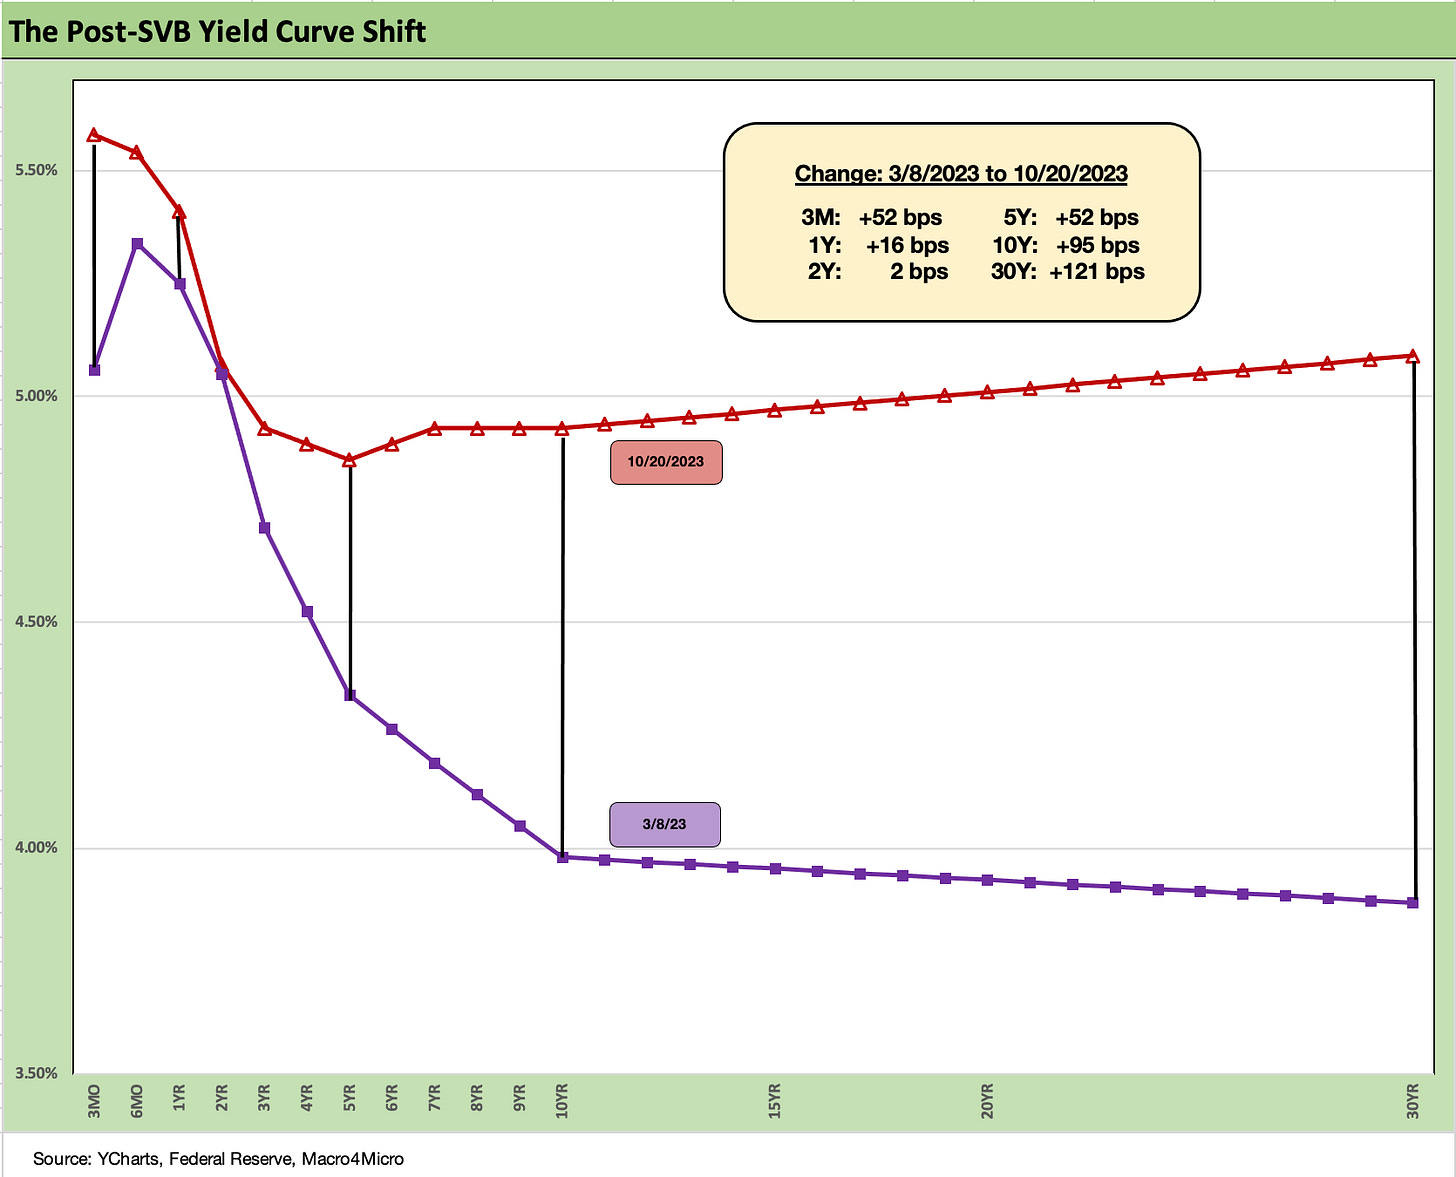
The above chart updates the post-SVB chart from March 8, 2023, which was the last “clean” trading day before the Silicon Valley meltdown sent regional banks into a “push-button run” on deposits. That led to a mini-crisis around how to frame bank system liquidity risks (see Silicon Valley Bank: How did the UST Curve React? 3-11-23, SVB Reprieve: Hail Powell the Merciful 3-12-23). The pressure on financing margins are a problem when short rates are rising and deposits need to be competitive with the UST market.
The potential for earnings pressures and weaker asset quality are still hot topics and were again this past week with some regional banks showing mixed results (including unsurprisingly higher provisioning needs). That regional bank challenge is still a debate with asset quality setbacks often coming at a cyclical lag in commercial real estate. As we cover in the ETF section of the separate Footnotes publication for asset returns, the Regional Bank ETF (KRE) had a bad (not terrible) week.
The above chart takes the post-SVB UST curve deltas and drops them into a visual UST curve format. Again, the story is clear enough as the curve is higher and steeper beyond 5Y UST and 10Y UST. We highlight the 5Y and 10Y and 30Y with vertical lines and include the deltas in the box.
The UST curve has moved from a bear inversion into a bear steepening that is chasing flat. The more the Fed remains anchored and the more the curve wants to move toward flat and a more normalized term premium, the more duration investors will be spooked. Add in a bigger war challenge in the Middle East, higher oil, slower fixed asset investing, and a more defensive consumer and that could change. That will not be what we see this coming week for the first 3Q23 GDP read on the headline number.
The PCE release this week will bring more color to the market on personal income and outlays and not just the inflation numbers.
The above chart updated the 30Y Freddie Mac mortgage benchmark and the current UST curve. We also drop in the UST curves and Freddie mortgage levels for two periods from the housing boom and bubble. We include the year end 2005 as the peak homebuilding year and the middle of 2006 when the “liar loan” phenomenon and subprime excess was cresting.
In 2006, subprime was starting to show some cracks but not yet sending the credit markets into a case of nerves. That would take more quarters to go by. Even then, equities only folded later.
It is notable that our UST curve is now well above the end of 2005 in 10Y UST but below the middle of 2006. Despite that UST configuration, the 30Y mortgage levels are well above 2006 and pulling away. The actual levels across a wider expanse of mortgages and fee structures hit 8% this week (see Sept Existing Home Sales: The 7% Solution Running Low 10-19-23). That was a psychological smack.
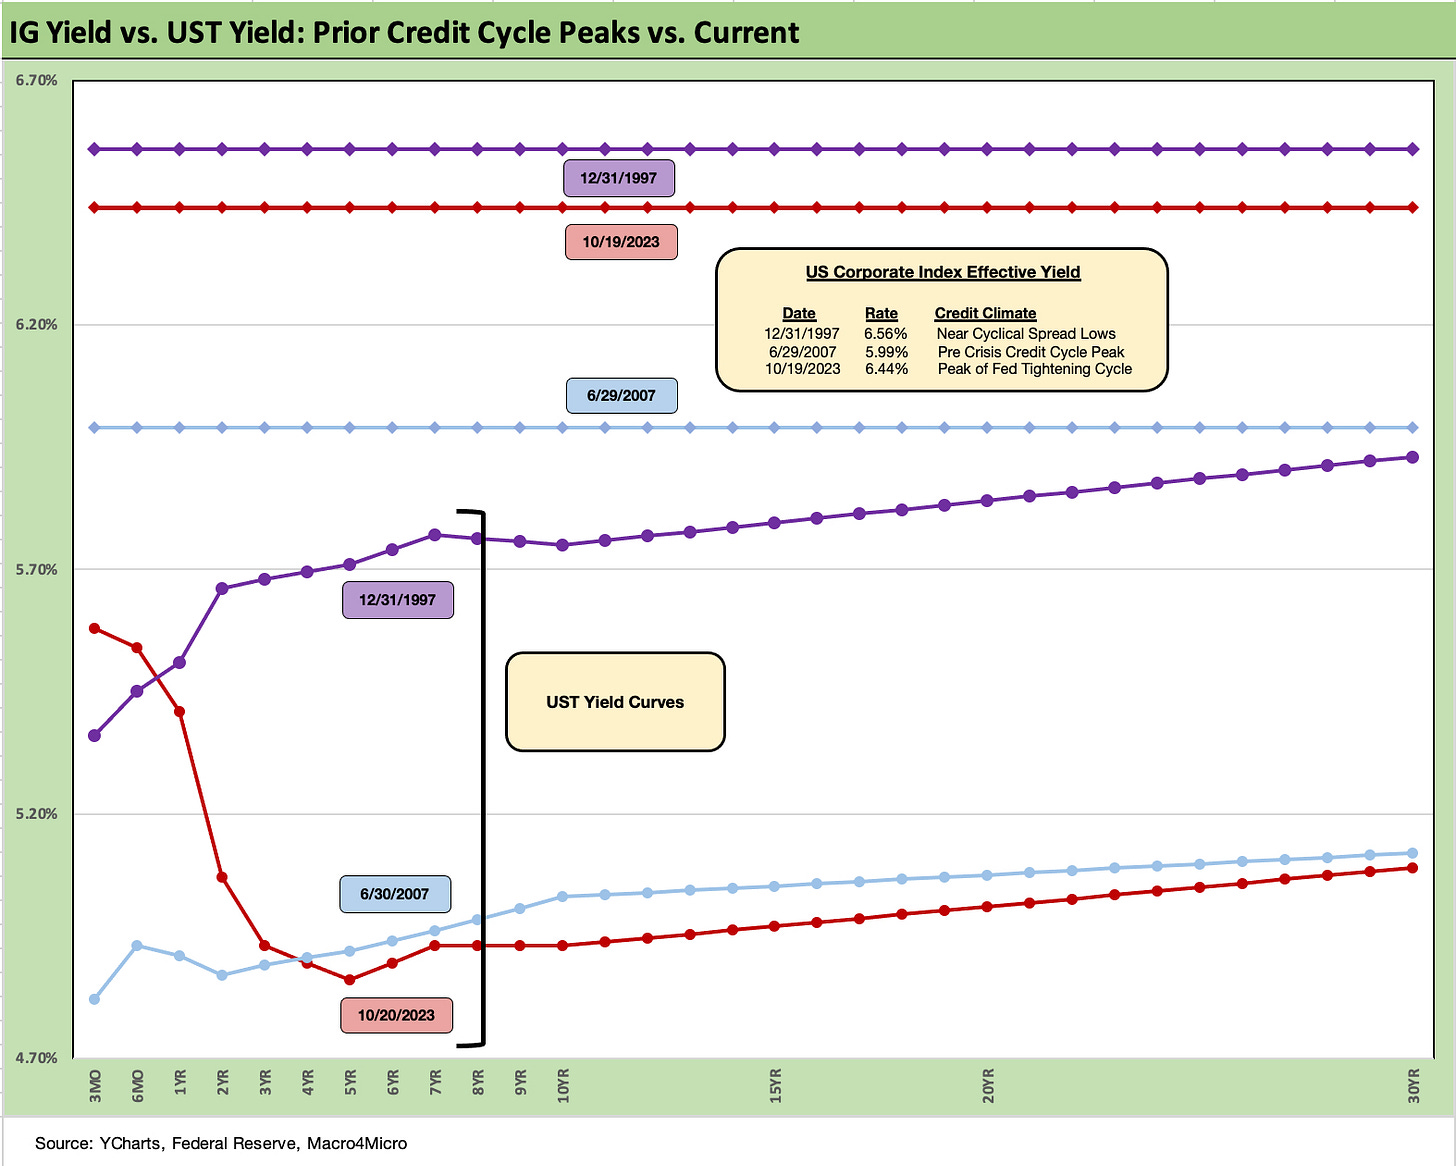
The above chart goes through a similar exercise for the current UST curve and IG index yield for current days vs. two periods where the market was at or near spread lows.
Spreads were much tighter in those peak periods relative to the +133 bps to close last week in ICE IG index. For the past week, IG spreads widened by 6 bps. The ICE IG index OAS is right in the area of the long-term median, so spreads are not wide to historicals.
The +70 bps for the index at the end of 1997 was much lower (the low was in Oct 1997 at +53 bps) and +100 bps at 6-30-07. The 1997 and 2007 periods were tight parts of the credit cycles. As we know, a lot can happen in a hurry even in IG as later 2007 and 2008 showed.
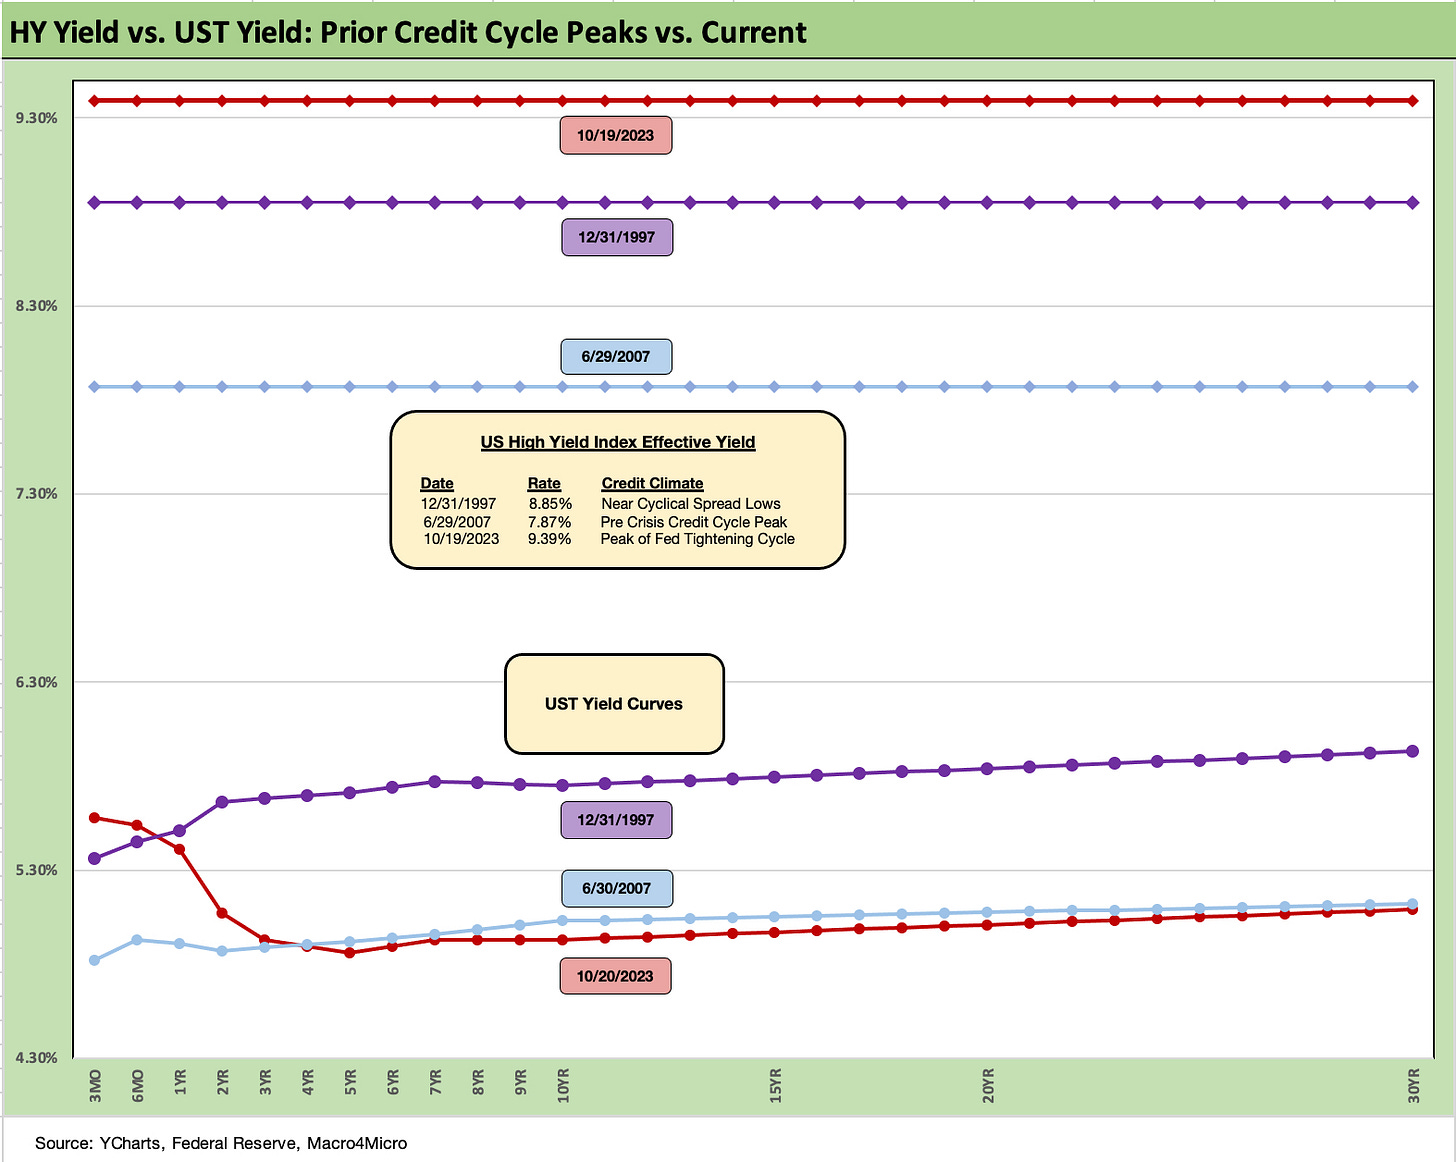
The above chart does the same drill for the US HY market as we did for the IG markets. We use the same dates to frame the symmetry of risks today. We see HY OAS back in June 1997 at +296 bps (12-31-97) although HY OAS had been inside +250 bps in Oct 1997 (+244 10-17-97).
During the crazy period of June 2007 as the market fuse was burning down, we saw HY OAS of +298 bps on 6-30-07 (as tight as +244 on 6-1-07) vs. the +452 bps to end the last week. HY OAS was +22 bps wider on the week. These levels are modestly below the long-term HY median, so there is a long way to go if the market gets sloppier and the geopolitical risks head in an uglier direction.
The above chart updates the 2Y to 30Y slope. We use the short-term timeline from Jan 2021, but we also include the long-term median.
We pick some slopes to update each week, and this one shows the impact of the UST steepening action with the 2Y to 30Y slope now back to positive after being -107 bps in July and -117 bps just ahead of the regional bank blowup. The slope, as recently as March 2021, was a positive +230 bps.
The long-term median is +129 bps. That is what scares UST holders and feeds ammo to UST bears. The idea is a continued economic expansion with the Fed anchored on the front end will push the UST curve steeper. The Fed moving lower on the front end would reassure the duration trade with the theories around a return to normal term premiums.
The above chart plots the 5Y to 30Y slope, which is another one that gets a lot of attention for the extension trade. We see that UST segment upward sloping now as noted. The +23 bps is back above the short term post-2020 median of +20 bps but well inside the +74 bps long term median from 1984.
The above chart updates the commonly watched UST slope curve of the 2Y to 10Y. The relationship remains inverted at -14 bps but is well inside the -108 bps of July.
The above chart wraps up our weekly yield curve recap as the market overall hit new highs in yields on Thursday with a little giveback on Friday. We plot the running migration and UST deltas since March 1, 2022 across the curve and detail them in the box. We plot the year end 2020 curve as a frame of reference.
Inflation is at somewhat of a standstill right now (depending on how you want to treat the dubious shelter metrics that are by far the biggest piece of the CPI index) and the long end essentially is back to flat with the 2Y UST.
The questions around where the 2Y to 10Y will migrate is a big variable just by virtue of the inversion from 3M, 6M, and 1Y levels. The 10Y drives 30Y mortgages and this week’s existing home sales data takes us back to 2008 crisis levels and 2010 home sales trough levels seen in the housing crash (see Sept Existing Home Sales: The 7% Solution Running Low 10-19-23).
Funding costs remain high for short-term borrowers such as consumer and auto finance while the cost of borrowing for M&A and long-term capex sees the economics of the decision changing. That in the end will flow into valuations of assets and the relative attractiveness of certain projects. That impacts borrowing volumes and in turn will translate into staffing needs across financial services as we are seeing already. A lot of action lies ahead.
Recent Research:
UST Moves: 1988-1989 10-20-23
UST Moves 1978-1972: The inflation and Stagflation Years 10-18-23
Yield Curve Lookbacks: UST Shifts at Cyclical Turns 10-16-23
Economics:
Sept Existing Home Sales: The 7% Solution Running Low 10-19-23
Housing: Starts, Completions Firm Sequentially, Permits Down 10-18-23
Industrial Production: Holding Pattern 10-17-23
Retail Sales: The Consumer is Alive and Well 10-17-23


