

The week saw an anxiety contest between those more worried about a tech correction vs. those concerned about Iran escalation and the potential for cascading macro fallout. The IBM headlines and selloff of -26% rattled the markets (who is next in earnings season?), and the Semiconductor ETF (SOXX) posted a -10.2% week.
The risks of oil prices heading higher were largely shaken off by the UST curve with WTI over $82 to end the week vs. $71+ the prior Friday. As of later Sunday night, we see $84+ WTI. The UST curve moved lower on the week, but the broad benchmarks were all negative with NASDAQ, the S&P 500, Russell 2000, and Midcaps all in the red.
Banks reported exceptional earnings with the underlying business color offering reassurance on asset quality and the state of the consumer.
This coming week brings minimal macro releases but a major wave of earnings including Alphabet, GM, Tesla, and some key bellwethers in homebuilders (D.R. Horton, Pulte) along with some important consumer finance bellwethers (Synchrony, Ally, Amex).
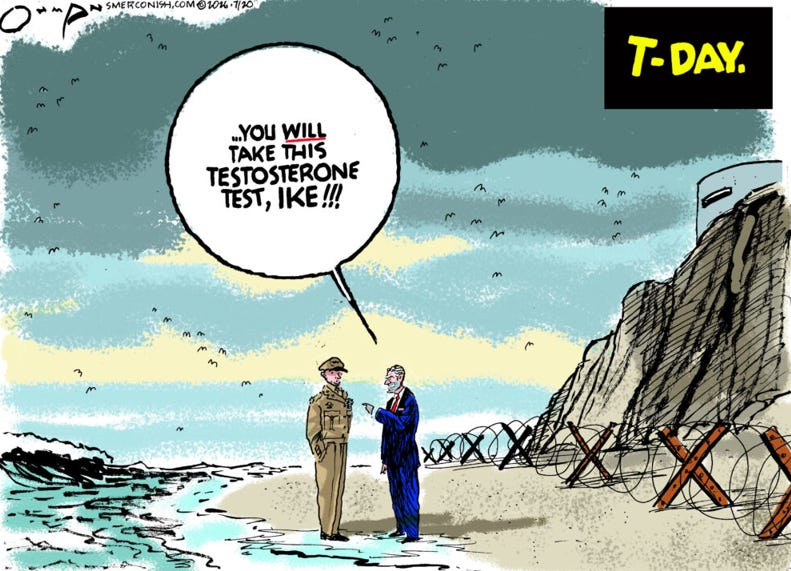
A more distant worry on the list that is well behind a tech correction, Iran, and lurking pressure on inflation was Hegseth’s concerns around testosterone counts in the military (character and courage we assume is important). We could not help but wonder what Hegseth would have said to 5 foot-5 inch, 112-pound Audie Murphy.
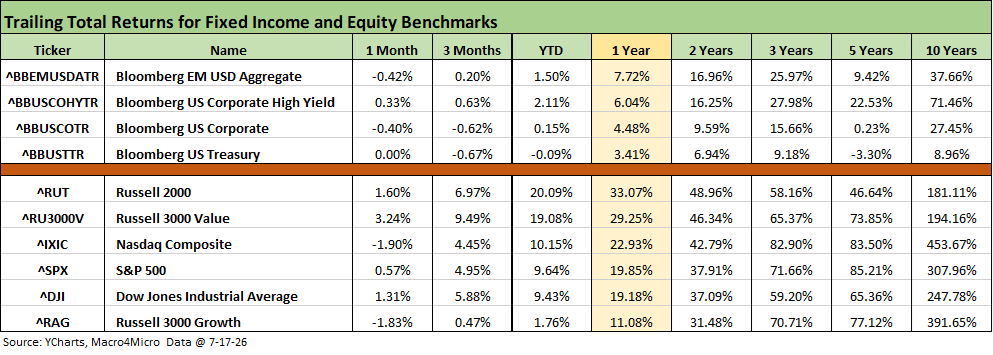
The above table updates the running timeline returns for the debt and equity benchmarks we monitor. We see duration pressure on bonds from the recent curve setbacks with 1-month returns for the AGG index and IG Corporates in the red and the UST benchmark at 0%. The UST benchmark is negative for 3 months and YTD. IG Corporate benchmark with its longer duration is also negative for 3 months.
Equities are seeing growth stocks and tech getting dialed back for the trailing 1-month period with NASDAQ and Russell 3000 Growth negative for 1 month. 3 months returns are still solid, but as we cover in more detail charts below, the semiconductor sell-off and intermittent selloffs and rallies in software and SaaS based service operators is being felt. We address those topics in the relevant “tech check” sections below.
As we go to print, the Iran escalation sent WTI back briefly above $85 Sunday night then back to $84. The flowthrough of oil risks and Iran scenario spinning will make for interesting Q&A in the earnings season as AI capex goals get updated and notably for the hyperscale players and those most exposed to the AI ecosystem.
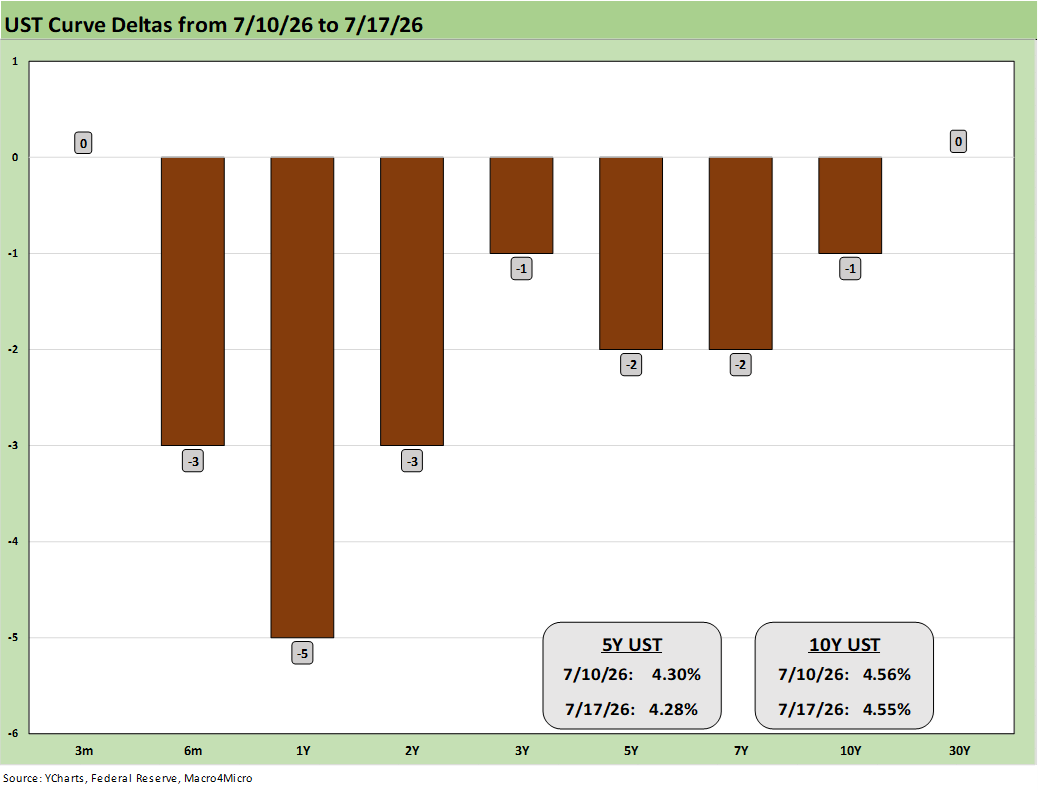
The above chart updates the UST deltas for the week with a very mild decline across the curve despite the upward oil pressure still threatening inflation (see CPI June 2026: Eye of the Storm? 7-14-26, Producer Price Index June: Still Hurts…Just Less 7-15-26).
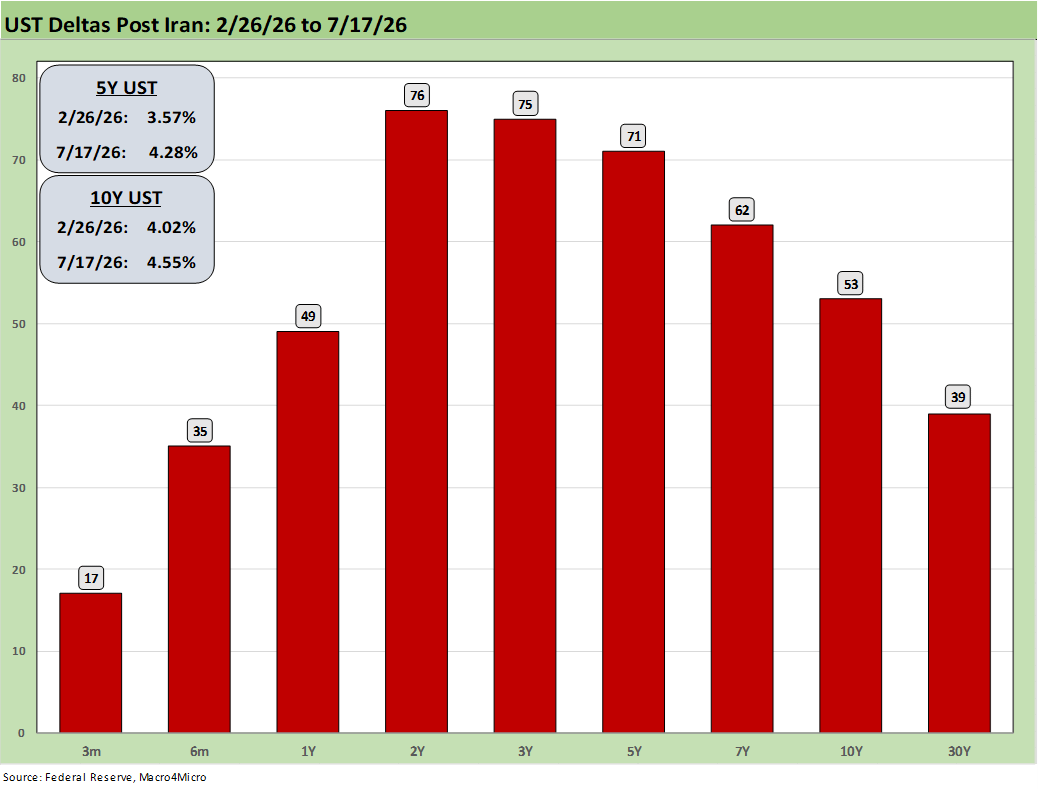
The above chart updates the post-Iran UST deltas (bombing began Feb 28) as the ugly bear flattener unfolded from 2Y to 10Y/30Y. The inflation that ensued hit 4% handles for CPI and PCE in May while CPI dipped to 3.5% at the headline level in June. These inflation moving parts are tenuous.
The decline in YoY CPI to 3.5% headline and 2.6% core in June was driven by the -5.7% MoM in Energy for June that still left Energy YoY at +15.7% and Gasoline at 26.7%. That is still ugly in the context of very strong equity valuations. As we see on the screen this past week, those energy inflation metrics have a high risk of reversing with the Iran escalation.
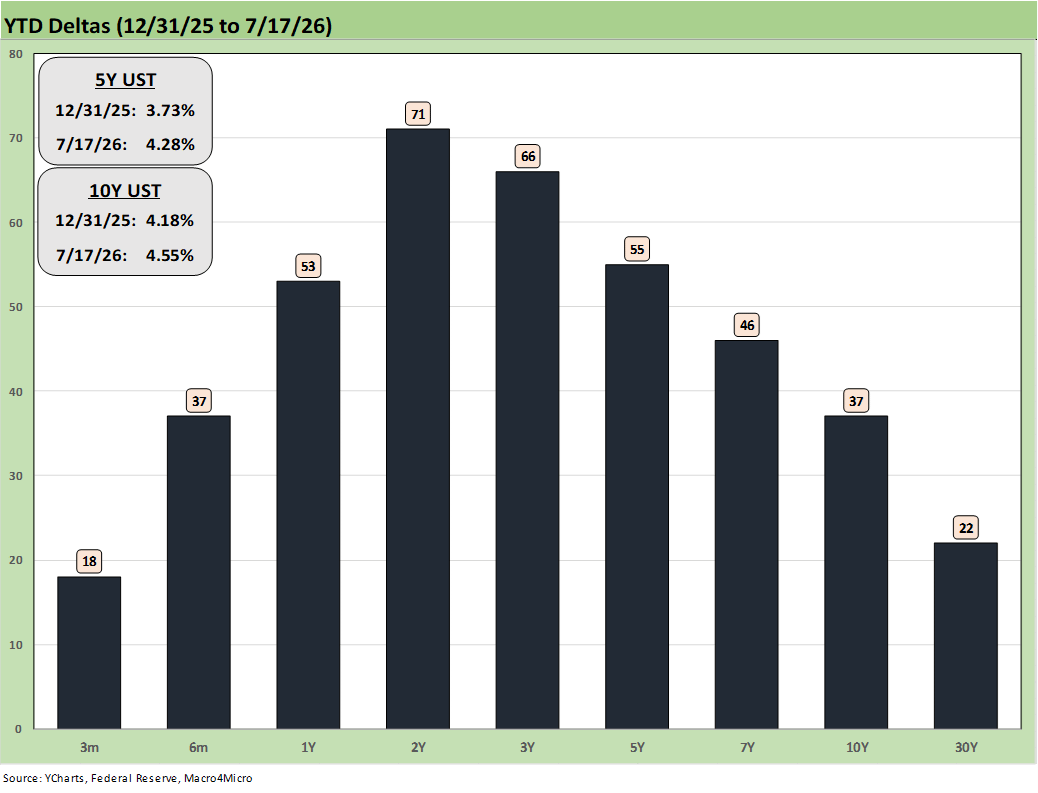
The above table updates the YTD numbers for the UST deltas. The bond ETF returns see 5 of the 7 bond ETFs in the bottom quartile for the week as we cover further below in the charts. For YTD, we see 2 of the 7 bond ETFs have negative returns on the duration impact.
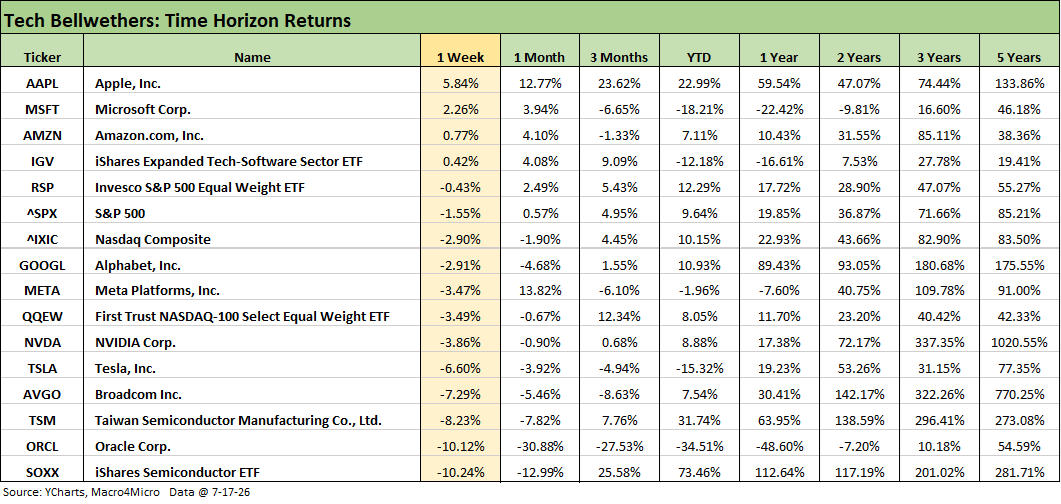
The tech bellwether table updates various timeline returns for some notable tech ETFs, and the “Mag 7+3” (includes Broadcom, Oracle and Taiwan Semi). We look at more single names and tech sector ETFs in our “tech check” charts below.
We see 3 of the Mag 7 leading the week in positive range with Apple, Microsoft and Amazon followed by the Software ETF (IGV). After that, the weekly returns flip to negative with the Semiconductor ETF (SOXX) sitting on the bottom with -10.2% for the week and -13% for 1 month but an impressive +25.6% for 3 months and still over +73.5% YTD. That double-digit sell-off was a very small dent in context with the trailing 1 year at +112.6%. We look at more of the underlying single names in the tech check timeline return charts below.
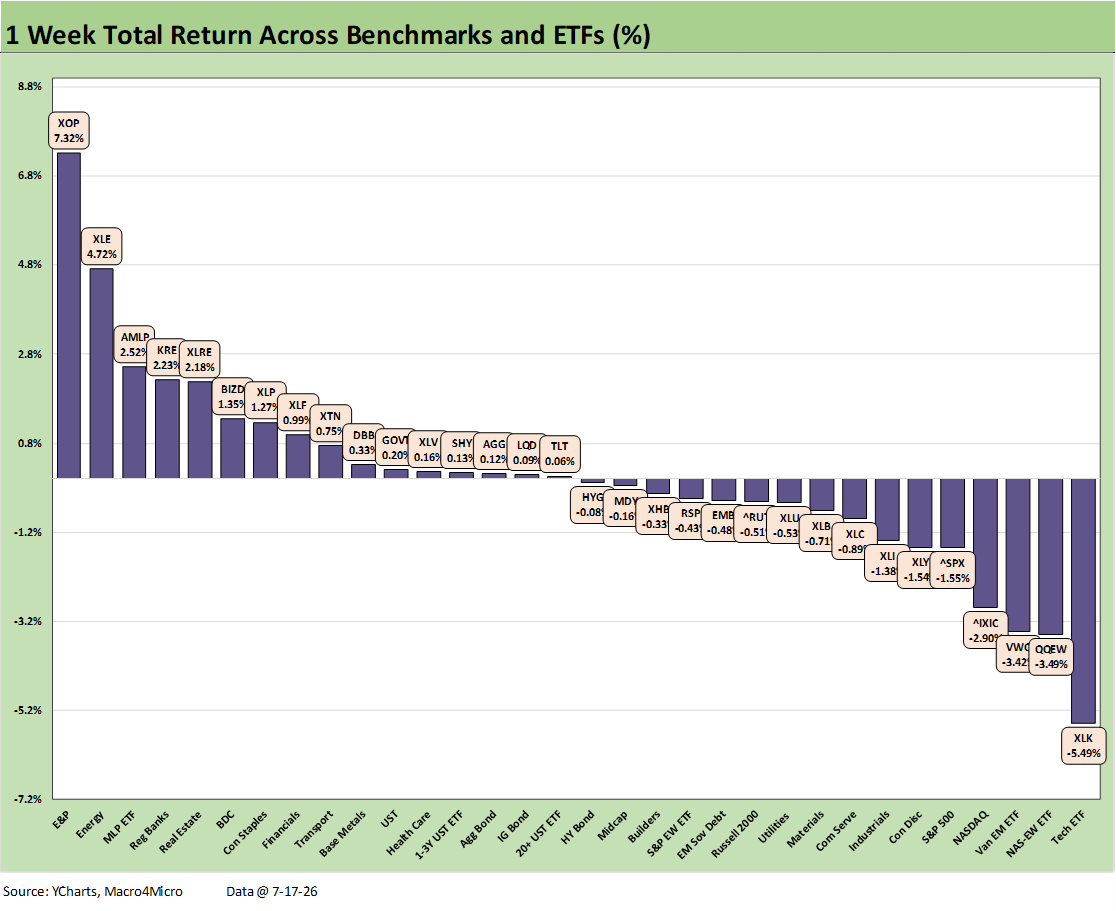
The update of the weekly returns in our broader group of 32 benchmarks and bellwethers shows a 16-16 positive-negative score. We look separately at the broader mix of tech names in our “tech check” update with that group of 32 much more heavily weighted to the downside and negative returns with a 9-23 score.
We see the large cap benchmarks (S&P 500, NASDAQ) in the bottom quartile based on tech weightings. The 11 S&P 500 sectors weighed in with a score of 6 negative and 5 positive as tech took a beating. The Russell 2000 and Midcaps were also both negative but less so and up in the 3rd quartile.
The reactions to Iran escalation have been mild in the securities markets this week despite WTI closing at $82.49 Friday, up from $71.41 the prior Friday. The UST curve might face the need to reassess this week.
The market will have much to digest this week as a slew of earnings come out with Alphabet and Tesla plus a wide range of industry groups including autos, freight and logistics, defense and aerospace, airlines, consumer finance (notably in credit cards), and major homebuilders.
We saw some benefits this past week for interest-rate-sensitive sectors tied to the downward shift of the UST. That helped push 5 of 7 bond ETFs into positive range on duration tailwinds. That also included the dividend-heavy ETFs such as BDCs (BIZD), Consumer Staples (XLP), and Real Estate (XLRE). We look at the UST deltas in more detail in the full asset return commentary to be posted later.
The top quartile is led by E&P (XOP), Energy (XLE), and Midstream (AMLP) in the top 3 slots with Financials (XLF) and Regional Banks (KRE) showing optimism after soaring earnings of major banks gave reassuring color on asset quality and the health of the consumer. Synchrony and Ally will give some more granular details on consumer credit this week. Amex will offer some signals on spending. The BDCs (BIZD) made the top quartile given the absence of negative loan color (so far) although those issuer-specific BDC earning releases come closer to the end of the season.
In the bottom quartile, we see Tech ETF (XLK) on the bottom with the Equal Weight NASDAQ 100 ETF (QQEW) in 2nd to last. Tech performance undermined NASDAQ and the S&P 500 given relative tech weightings as they ended up in the bottom quartile. Communications Services ETF (XLC) was in the bottom quartile as both Netflix (NFLX) and Meta (META) were hit hard and to a lesser extent Alphabet (GOOGL) struggled.
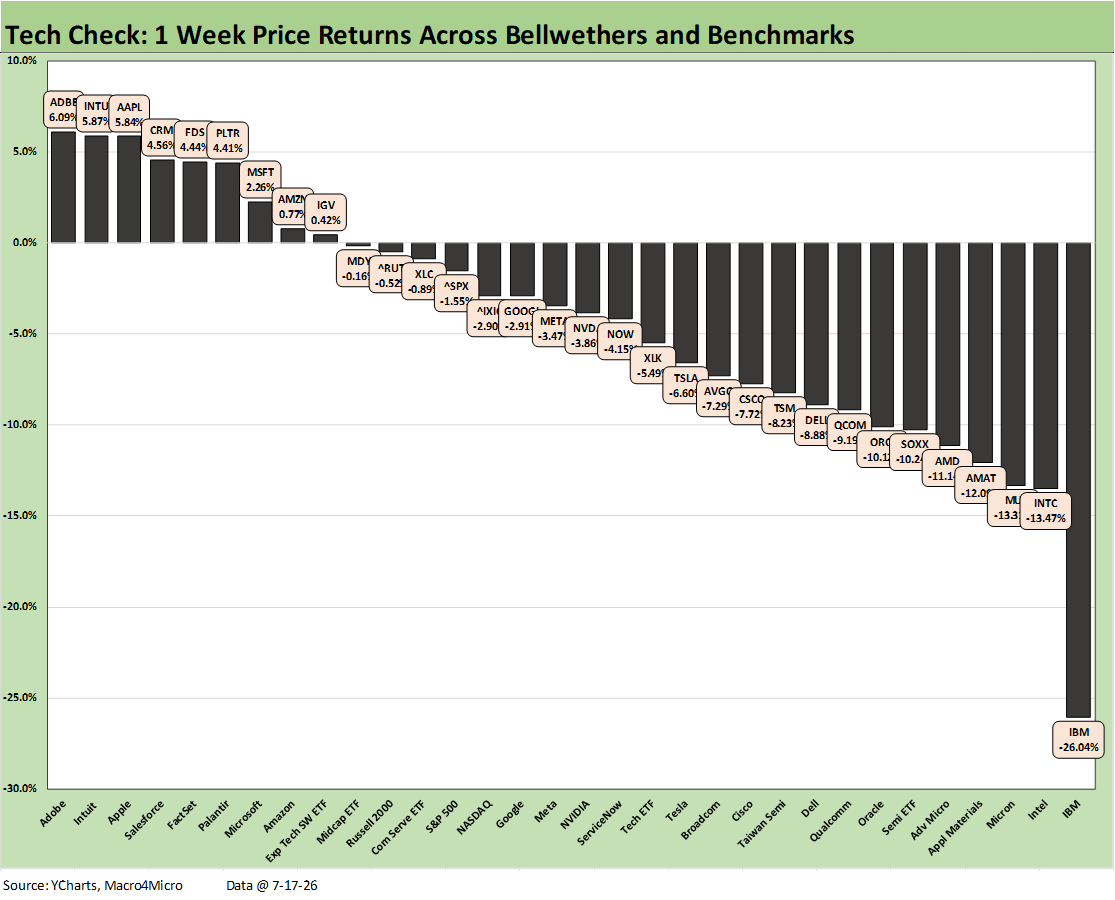
The chart updates our tech check mix of 32 single names, tech-based ETFs, and broad market benchmarks. The overall positive-negative score for the week was 9-23 with the 9 asset lines including 3 of the Mag 7 names (AAPL, MSFT, AMZN) along with a mix of software and SaaS-based names that had previously been on the receiving end of the AI displacement panic. Those include Adobe (ADBE), Intuit (INTU), Salesforce (CRM), FactSet (FDS), Palantir (PLTR), and Microsoft (MSFT).
The 6 software and SaaS names in the top quartile are still all in negative range YTD, so this is quite a flip. The next stage of tech name reassessment will get tested as earnings season rolls out. The market will seek more color in reporting season for a sense of where the broader AI ecosystem stands in its expectations for capex from the big hyperscale names. The focus will be looking to gauge capex timing and drill down into any changes in the pace and timing of the data center expansion. A variable will be what the rapid escalation of the Iran War means for the UST curve and old school “valuation math.”
In what was a bloodbath week for semiconductor equities, we see 6 of 8 names in the bottom quartile. The semi operators were joined by Oracle (ORCL) and IBM, who was crushed with major earnings and guidance setbacks that sent IBM stock down by -26%. That IBM performance was headlined by Barron’s as the “biggest wipeout on record” for the company.
IBM was catching a ride on the AI excitement despite being more of a legacy hybrid business mix. As of last week, the YTD return on IBM was only -2.9% as it avoided the worst of the sell-off felt in software and SaaS. IBM has now dropped down into the YTD bottom quartile at -28.2% wedged between ADBE and PLTR.
The Semiconductor ETF (SOXX) posted -10.2% on the week with the Software ETF (IGV) slightly in positive range at +0.42% at the top of the 2nd quartile. The more balanced Tech ETF (XLK) posted -5.5% in the upper half of the 3rd quartile. NASDAQ made the 2nd quartile but was a few notches behind the Russell 2000, Midcaps (MDY) and the tech-heavy S&P 500. The Mag 7 mix was 3 positive in the top quartile, 2 negative in the 2nd quartile with Alphabet (GOOGL) and META, and 2 in the red in the 3rd quartile with NVDA and TSLA.
The AI ecosystem stocks that had ridden the wave to new highs will face a lot of grilling in the earnings Q&A sessions. The same is true for the Mag 7 capex kings with inquiry likely to be locked in on how the data center buildout pace is expected to scale up (or slow down) based on equipment logjams, waves of state and local political reactions, and consumer sector (i.e. voter) pushback with a critical midterm election dead ahead. The headlines around electricity shortfalls and inflation pressure there and threats to water supply have all been on the front burner. We will see how many sets of kid gloves come out in sell side Q&A.
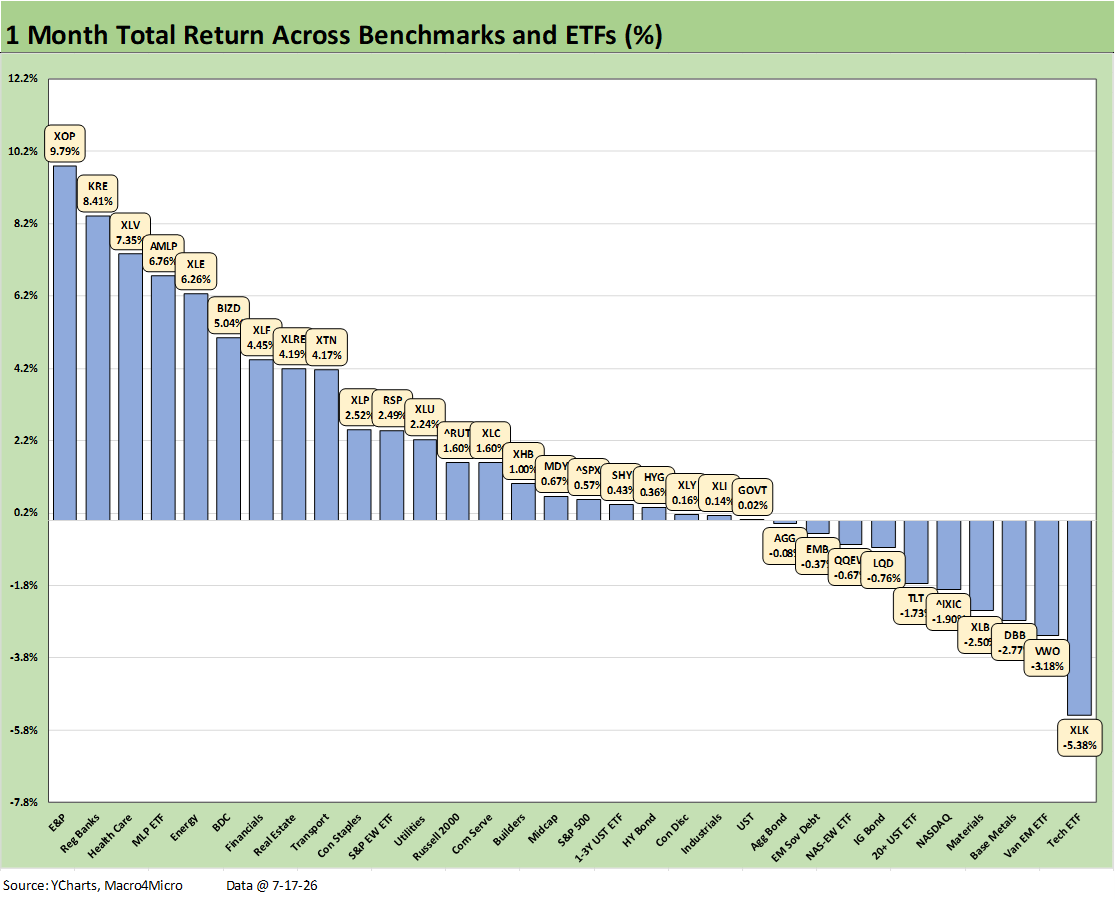
The 1-month timeline for the broader mix of 32 benchmarks and ETFs shows a strong performance by energy and financials in the top quartile. We see E&P (XOP), Diversified Energy (XLE) and Midstream in the top 5 along with Healthcare (XLV) and Regional Banks (KRE) rounding out the top 5. Interestingly, the BDC ETF (BIZD) has been making a slow comeback and was in the top quartile with Financials (XLF) and Real Estate (XLRE).
The low quartile shows the Tech ETF (XLK) on the bottom with tech-heavy NASDAQ and the Equal Weight NASDAQ 100 (QQEW). The UST curve moves hit duration with the long duration UST 20+Y ETF (TLT) with the IG Corp ETF (LQD) also in the red in the bottom quartile. Base Metals (DBB) saw some weakness as the shortages from the Strait of Hormuz started to look like it would ease. The Iran escalation could quickly bring back some of those supply problems and send prices of more commodities than oil higher again such as aluminum or copper. The risk of an oil spike and commodities replay will be getting debated this week.
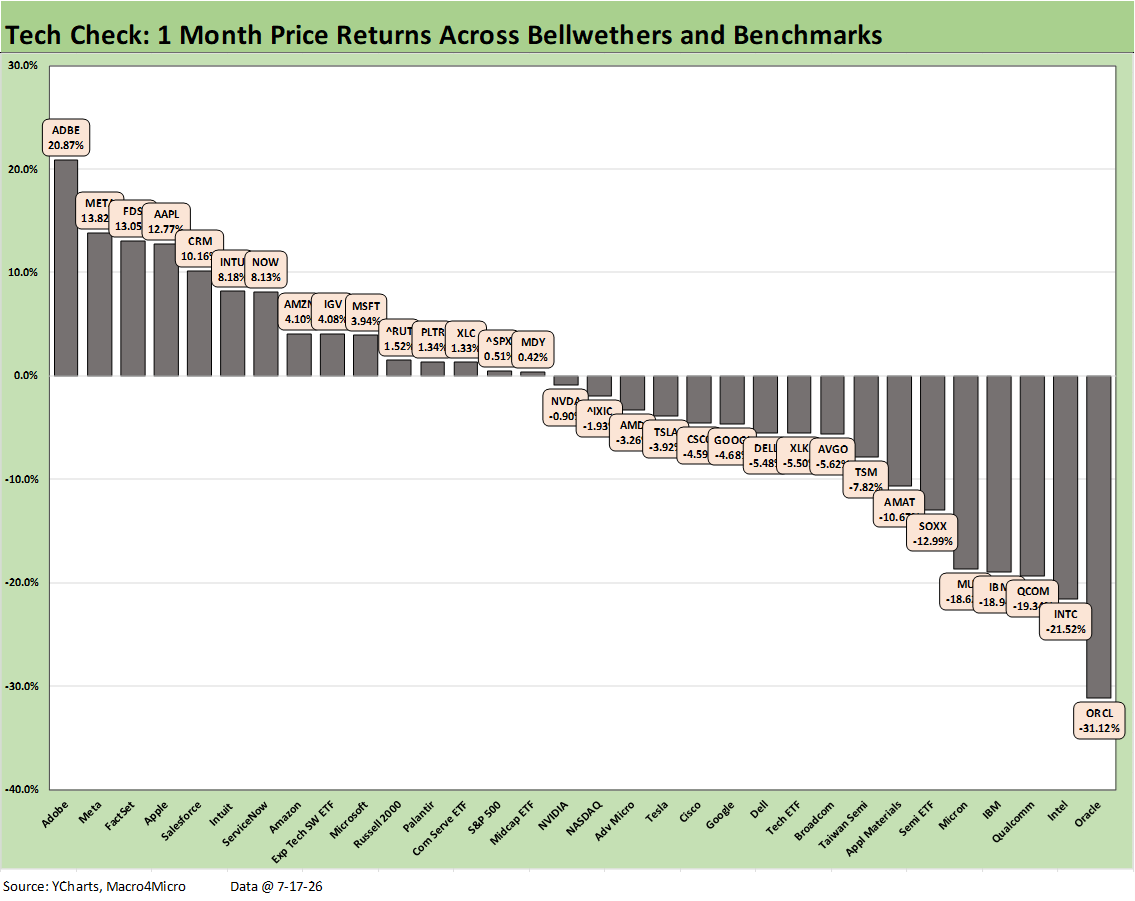
The tech check mix over 1 month has been painful as evident in the bottom quartile numbers with 7 of 8 posting double digit negative returns with 6 of the names in the bottom quartile tied to semiconductors. Intel was the worst of the semi performers at -21.5% in 2nd to last and only Oracle (included in the IGV software ETF) worse at -31.1%. We already addressed IBM in the weekly comment as the other name outside the semis.
The top performers in the high quartile include 5 software/SaaS names in the top quartile along with 3 of the Mag 7 – Apple, Meta, and Amazon. The 5 software and SaaS names have seen a rotation into that subsector after it was radically repricing lower during the “AI panic” that was driving such names dramatically lower. The 5 names in the top tier for the month included Adobe (ADBE), FactSet (FDS), Intuit (INTU), Salesforce (CRM), and ServiceNow (NOW). Those 5 names are all posting double digit negative returns YTD as we break out in another chart herein.
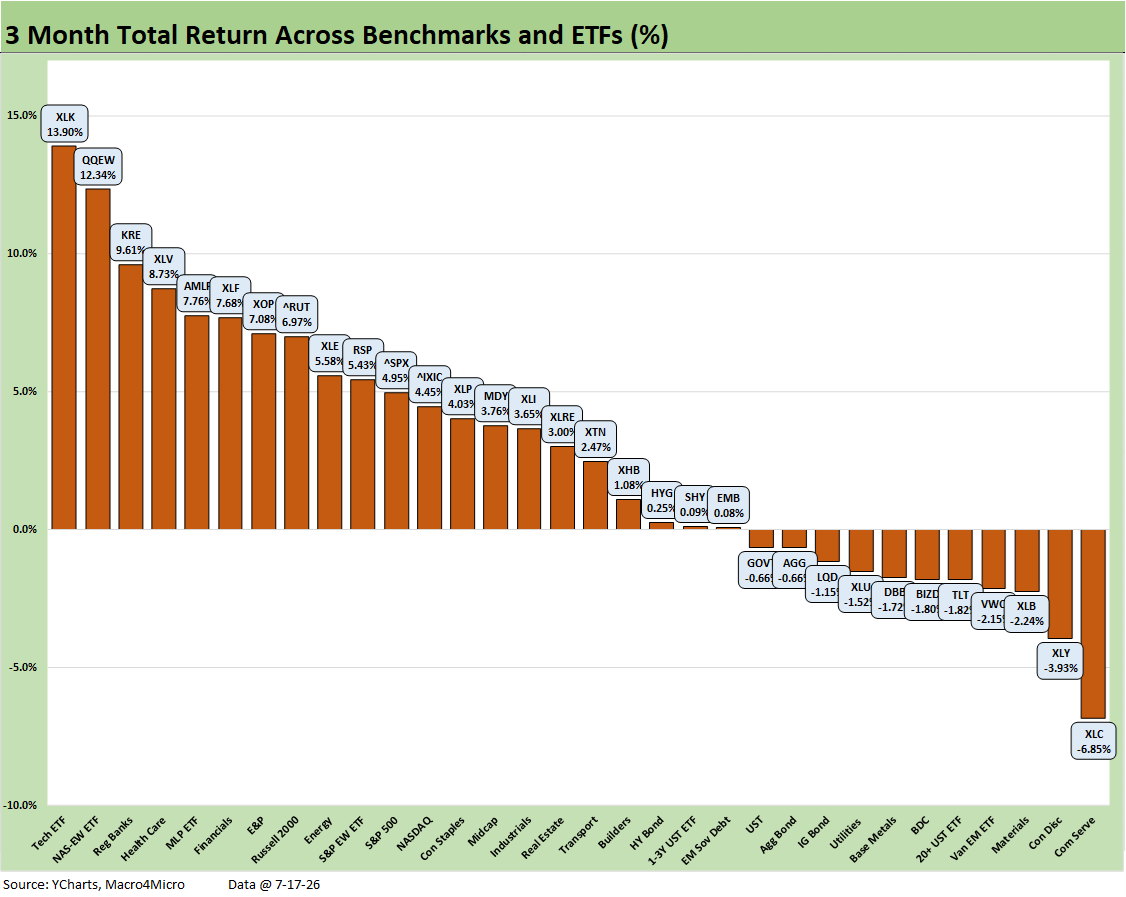
The 3-month return timeline for the broader mix of 32 benchmarks and ETFs posted a 21-11 score. The top quartile includes the Tech ETF (XLK) at #1 followed by the Equal Weight NASDAQ 100 ETF (QQEW). We see Regional Banks (KRE), Financials (XLF), Health Care (heavy on pharma), E&P (XOP), and the Russell 2000 in what is a reassuring and diversified mix.
The bottom quartile includes Communications Services (XLC) with Netflix getting slaughtered and negative returns for Meta, Comcast, and Disney among others. For bond ETFs, we see 4 of 7 in the red on duration with EM sovereigns (EMB), short UST 1-3Y (SHY) and HY bonds (HYG) each slightly positive well under 1%. Consumer Discretionary (XLY) was held back by weak retail performance.
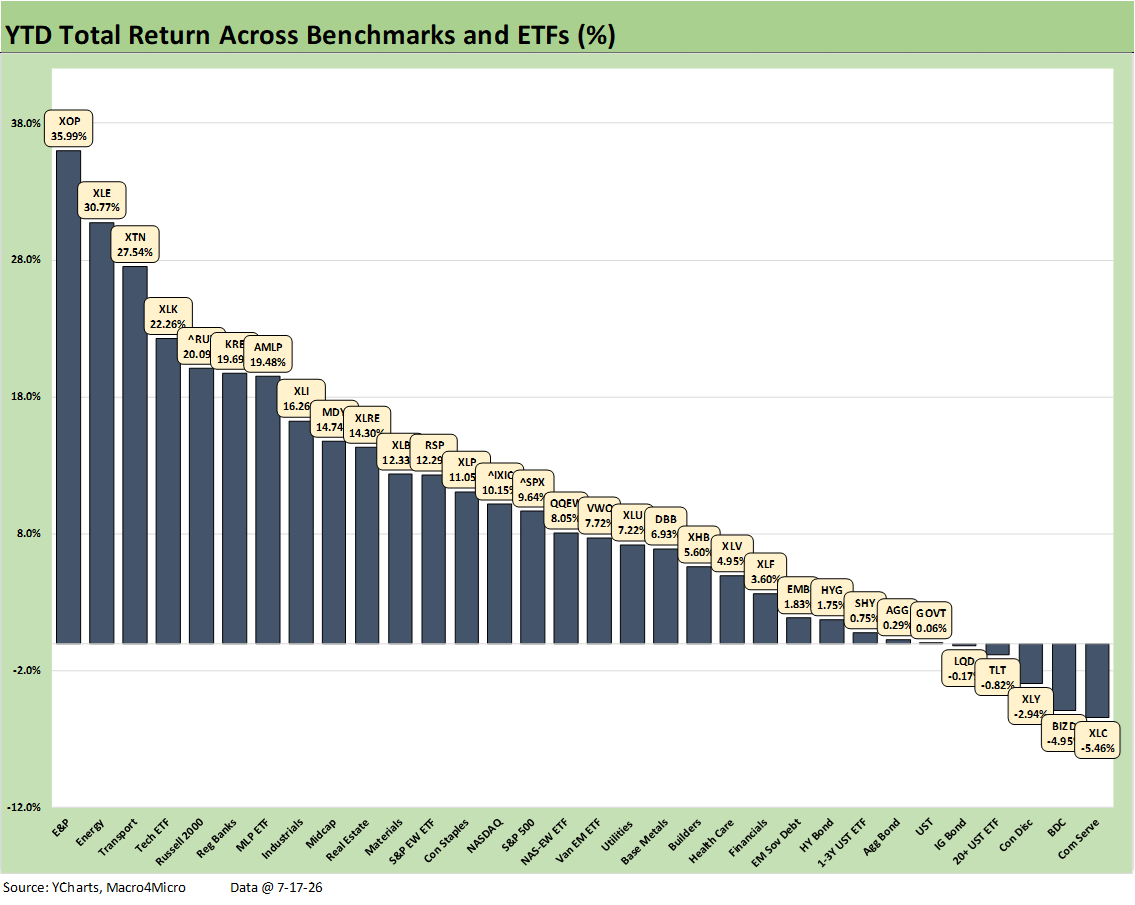
The YTD returns for the broader group of 32 are showing a solid stretch on rising earnings for numerous industry groups. Bond ETFs have struggled. The bottom quartile saw 5 of the 8 ETFs tied to bonds with 7 of the bottom 10 being bonds. The 3 names on the bottom included Communications Services (XLC), the BDCs (BIZD), and Consumer Discretionary (XLY).
The winners in the top quartile show a cyclically diverse range of industries across energy related with E&P (XOP), the diversified Energy ETF (XLE), and Midstream (AMLP) along with the Tech ETF (XLK) again along with Transports (XTN), the Russell 2000, Regional Banks (KRE) and Industrials (XLI). That is a broad mix.
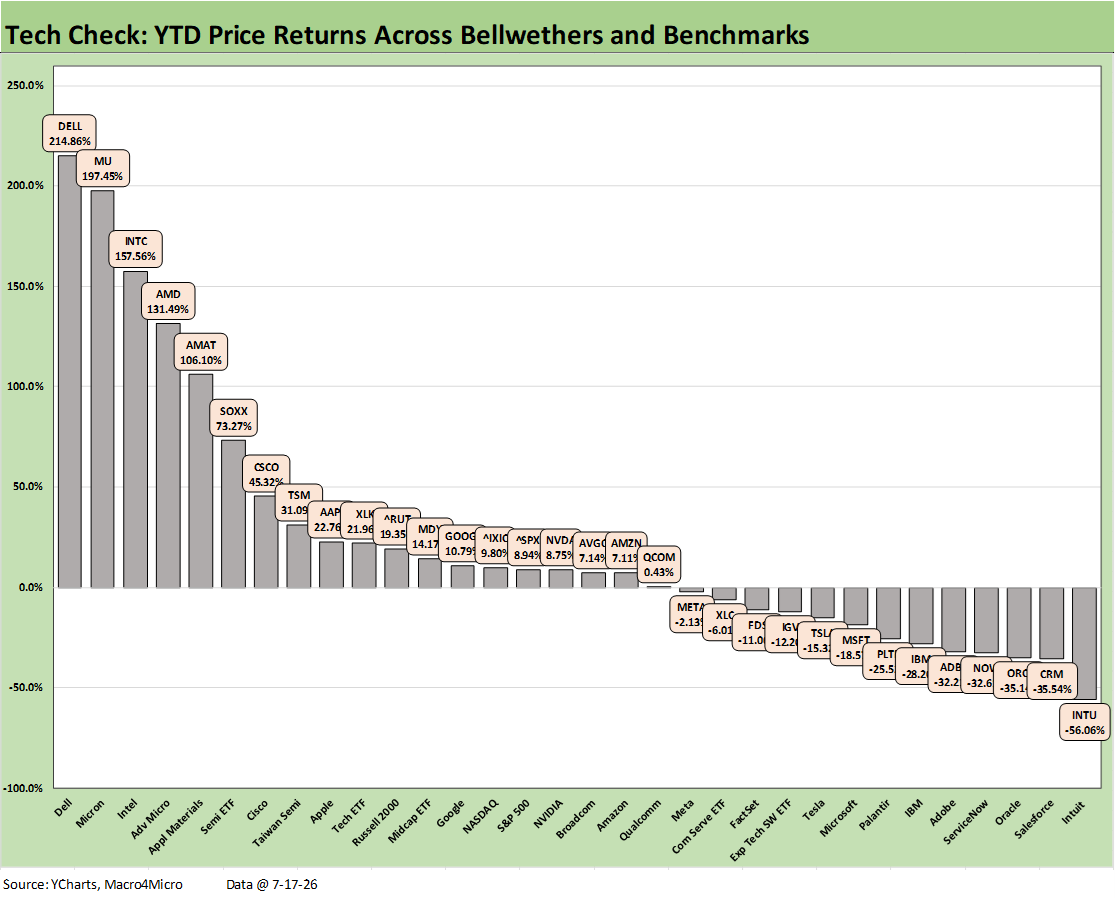
The returns for the YTD tech check mix post a score of 19-13 with the bottom tier once again dominated by Software and SaaS-based services names. While some of those negative returns for the software/SaaS group have been reduced, the same is true for the gains in the semiconductor lead winners.
The extraordinary returns for the AI ecosystem names in the top tier run from Dell at +214.8% down to Applied Materials (AMAT) at #5 with a +106% return. Making the top quartile took a +31% return as posted by Taiwan Semi (TSM). The Hi-Lo range of 270 points is well down from where it was but still highlights the outsized spike in the semis narrowly and AI plays broadly.
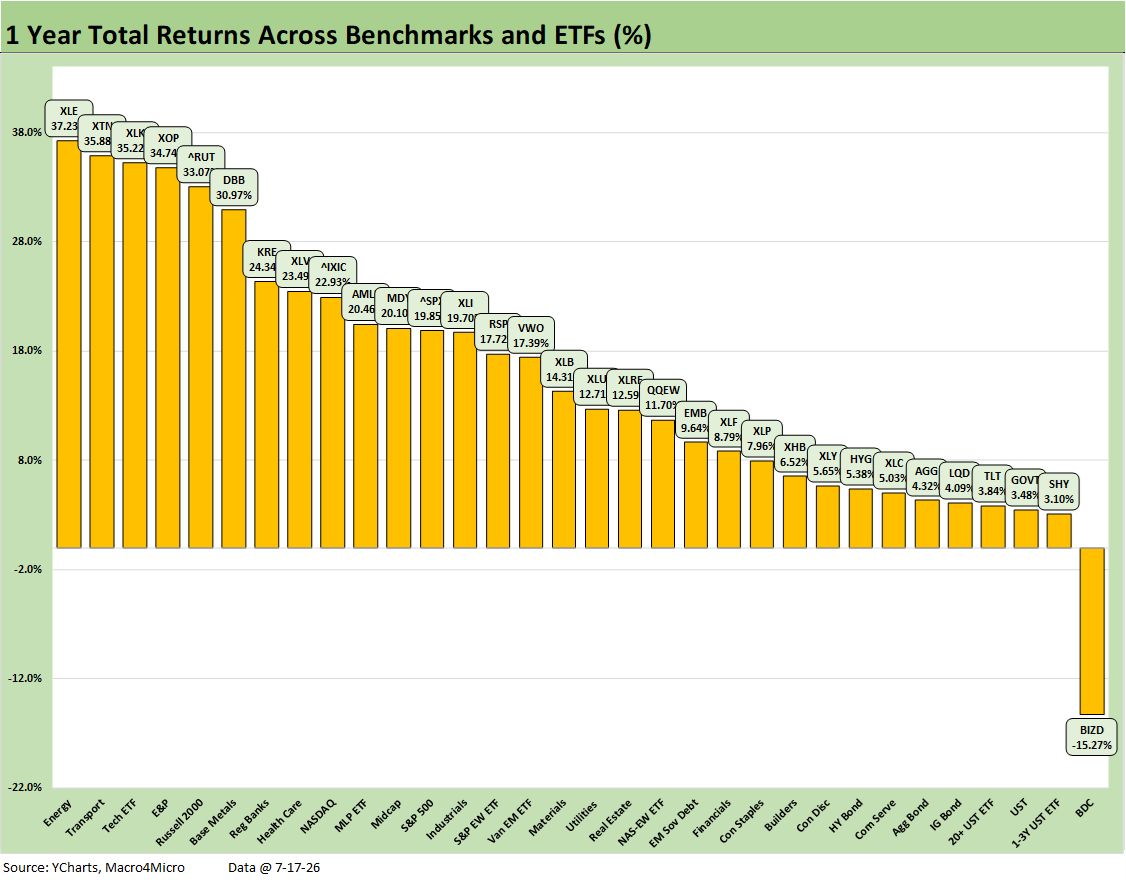
The trailing 1-year returns are obviously impressive for any cycle and the score is holding at 31-1 with only the BDC ETF (BIZD) in the red at -15.3%. We see the Energy ETF (XLE) now on top at 37.2% vs. the Transports (XTN) at #2 with +35.8%. It took 23.5% to make the top quartile while the median for the asset lines is around 13.5% for the LTM period.
See also:
Housing Starts June 2026: 5 Units or More is Not a Crowd 7-19-26
Industrial Production June 2026: Sideways Syndrome 7-18-26
Company Profile: Ford Motor and Ford Motor Credit 7-17-26
Producer Price Index June: Still Hurts…Just Less 7-15-26
CPI June 2026: Eye of the Storm? 7-14-26
Market Commentary: Asset Returns 7-12-26
Existing Home Sales June 2026: The Stall is On 7-11-26
Happy 250th Birthday America 7-3-26
Employment Situation June 2026: Back to a Crawl 7-2-26
JOLTS May 2026: Openings Flat, Hires Down, Layoffs Up 7-1-26
Music to Ponder: Hope Rising or Blood Simmering? 6-30-26
The Election Gambit: Economic Risk and Policy Uncertainty 6-29-26
JD Vance and Nixon History: Clueless 6-27-26
Personal Income & Outlays May 2026: Bad Inflation, Balanced Spending 6-26-26
New Home Sales May 2026: Weak Volumes, Stable(ish) Prices 6-25-26
GDP 1Q26 Final: PCE Growth Plunge 6-25-26
Trade Deficits: The Moving Parts and Macro Goals Matter Most 6-24-26
The FOMC Dance: Will Warsh and Trump Find a Rhythm? 6-17-26
Geopolitical risk: Trump’s Nuclear Saber Rattling? 6-14-26
Remembering D-Day: June 6, 1944
The Fall of CBS 6-3-26