
Footnotes & Flashbacks: Asset Returns 6-30-24
We update benchmarks and ETF equity/debt returns in a week where tech exceled and long duration assets took a hit.


"You are definitely in the wrong place for a Presidential debate."
The week was unfriendly to long duration performance with lower short rates and higher long rates driving a mild steepener.
The news out of the PCE release showed disposable income growth higher than consumption after a modest downward revision of PCE seen again in the final estimate for 1Q24 GDP (see PCE, Income and Outlays: Practicing Safe Growth? 6-28-24, 1Q24 GDP: Final Cut, Moving Parts 6-27-24).
Equities were mixed with 5 of the Mag 7 positive but chip benchmark NVIDIA taking a week off at -2.4% in a quarter that was near +37%.
Bond ETFs were spread out across the weekly returns with SHY making the second quartile on the small UST move lower while the long duration ETF (TLT) and 3 other bond ETFs were in the weekly bottom quartile on the UST steepener.

The above chart updates the running returns for the high-level debt and equity benchmarks we watch. We line them up in descending order of 1-year total returns. The 1-year total returns of HY are still in double digits and thus in line with long-term equity returns. Spreads mitigated some of the duration damage for IG bonds over the past year.
We see all positive returns again this week for the rolling 1-month in debt and a single line in the equities red zone with the Russell 2000. The Dow flipped back to positive this week with small caps sequentially looking better than the -3.5% in last week’s rolling month numbers.

The above chart updates the 1500 and 3000 series. This week still shows a decidedly mixed picture in this group but better overall for the 1-month compared to last week’s rolling returns. Last week showed 5 of 6 lines in the red with only Growth well in the black for 1-month. This week, we are back down to 3 in the red and at lower levels of red.
Looking back 3 months, we see the recent small cap and midcap struggles. Most classes of real estate securities and select REIT income stocks should do well with a downshift in the curve despite pockets of major problems in some real estate subsectors. Selectivity reigns supreme in real estate subsectors by asset mix and issuer.
The rolling return visual
In the next section we get into the details of the 32 ETFs and benchmarks for trailing periods. Below we offer a condensed 4-chart view for an easy visual before we break out each time period in the commentary. This is a useful exercise we do each week looking for signals across industry groups and asset classes.
Last week we increased the tally of ETFs and benchmarks from 31 to 32 with the addition of the UST 1Y-3Y index (SHY) for another bond index with a short duration flavor. The hope/expectation for an end to the very steep inversion from 3M to 5Y lives on, and SHY would capture that over time. If the inversion does not shift soon, that could mean bigger problems if we get into 2025 with no cuts and looking at what variables might be driving that (inflation stays stubborn, inversion flattens from the long end, etc.).

The above mix of returns has morphed in recent weeks into a heavier mix and diverse balance of positive and negative in the rolling 1-month and 3-month periods while 1 year is holding at overwhelmingly positive. Another highlight has been a more favorable mix of positive returns in bond ETFs as we detail below.
The Magnificent 7 heavy ETFs…
Some of the benchmarks and industry ETFs we include have issuer concentration elements that leave them wagged by a few names. When looking across some of the bellwether industry and subsector ETFs in the rankings, it is good to keep in mind which narrow ETFs (vs. broad market benchmarks) get wagged more by the “Magnificent 7” including Consumer Discretionary (XLY) with Amazon and Tesla, Tech (XLK) with Microsoft, Apple, and NVIDIA, and Communications Services (XLC) with Alphabet and Meta.

The above chart allows us to track some headline mega-names and see which might have wagged certain ETFs or the broader capitalization weighted benchmarks. We line up some of the major large cap Tech-centric names in descending order of total returns for the most recent week.
We include the S&P 500 and NASDAQ along with the Equal Weight NASDAQ 100 Equal Weight ETF (QQEW) and the S&P 500 Equal Weight ETF (RSP). A table of the big tech names from the Mag 7 to the broader collection of “headline types” streamlines the weekly review if one of the big ETF names is impacting performances.
This week saw NVDA volatile to the downside but when the smoke cleared it was only a -2.4% week that rolls into a +8.5% month, a +36.7% 3 months and +149.5% 6 months.
For the past 1-month, only Broadcom (AVGO) at +14.1%, Apple (+10.9%), and Tesla (+12.0%) are in double-digits. As noted in the chart, for the past 6 months we see a very wide dispersion of returns across the Mag 7. Only Tesla was negative over that period while only Apple was down in single-digit positive returns for 6 months among the Mag 7. The other 5 of the 7 were very strong.

For the 1-week period, the benchmarks and ETFs weighed in at 13 positive and 19 in negative range with a mix of good and bad news across sectors. Regional Banks (KRE) and Energy (AMLP, XLE, and XOP) took the top 4 slots with stronger Transports (XTN) riding a wave of some cyclical optimism with the #1 holding FDX having a very big week coming off earnings. The XTN ETF is very well diversified by name and lacks issuer concentration effects.
The UST shapeshifting saw the short end move slightly lower but steepen out the curve, and that also helps the story line for lenders if margins and quality can hold up. Generally, KRE has been a volatile but middling performer over the past 3 months as real estate “shoes to drop” get a fair amount of headline space.
The past week saw bonds hit after a good stretch in the prior month. The new addition to our collection, the UST 1Y-3Y UST (SHY), managed slightly positive returns and a spot in the second quartile, but the rest of the 7 bond ETFs were in the red. We see the long-duration 20+ Year UST ETF (TLT) sitting in last place along with 3 other bond funds in the bottom quartile (AGG, LQD, and EMB). GOVT and HYG landed in the third quartile but also in negative range.
We see the stall in Builders (XHB) again in the bottom quartile after a great LTM and YTD run while Materials (XLB) continues to sit in the bottom quartile for 1-week, 1 month, and 3-months and third quartile for LTM. The Tech ETF (XLK) felt the NVDA sell-off as well.

The 1-month time frame came with 22 positive and 10 negative as bonds were all positive and a Mag 7 heavy mix of benchmarks and ETFs showed up in the top quartile, which included Tech (XLK), Consumer Discretionary (XLY), NASDAQ (IXIC), Communications Services (XLC), and the S&P 500 (SPX). Transports (XTN) had a good 1-month stretch after a very rough period that saw XTN second to last LTM and second to last for 3 months.
“High cash income still matters” is a recurring theme for 3 months with Midstream (AMLP) at #1 for 1-month and just missing the top quartile for 3 months behind BIZD, which was in the top quartile for 3 months. Both AMLP and BIZD were strong for the LTM period with Midstream (AMLP at #1) and BDCs (BIZD) in the top quartile for the past year at #8.
Bond ETFs held in well for the 1-month period with all 7 positive and 5 of 7 in the second quartile (TLT, GOVT, AGG, LQD, HYG). SHY and EM Sov (EMB) were positioned in the upper third quartile for the 1-month.
We have seen the commodities buzz coming off the market with Base Metals back in last place for the 1-month period but still #1 for 3-months and high second quartile for LTM. Among other notable laggards in the bottom quartile for 1-month was small caps (RUT), midcaps (MDY), and Builders (XHB).
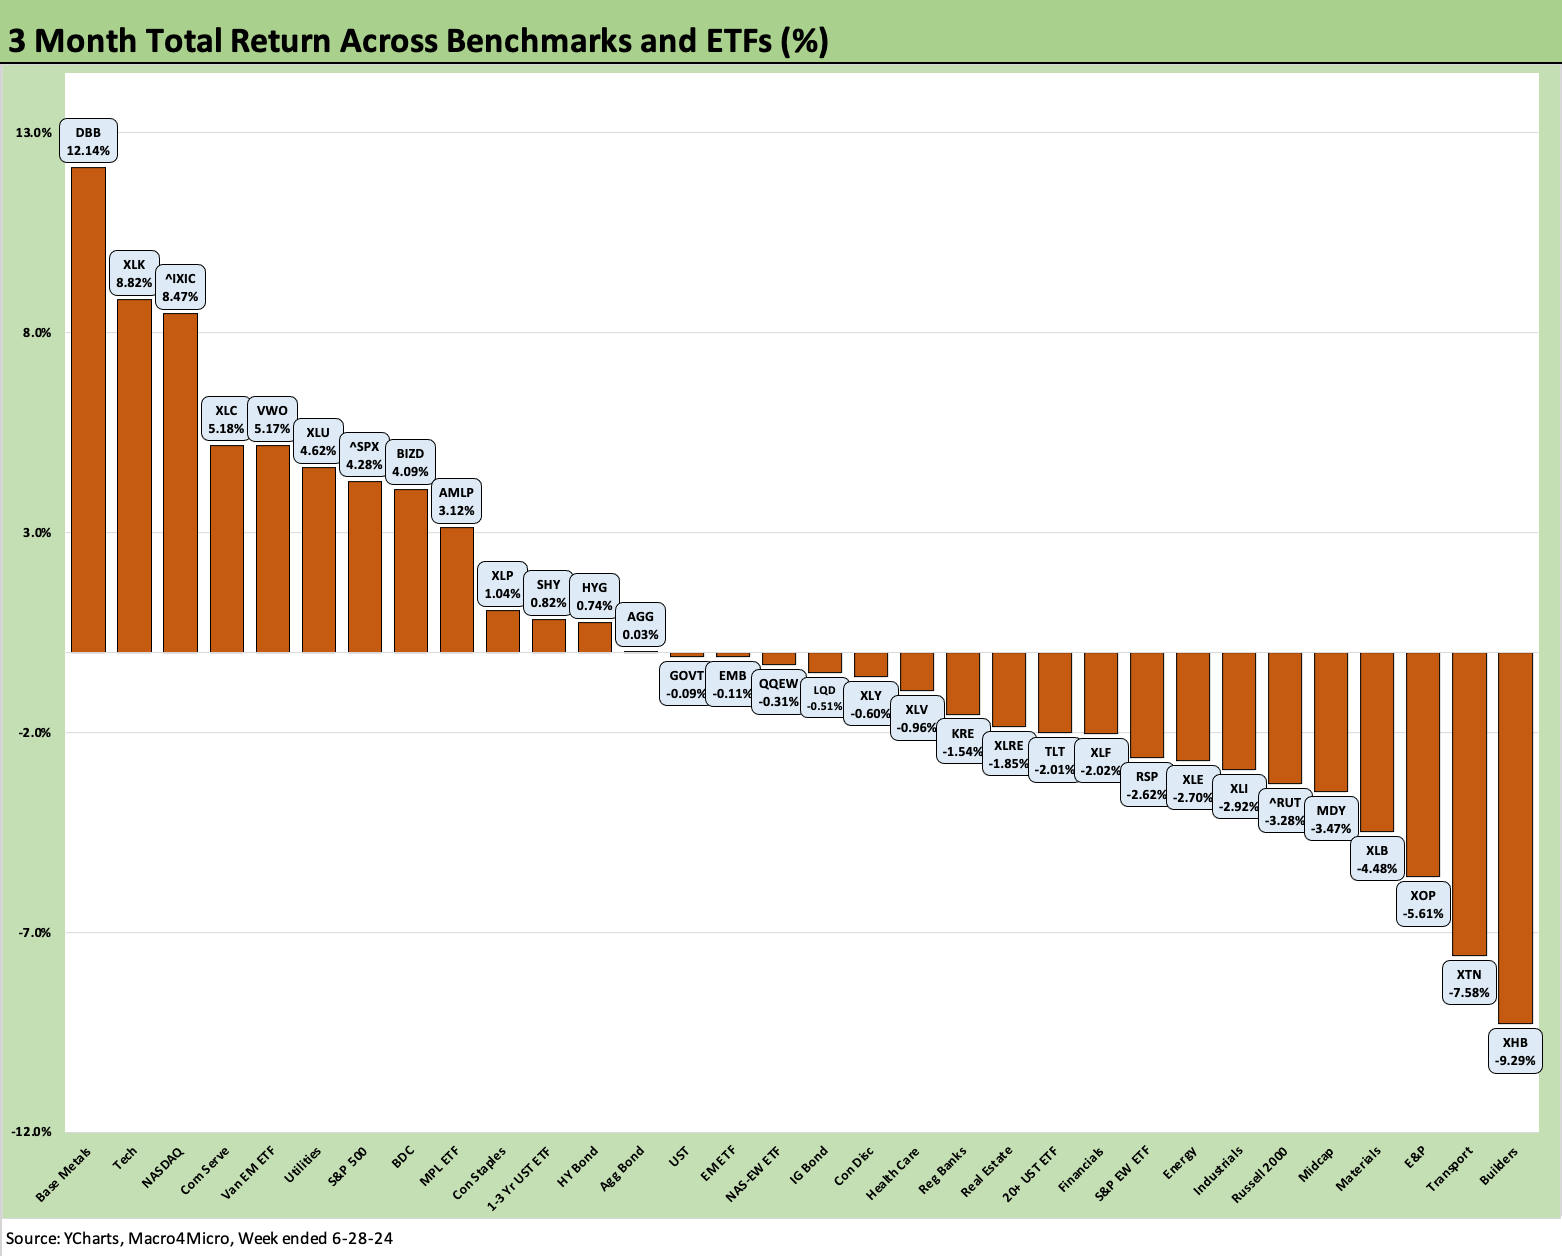
The 3-month period has been more a mixed picture with 13 positive and 19 in negative range. Base Metals (DBB) rode the commodity excitement to #1 in a notoriously volatile sector while the bottom performer has been the Homebuilding ETF (XHB) as a more cautious view on growth rates are driving a valuation reassessment of the sector after such a heady run (+28.5% LTM).
The top quartile includes a heavy mix of tech-centric line items and Mag 7 heavy ETFs (XLK, NASDAQ, S&P 500, XLC) with EM equities (VWO) and BDCs (BIZD) making the top quartile. Utilities (XLU) has been resilient on a mix of good fundamentals (power demand) and interest rate sensitivity while still having defensive features as somewhat of a chameleon ETF.
Bond ETFs show 3 in positive range (SHY, HYG. AGG) and 2 negative (GOVT and EMB) in the second quartile with LQD and TLT down in the third quartile.
Energy (XLE) and E&P (XOP) are in the bottom quartile with small caps (RUT) and midcaps (MDY) with Industrials (XLI) and Materials (XLB), so the picture remains mixed for industry groups on the direction of cyclical variables.

It has been hard for bad news to hit the LTM rankings to this point with 30 positive and only 2 negative. We highlight the high cash income vehicles such as Midstream (AMLP) and BDCs (BIZD) in the top quartile along with a high mix of Mag 7 and tech-heavy benchmarks and ETFs (XLC, XLK, NASDAQ, SPX). The performance of the Builders has been covered in detail in our sector and single name research while Financials (XLF) make for a nice complement to the riskier BDC sector for relative credit cycle optimism.
The bottom of the rankings still sees duration with the lower performers with TLT at -8.0%. We see 5 of the 8 bond ETFs in the bottom quartile (TLT, GOVT, AGG, LQD, and SHY) with only EMB and HYG just across the line in the low end of the third quartile.
Rounding out the worst of the mix is Transports (XTN), Real Estate (XLRE), and Consumer Staples (XLP) as an interest rate sensitive, defensive ETF.
See also:
State Unemployment: A Sum-of-the-Parts BS Detector 6-30-24
The Debate: The China Deficit and Who Pays the Tariff? 6-29-24
PCE, Income and Outlays: Practicing Safe Growth? 6-28-24
Durable Goods: Playing Defense 6-27-24
1Q24 GDP: Final Cut, Moving Parts 6-27-24
New Home Sales: Pumping the Brakes 6-26-24
Footnotes and Flashbacks: Credit Markets 6-23-2
Footnotes & Flashbacks: Asset Returns 6-23-2
Footnotes & Flashbacks: State of Yields 6-23-24
Existing Home Sales May 2024: Weary Climb 6-21-24
Consumer Sentiment: Summer Blues or Election Vibecession 6-14-2
Income Taxes for Tariffs: Dollars to Donuts 6-14-2
HY Spreads: The BB vs. BBB Spread Compression 6-13-2
HY Spreads: Celebrating Tumultuous Times at a Credit Peak 6-13-2
FOMC: There Can Be Only One 6-12-24