
D.R. Horton: Credit Stronger Even if Stock Takes a Step Back
We update the state of affairs at D.R. Horton, the #1 builder that is a microcosm for the industry.


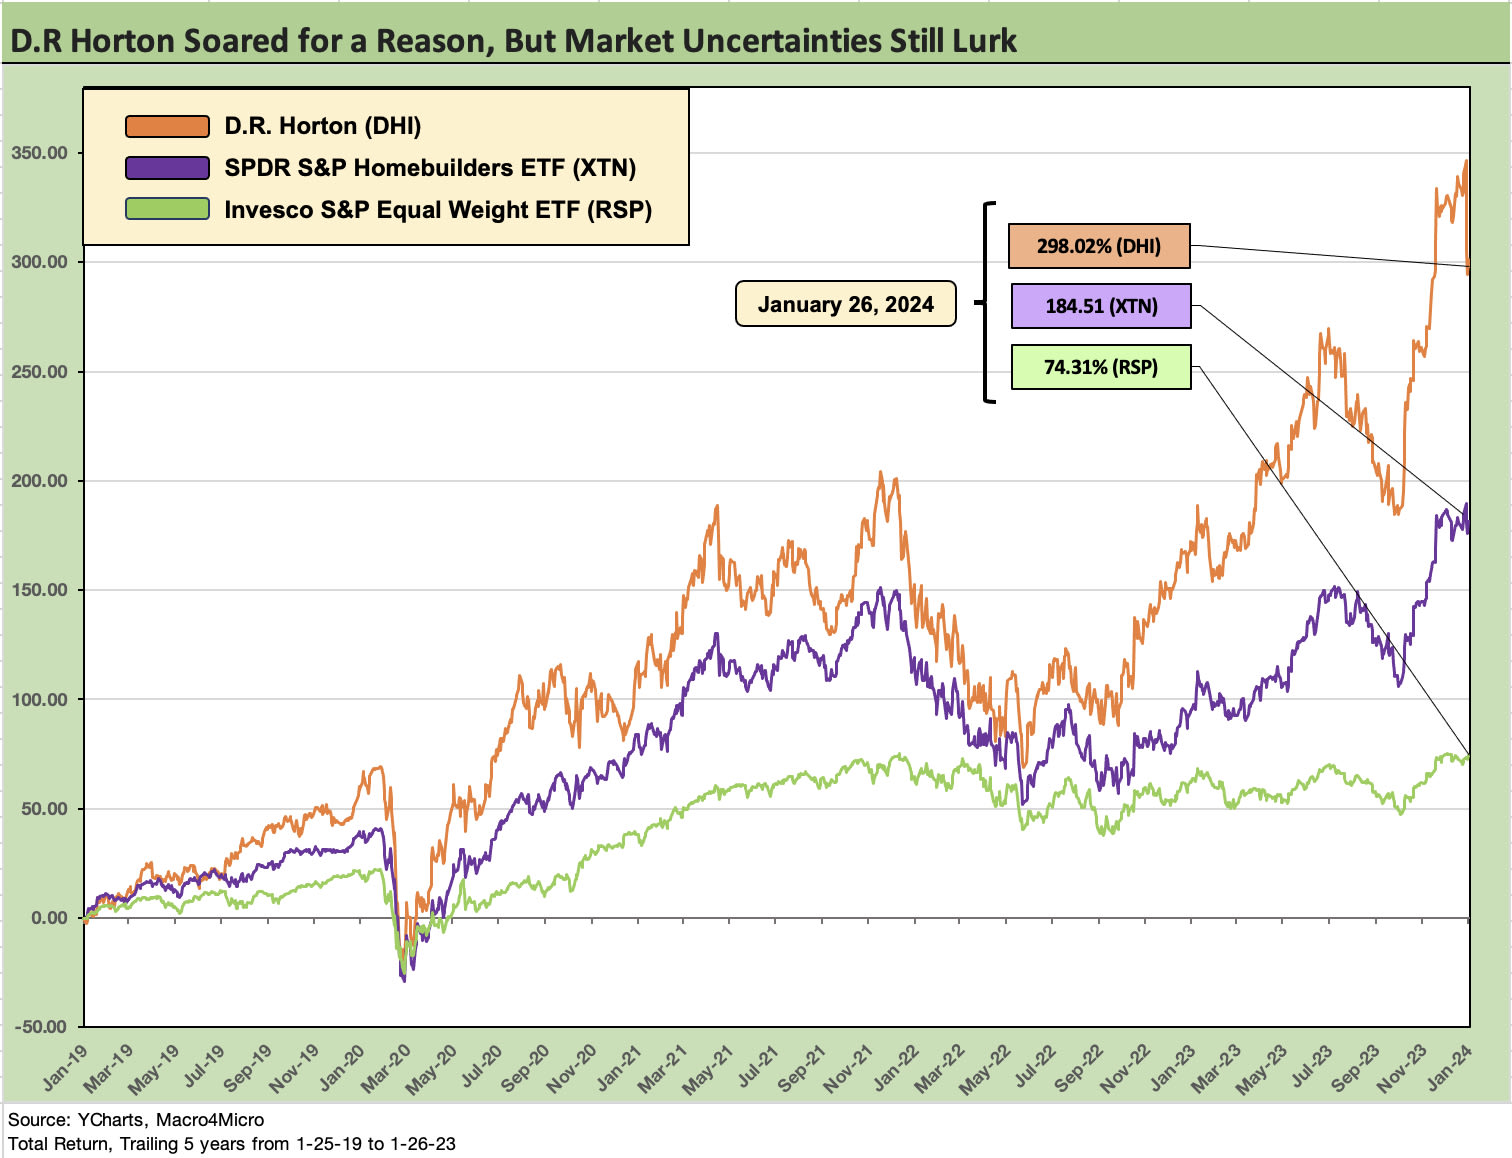
We update the financial and operating metrics for D.R. Horton (DHI) as the builder equities seem to be taking a breather after a blistering year that gave the hot tech benchmarks a run for their money.
As the #1 homebuilder with operations across its core homebuilding unit, single family/multifamily rental construction, land development, and mortgages, DHI is a good microcosm for the entire sector.
The homebuilding debt does not share guarantees with the other operations and is about as solid a high BBB tier financial profile as one can find with homebuilding cash in excess of homebuilding debt and housing inventory at over 8x total homebuilding debt.
DHI is a cash flow machine that is able to invest at will, offers much better asset protection than its credit ratings indicate, and can keep rewarding shareholders during a period where mortgage rates are not necessarily going to agree with UST forecasts.
In this commentary, we look at the 1Q24 numbers for DHI (9-30 fiscal year) and consider the color they offered on their earnings call with respect to market conditions as we head into a year when mortgage rates are in theory going to get much more constructive per the UST consensus. With operations in land development through a publicly traded majority-owned subsidiary (Forestar) as well as single family rental operations, DHI is a major player in two business lines you do not tend to see with the major builders as stand-alone operations. DHI offers up more angles in one place.
DHI is the biggest of the homebuilder pack at almost $47 bn in market cap (1-26-24) or $5 bn more than #2 Lennar and more than double the size of Pulte and NVR, who are clustered around the #3 slot in equity value with each posting $22 bn handles in equity market cap. To round out the Top 5, DHI is well over 4x the size of #5 Toll Brothers.
We have looked at D.R. Horton in depth in prior commentaries (see Credit Crib Notes: D.R. Horton (DHI) 8-9-23, D.R. Horton: Credit Profile 4-4-23), and watching the company’s single family rental initiatives have been especially interesting (see Single Family Rental: A Major D.R. Horton Asset Sale 6-6-23).
Rentals remain a part of a growth strategy in a US market where affordability is very strained and demographics favorable, and the supply-demand balance is showing a serious shortfall working against those seeking a place to live other than multifamily. We see others in the rental space indirectly such as LGI Homes. LGIH indicated almost 20% of its backlog at 3Q23 was for single family rental partners ordering “wholesale.”
There are many different aspects to the evolution of the single family market whether owned or rented or single family “attached or detached.” No player in the market is as close to as many regions and the first time buyer (or aspiring first time buyer looking to move on from renting) as DHI.
Single family rentals also tie closely into the shelter inflation themes that have been such an obstacle to lower services inflation. Multifamily supply coming online is supposed to relieve some of that shelter inflation and the same is true for single family rental trends as 2024 continues. The imputed “Owners’ Equivalent Rent” that is the largest slice of the CPI index is especially challenging. Single family rentals have been more stubborn than multifamily and varied by region and price tier.
DHI as a window into the first time buyer segment…
With one of the lowest average prices of the major builders, DHI also might be generalized as closer to the “real world” relative to some of the major builders operating in the high price range (e.g., Toll Brothers as an extreme case.) All dollars are “real” whether Toll or DHI, but DHI’s operations get you closer to the broad national challenge around the housing supply shortfall.
An interesting issue is whether single family rentals of the sort DHI is bringing to the supply equation in the market makes for a different secular trend ahead that traditional multifamily rentals do not solve (note: DHI is in multifamily rentals also).
We are due for a year end update on where the builders stand on average selling prices after more builders report, but we summed up where DHI stood in ASPs vs. the peer group earlier in 2023 (see Homebuilders: Average Selling Prices by Company 2-17-23). Only LGI Homes was lower at the time. No other major builder was below the $400K threshold. As detailed further below, DHI was down to $376 in 1Q24 from $387 in 1Q23.
There are others in the single family rental market, but DHI is unusual in that it is bringing new supply to the market in a way the private equity and individual investor funds do not since they buy existing home stock. The Washington crowd on the left accuse the private investors of distorting the market and buying an outsized share of the supply and thus punishing homebuyers. That has been regularly debunked and subject to the exercise of “fun with denominators” with respect to the financial buyers’ market share. That is a debate for another day, but DHI’s role is strictly accretive to housing supply from A to Z. As noted earlier, we also have seen builders (such as LGI) selling directly to single family rental operators.
For those watching for the impact on the more modestly priced homes and that buyer profile, DHI is a good one to monitor with around 56% of its deliveries to first time homebuyers. Beyond price, the question of inventory turnover and building cycles and supplier chain functionality have been hot topics. Those variables are generally moving in the right direction for the major players. We heard that also from #2 Lennar.
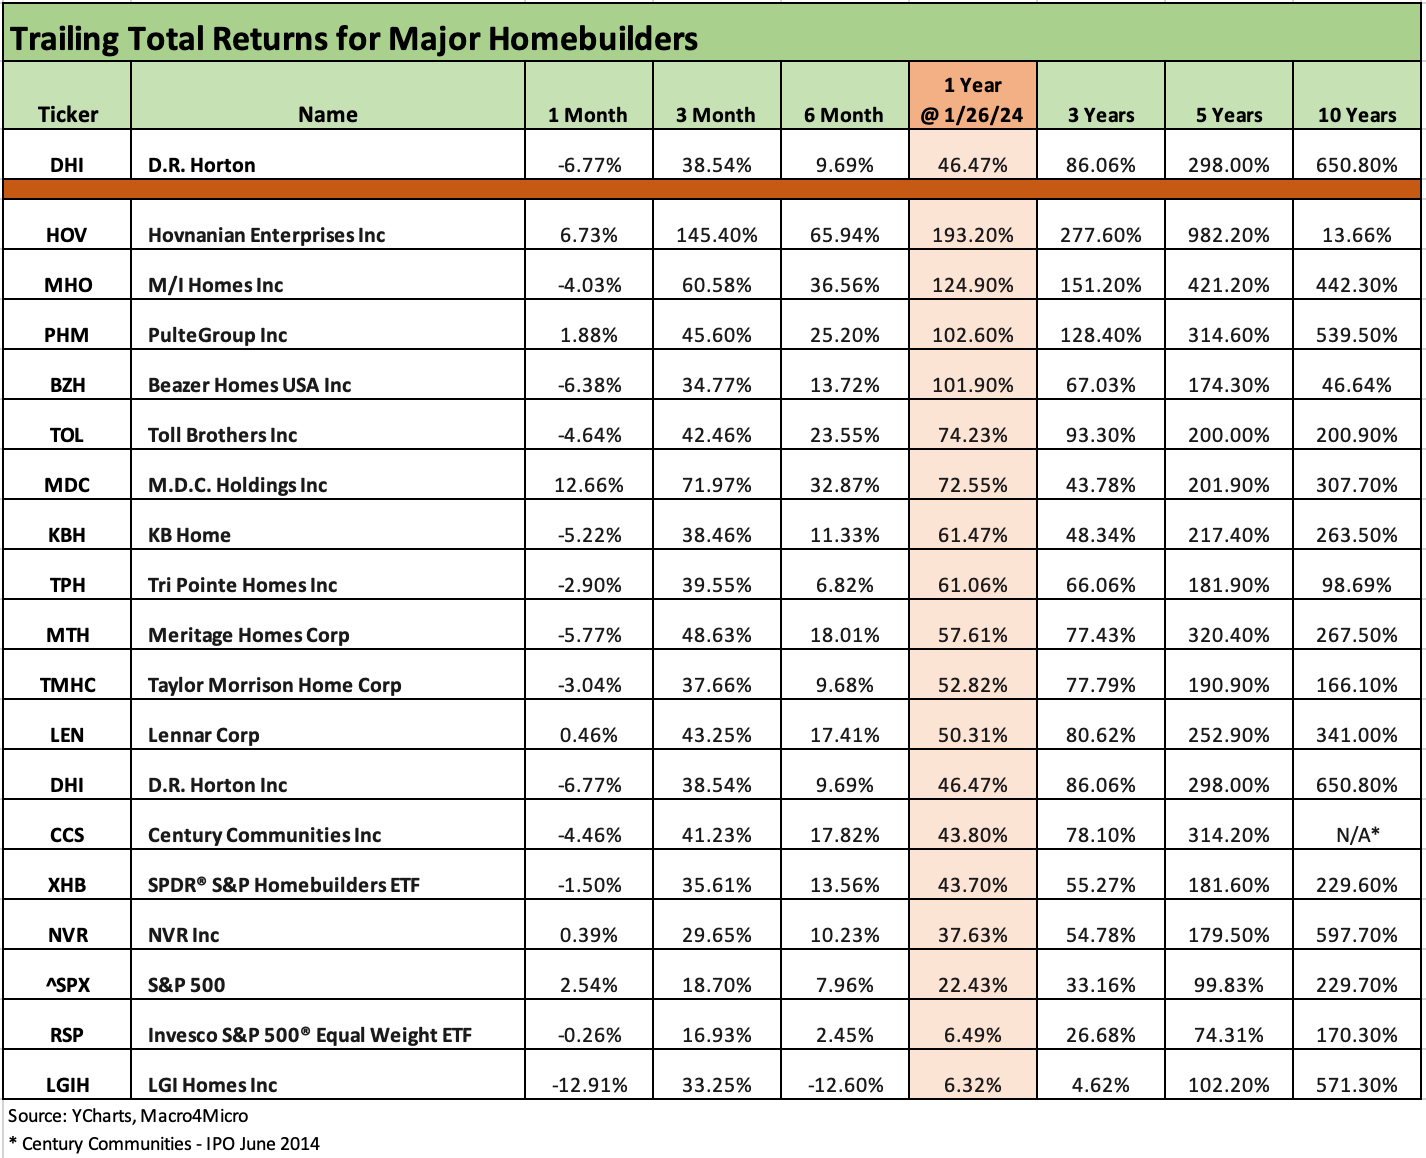
The above chart lines up the majors in descending order of 1-year returns on their equities. The numbers tell a solid story of what the securities markets see as the trend looking forward. Once you get past the small players, small caps, or more troubled players on the mend, Pulte has turned in the strongest performance. DHI is lower down the ranks, but they were traditionally well positioned in valuation in the first place as you look back at 5-year and 10-year numbers.
The peer group of homebuilders posted an impressive positive run across 2023. We covered where the homebuilder ETF (XHB) stacked up in 2023 as it ranked #1 (in the 31 we track) at over +60% total return edging out the Tech ETF (XLK) at 56% (see Footnotes & Flashbacks: Asset Returns 1-1-24). The ability of the homebuilders to capture a rising share of the total home sales market (existing homes + new homes) is something we cover frequently in our housing research.
The UST backdrop will inevitably keep holders of builder equities on edge if it looks like the 10Y UST and thus 30Y mortgage rate will be more stubborn than planned and resists moving too quickly to the downside. We have seen the 30Y mortgage tick back up into the high 6% range in recent weeks. This week the FOMC meeting can shape those views as the market ponders the supply pressures for funding a massive UST supply and soaring interest expense line that will keep steepener advocates in the game around how the UST shapeshifting will play out.
The traditional fixation of street analysts on homebuilding gross margins could be a headwind to stock performance if holders want to protect gains and move on. Higher interest costs roll into cost of sales via capitalized interest on the way to getting amortized into the sale of homes. We also already saw where mark-to-market hedging risk can hit the cost of sales line (DHI in 1Q24 numbers) when rates swing widely as we saw in the Dec 2023 quarter.
Credit risk well in check with a single A quality balance sheet and cash flow…
The asset protection and liquidity strengths of DHI make the company a very low risk BBB1 composite and in substance DHI easily presents a single A tier risk. That is basically where it is priced in the debt market with its short maturity lineup of bonds. The DHI bond supply in the market will likely move lower if the scenario unfolds of DHI paying the Oct 2024 bond in cash. They leaned in that direction on the earnings call Q&A.
Rating methodologies tend to tag homebuilders as higher risk and in need of healthier balance sheets. That is one of life’s ironies given the role of the rating agencies in the housing crisis, but that is an old story. Homebuilders actually have very low liquidity risks given their intrinsic ability to generate cash in slowdowns.
DHI posting strong volumes and a healthy order book…
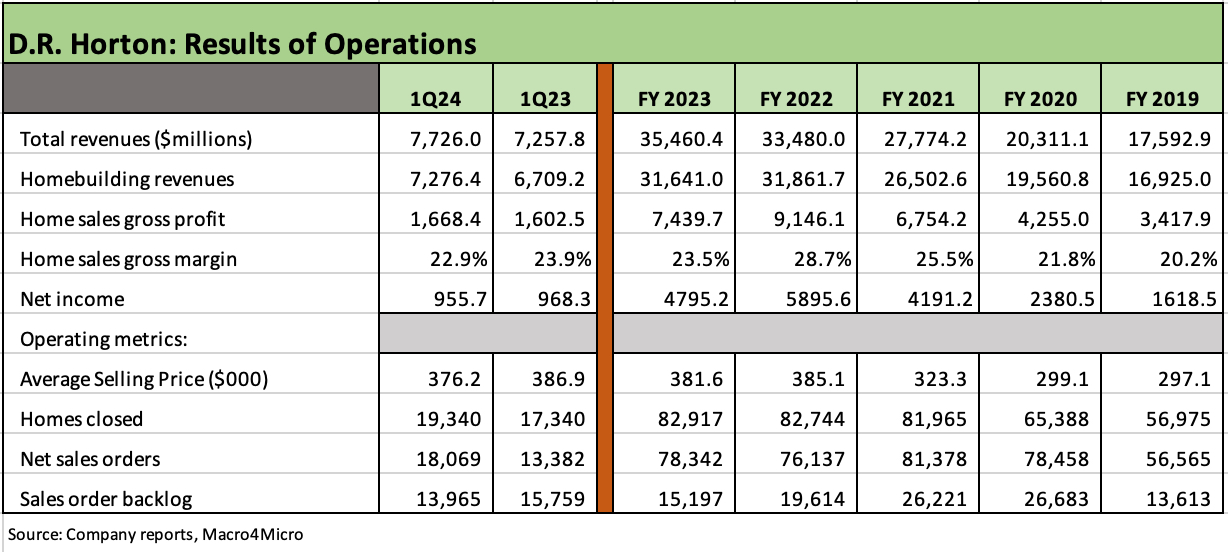
The above table details the distinctly favorable volume trends YoY whether homes closed or sales orders (contracts signed). “Homes closed” rose by almost 12% and net sale orders rose by 35% while the cancellation rate was down to 19% in 1Q24 from 27% in 1Q23. Gross margins narrowed slightly from 23.9% to 22.9%. The average selling price (ASP) was down to $376.2 K but remains substantially above the ASP levels of 2021 2020, and 2019.
The Q&A and stock market reaction to 1Q24 earnings showed the historical fixation on gross margins as the main event (we certainly don’t see it that way in credit analysis) and a lot of focus was on the modest hedging loss used as part of the mortgage incentive strategy for the buydowns. The Dec 2023 quarter saw a wild ride higher and then lower in mortgages and UST that ran the cost of goods higher on hedging losses. After such a heady run in the stock, some “SG&A creep” vs. revenues on rising investments in communities and the hedging loss was a good enough excuse for the market to sell off.
The uncertainties as well as the strong views on where the UST rates (and mortgage rates) will be heading still favor improved affordability of homes if the market consensus does in fact hold.
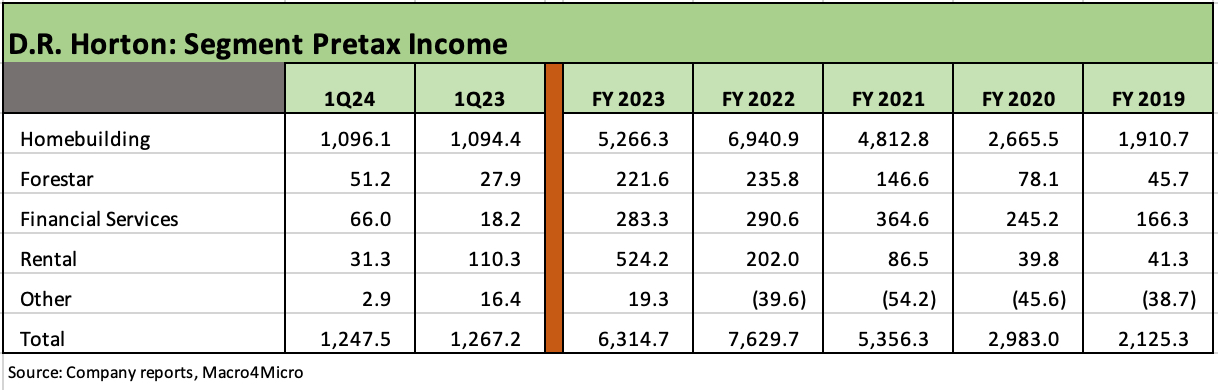
DHI stands out in the peer group for the breadth of its operations across all aspects of housing activity. We looked at these units in more detail in our original credit profile on the company, but the main point is the business segments cut across land development (Forestar), mortgage lending, and rentals. The units are self-funding and not guaranteed by the homebuilding subsidiaries and thus do not dilute the asset protection of the homebuilder bonds that are guaranteed by the homebuilding subsidiaries.
The consolidated financial profile of DHI is also quite strong in its own right, but the units detailed above each have their own distinct capital structures. All units are profitable and doing well. As a reminder, Forestar is a majority-owned public company (ticker FOR) that issues stand-alone BB tier unsecured bonds. Lots controlled/owned by FOR represent a single digit % of the total lots/controlled by DHI at year end FY 2023.
FOR is the more cyclical, volatile operation of the mix but has rebounded sharply with lots sold up 39% in 1Q24, pre-tax income up 84%, and FOR net debt to capital at a prudent 14.9%.
The FOR strategy was tied into a desire of DHI to protect and control more access to land and developed lots. DHI is a heavy user of options to control lots as that growing trend is a core part of the DHI strategy that mitigates balance sheet risk. As a sign of strength, FOR has an unsecured bank line and ready access to the BB tier unsecured debt markets to grow its operation if rates decline and a more sustained recovery in homebuilding volumes get underway in 2024 on improved affordability.
The mortgage operations of the major builders – whether owned or through JVs – have been a critical part of selling strategies as mortgage rates spiked. The ability to enter into creative incentive programs from mortgage buydowns to fee relief (e.g., title/insurance) in the financial service mix has allowed the builders to forge ahead even if at the expense of a relatively small amount of gross margin.
Considering the scale of the inflation and tightening fears, the major builders have delivered impressively, and that was reflected in the stock performances and cash generation of the companies. Most have proven to be very successful in managing working capital demands (deliveries vs. starts) and lot acquisition strategies quite effectively.
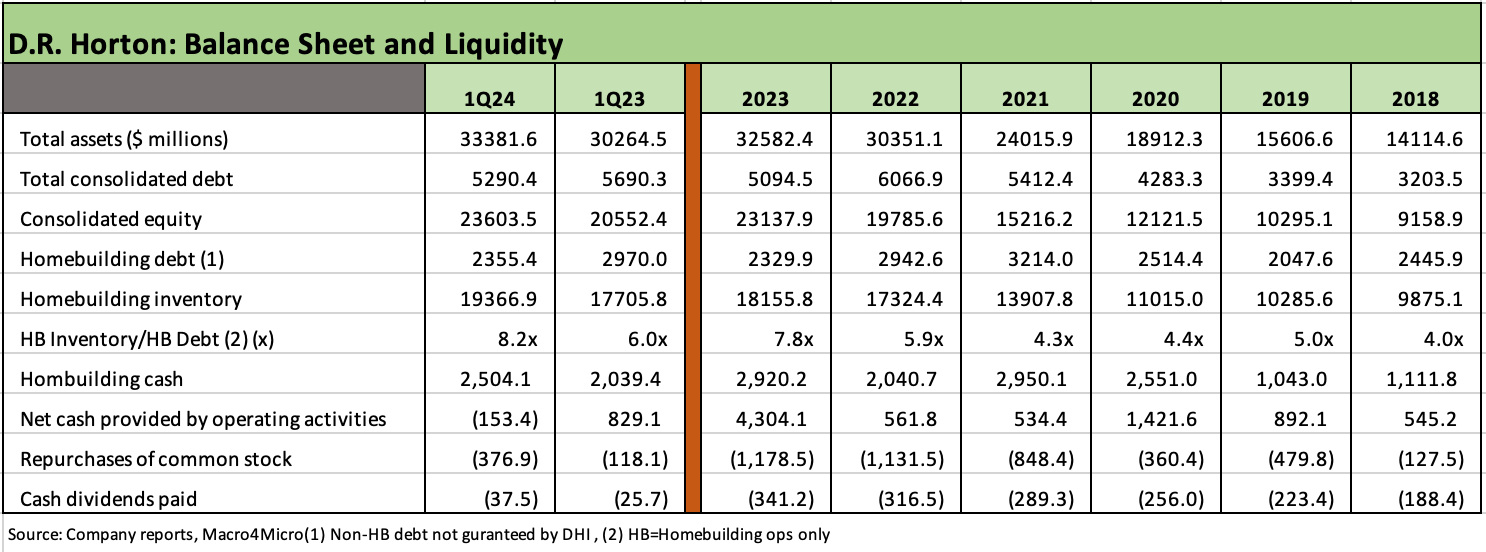
The anchor to the DHI credit story is the balance sheet and liquidity profile with homebuilding cash in excess of total debt and homebuilding inventory at over 8x total debt. That is a lot of liquidity and semi-liquid asset protection (inventory liquidation cycles boost funds flow) that in turn mitigates debt service risks. The cash balance leaves DHI well positioned to pay down its $500 mn Oct 2024 bond maturity in cash and wait for a friendlier coupon environment to refinance.
The company has built up that liquidity support even with a volatile rate market and steady shareholder rewards via higher buybacks and rising dividend payouts as noted in the chart. DHI has guided to $1.5 bn in buybacks and a total of buybacks + dividends approaching $2 bn for 2024.
The asset coverage support just keeps getting better…
The right side of the balance sheet is where bondholders might lock in initially, but the left side shows the extraordinary growth of DHI in total assets as well as homebuilding inventory as the company rides the demographic wave and exploits its very strong market positions across lower cost regions and its leading position with first time buyers and its low average prices on homes.
The company has always been less focused on M&A than the #2 player, Lennar, with DHI more inclined to use smaller tuck-in acquisitions. Homebuilding is still ripe for more consolidation as most recently seen with the acquisition of M.D.C. Holdings by Sekisui House of Japan to create the #5 homebuilder in the US (based on 2022 homes closed).
The ability to leverage scale and build stronger and more cost effective and stable relationships with the supplier chain has been a cornerstone of the DHI strategy. More builders will need to embrace that approach in an industry that still has a high mix of private builders as well as some smaller and midcap players that have been rolling up since the credit crisis and housing bubble.
See also:
KB Home: Wraps Industry Rebound Year, Exiting on Upswing 1-14-24
Lennar 4Q23:Buyer Buzz, Curve Support 12-15-23
Credit Crib Note: Lennar (LEN) 11-22-23
Pulte: Relative Value Meets “Old School” Coupons 11-15-23
Credit Crib Note: PulteGroup (PHM) 11-15-23
Anywhere and Real Estate Brokerage: Judgement Day 11-2-23
Credit Crib Notes: Toll Brothers (TOL) 9-11-23
Credit Crib Notes: D.R. Horton (DHI) 8-29-23
KB Home: Credit Profile 6-24-23
D.R. Horton: Credit Profile 4-4-23