
CPI March 2024: The Steeplechase Effect
Sticky services CPI stays adhesive in March with the CPI MoM of 0.4% tied with 4 other months for 2nd highest since March 2023 (#1 Aug 2023 +0.5%).


The CPI release drove a dramatic swing from a much higher pre-market rise in stocks into a sharp sell-off and double-digit deltas along the UST curve as the cumulative impact of jobs, PCE lines, and inflation push back the “cuts” handicapping for the year.
The +5.3% All Services line and +4.8% “Services less Rent of Shelter” remain among the main barriers relative to their CPI index weightings while the hit from Energy lines was heavy but much less than what was already seen in Feb 2024.
The market saw immediate double-digit jumps in UST curve deltas with a fresh bout of 2Y to 10Y inversion and more screen chatter on the market now pricing in 2 cuts and the odds of a June cut plummeting.
One line that jumped off the page for us was the CPI ex-Shelter line at +2.3% YoY after running at 1% handles for months as that line also weighed in at +0.4% (SAAR) for the month (+0.7% unadjusted).
Back-to-back months of +0.4% MoM CPI for Feb 2024 and March 2024 join the one-two punch of Aug 2023 (+0.5%) and Sept 2023 (+0.4%) that rattled the chain along the UST curve in the fall. The rise of headline CPI to +3.5% YoY from +3.2% and flat Core CPI of +3.8% from last month sets the tone, but more than a few line items in the mix proved discouraging.
The “half full” spin around another bad few months in MoM is to remember what happened after the Aug-Sept 2023 setbacks with the big rally to close out the year. The counter from the half empty angle is “see the jobs numbers” and consider what that means in a services-dominated economy with a hefty load of job openings (see Payroll March 2024: Payroll Spike Brings a Political Theme Shift 4-6-24, JOLTS Feb 2024: Steady and Sideways 4-2-24).
This is not a wage price spiral, but the vulnerability of the CPI story is the labor-intensive services line items and the wage-price connection. That is hard to shake and will be a source of debate at the FOMC.
We get the first cut of 1Q24 GDP later this month, but the investment and PCE lines of the last final numbers in 4Q23 told a very constructive overall story in that set of revised numbers (see 4Q23: Final Cut, Moving Parts 3-28-24). The Personal Consumption numbers to wrap last month in the PCE inflation and Income and Outlays release showed a serious propensity to spend and outspend income (see PCE Prices, Personal Income & Outlays: Sideways Tone 3-29-24).
The spread aggregate “CPI-ex” benchmarks…

These adjusted CPI index aggregates help add more angles in the review of monthly numbers. The data is almost all taken from Table 3 in the CPI release (except Services ex-Energy which is in Table 2). We find them useful and especially in adjusting the CPI line for shelter distortions as we have covered in past commentaries. The metrics offer more vantage points on the sticky Services lines that are turning the “last mile” into an uphill steeplechase with more than a few potholes.
We highlighted “All Items less Shelter” in the bullets above with that YoY metric at +2.3% after a long stretch in the 1% range. The Shelter line has more than a few asterisks around it as often discussed in prior comments. Owners’ Equivalent Rent (OER) at almost 27% of the CPI index violates the “checkbook rule” in evaluating the consumer experience and where the economic headwinds are concentrated. Rent make sense, but OER is a theory too far when inflation impact is about “cash in and cash out.”
We see the total Services line above at +5.3% YoY in March, Services less Energy at +5.4%, Services less Rent of Shelter at +4.8%, and Services less Medical Care at +5.6%. In a Services economy dominated by Services sector employees in the monthly payroll count, it is not too hard to see where the wage connection will weigh on the Fed theories of what can go wrong.
Looking across the Big 5…
Below we update our usual “Big 5” including a roll-your-own set of line items for Automotive, a sector that is a major drag on household budgets even without the gasoline line (we include gasoline in energy). The Big 5 comprise around 75% of the index with autos at 10.6% (13.9% if you add in gasoline).
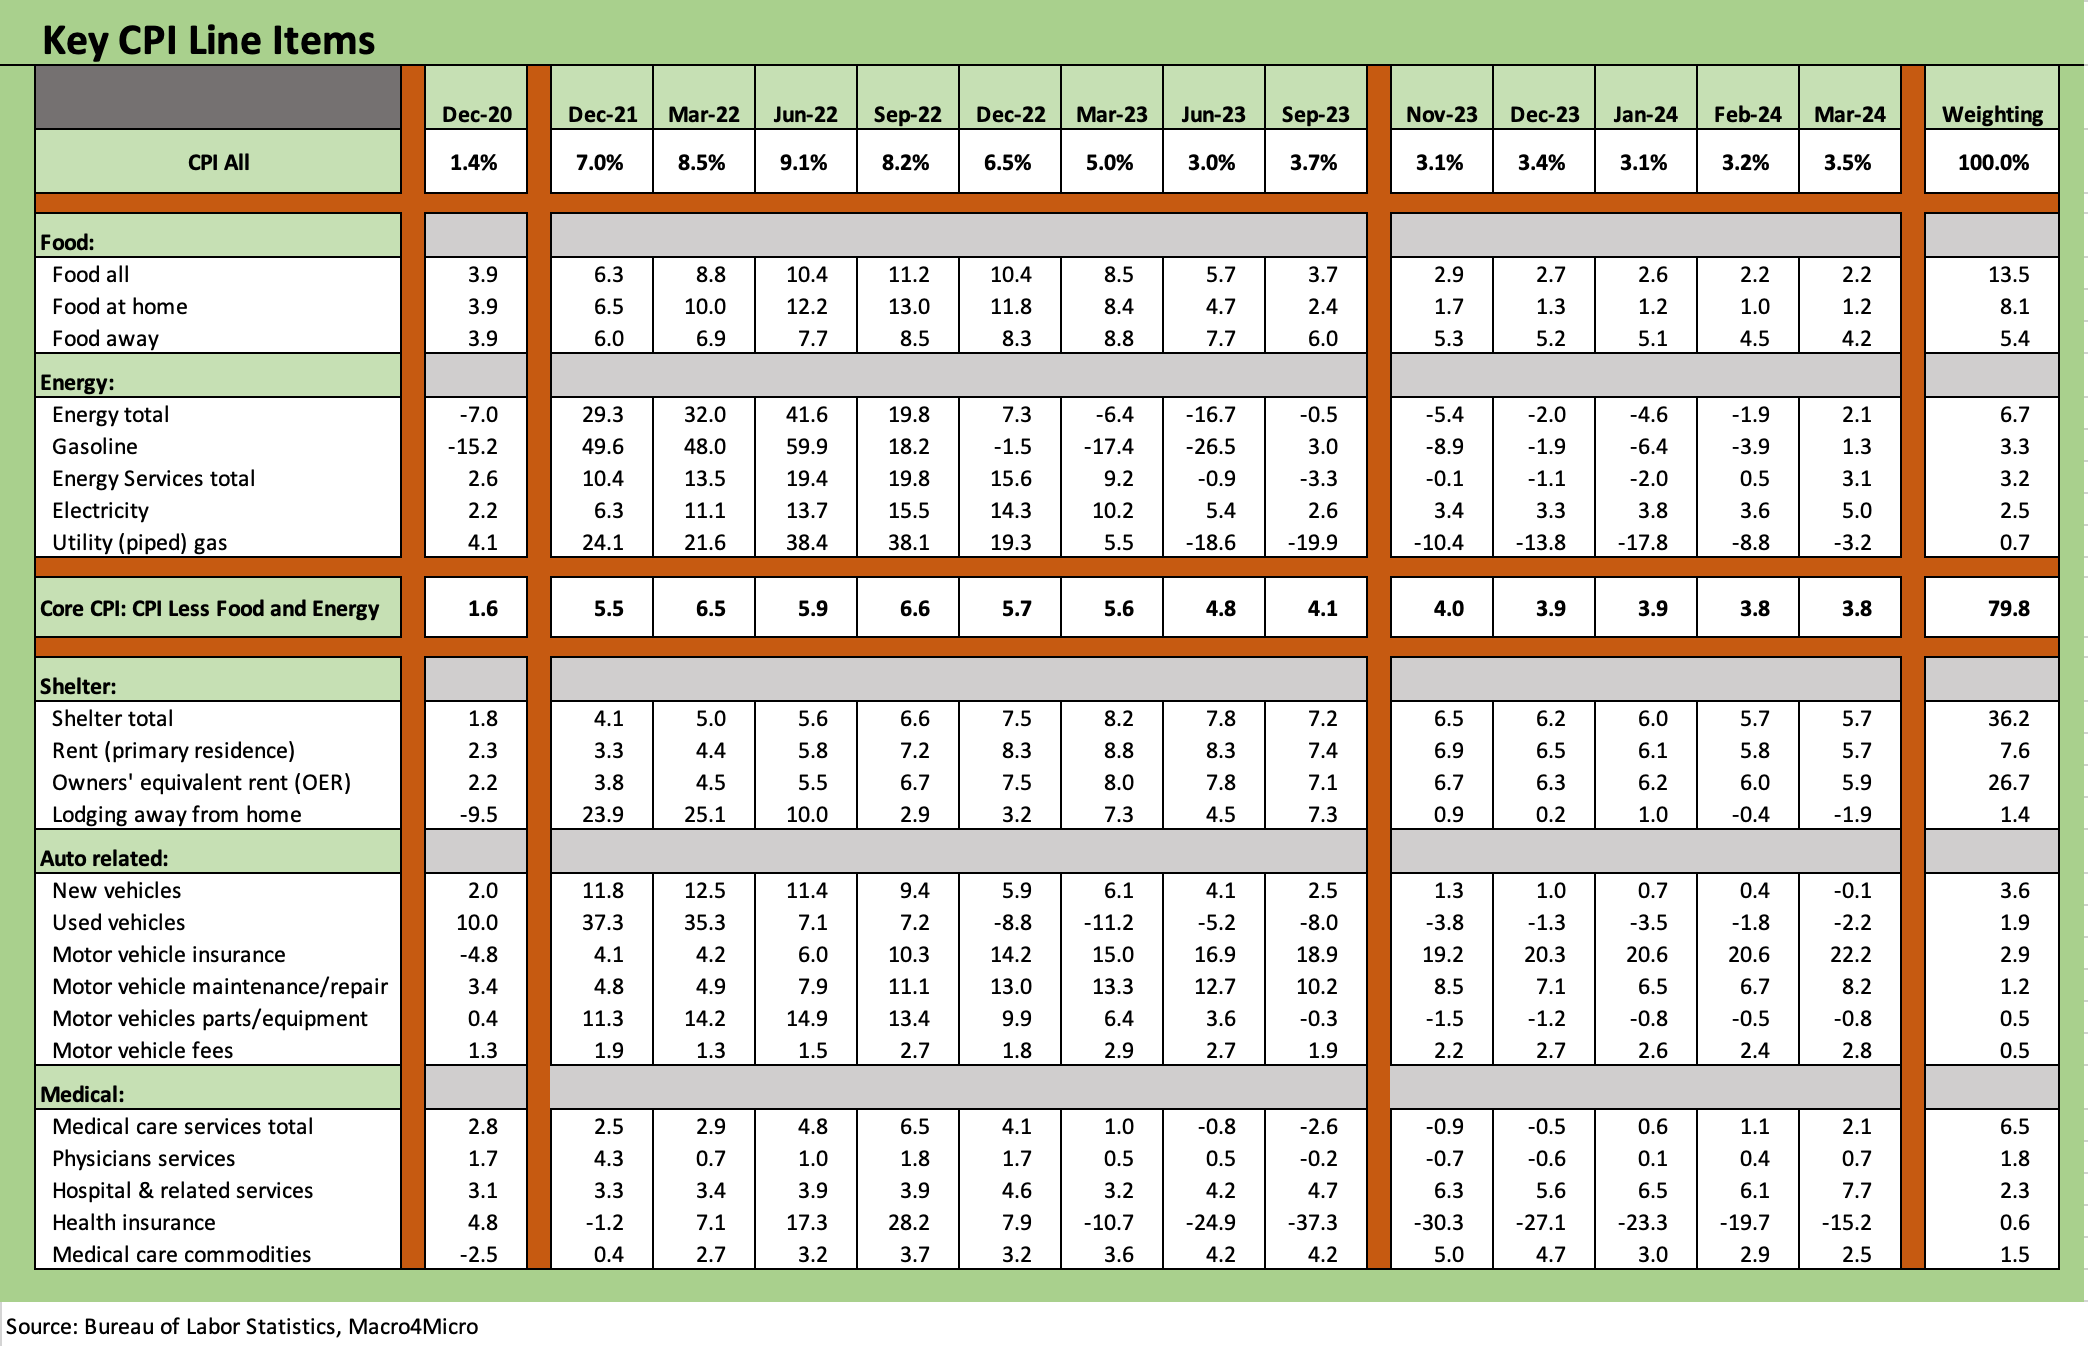
The Big 5 show Food inflation in check based on “Food at Home” numbers. The 1% handle on Food at Home is less of a burden, but it did in fact tick higher YoY even after two 0.0% MoM postings. The CPI line in “Food away” at least ticked lower to +4.2% but that came with a sequential move higher on the MoM side from +0.1% in Feb to +0.3% in March.
As cited in other commentaries (see Inflation Timelines: Cyclical Histories, Key CPI Buckets 11-20-23), Food seldom deflates across cycles even if Energy can move up and down like a roller coaster. Food and the grocery store aisles can be the ultimate perception shaper for consumers and thus politically risky for whoever is in the White House.
Energy will remain a wildcard that could get wilder given the potential escalation of Israel and Iran. “Anything Iran” is always unnerving given history (think 1979) and how that kicked off the last series of stagflation impacts. The Strait of Hormuz disruptions is always a factor on the long-tailed risk short list.
Unlike 1979, this is not the same Iran threat in terms of their ability to change traffic and undermine oil flows. It would be much worse just given the Iranian offensive weapon threat today. Iran usually works through proxies. Most see that possibility as very low, but then again…
The Automotive lines continue to see pressure in auto insurance and along the “maintenance and repair” lines. Motor vehicle fees are also creeping higher. New and Used vehicles have already seen their big swings before supplier chains resumed some semblance of normalcy and COVID distortions eased (notably for used cars), but there is no hiding from higher financing costs for auto credit on the short end of the curve.
Medical care has been under control in the CPI metrics but is getting worse again with Medical Services adding a point in YoY to +2.1% YoY with Hospital and related Services moving higher to +7.7% YoY.
A look at the key CPI Add-ons…
The add-ons broken out below present a wide range of markets in the consumer experience and include another 11.7% of the CPI index. Together with the Big 5 above, the total for the two tables is almost 87% of the CPI index.
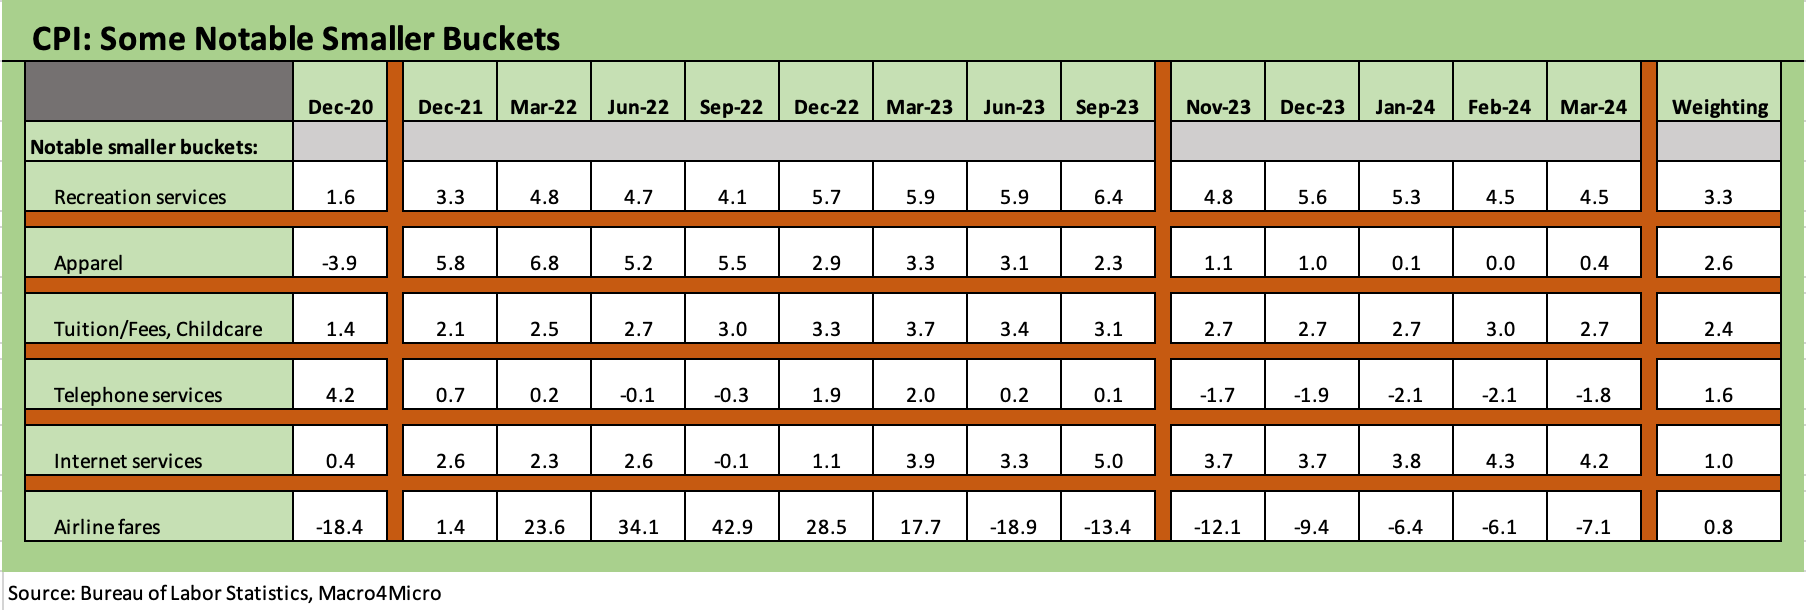
The above chart updates the cross-section of line items that weigh heavily on the activities and consumption needs of the typical household or small business. We see the balance above in this group as slightly favorable with 3 of 6 lower in CPI, 2 higher, and 1 flat. Apparel is ticking higher at a low level and Recreation is flat at lower levels than what we had been seeing in 2023. Airline fares are deflating YoY after jet fuel and outsized travel demand in 2023 shook up pricing.
Yield curve, CPI, and fed funds overlay…

We have routinely looked at “real fed funds rates” in the past and how that frames up in historical context. That is usually in the context of PCE inflation (headline or core) and the Fed’s favorite inflation measure, but in the above chart we update the “fed funds minus CPI” to add some perspective on how the current fed funds vs. CPI differential is playing out.
As noted in the chart, the positive differential under Volcker and Greenspan “did not mess around” with some major differentials on the scoreboard with high peaks in upper single digits (especially Volcker). The current 1.8 points for fed funds minus CPI at least constitutes tightening after the measure stayed negative for what many would say was too long with the Fed too slow to react.
As noted in the median box for some key pre-crisis time horizons in the 1970s, 1980s and 1990s when inflation got a lot of focus, we see the 2 points range as rational in historical context. That does not leave a lot of room right now for cuts without some inflation cooperation.

As we go to print, the above chart updates the intraday UST deltas after the CPI release. Double digits make a statement, but that is not a new experience in this market.
See also:
Footnotes & Flashbacks: State of Yields 4-7-24
Footnotes & Flashbacks: Asset Returns 4-7-24
Payroll March 2024: Payroll Spike Brings a Political Theme Shift 4-6-24
JOLTS Feb 2024: Steady and Sideways 4-2-24
Footnotes & Flashbacks: State of Yields 3-31-24
Footnotes & Flashbacks: Asset Returns 3-31-24
PCE Prices, Personal Income & Outlays: Sideways Tone 3-29-24
4Q23: Final Cut, Moving Parts 3-28-24
Durable Goods: A Small Boost for Manufacturing 3-26-24
New Home Sales Feb 2024: Hope Spring Eternal, but Demand Seasonally 3-25-24
Pension Profiles: Benefit Drain Rates and Returns 3-22-24
FOMC: Hail Powell the Consistent 3-20-24
Retail Sales: Consumers Will Stop Shopping…Someday 3-14-24
CPI Feb 2024: Extra Innings 3-12-24
Employment: Real Numbers vs. Fictitious Dystopian Hellscapes 3-9-24
Histories: Asset Returns from 2016 to 2023 1-21-24
Inflation Timelines: Cyclical Histories, Key CPI Buckets 11-20-23
Will be very interesting to see if shelter actually continues to help Jerome (Blackstone just spent 10B and says rents are accelerating upward again) vs the next few months base effects rolling off being replaced with 0.3 or something like that pressuring the trend the FED and Whitehouse want to see