
New Home Sales Feb 2024: Hope Springs Eternal, but Demand Seasonally
Another steady volume month for new home sales that are running well above the post-crisis median but with prices softening.


New Home Sales are steady but certainly not stellar with sequential trends from Jan 2024 down slightly (from 664K) but up +5.9% YoY with the peak selling season ahead and recent reports from major builders signaling solid trends in orders and deliveries vs. the strains of early 2023.
The mortgage rate drag is by math alone a headwind on monthly payments and relative affordability, but the builders keep driving home their ability to navigate this market as more potential homebuyers fold on the idea of seeing 5% handle mortgages this coming season (ex-builder incentive programs).
Median price levels are at new lows of $400.5K, at the bottom of the monthly rates for LTM and below the 2023 annual median of $428.2K and the 2022 annual median of $457.8K.

The above chart updates the historical context for new single family home sales with the Feb 2024 run rate of 662K above the long term median. The 662K can be broken up into 301K under construction, 289 completed homes, 81 not started. The “for sale” mix at month end totaled 463K with 272K under construction, 106 not started and 85 completed.
The run rate had spent a lot of time well below the long-term median in the aftermath of the housing bubble and credit crisis as new home sales volumes lagged for years. The chart offers a reminder of the COVID period of “flight to the ‘burbs” with the spike to over 1.0 million.
The “crisis to current” median of 563K sets the bar for where the market is today at +662K even with elevated mortgage rates. In both our single name research and macro work on housing, we have covered the creative ways the builders use incentives, fee relief, and mortgage buydowns to drive delivery volumes and orders.
The sales strategies of the builders and prudent working capital management (i.e., a rational balance of deliveries and starts) has boosted builder equities consistently up near the top of the leaderboard in stock returns. Using the Builder ETF (XHB) as a useful indicator (see Footnotes & Flashbacks: Asset Returns 3-24-24), the builders have been right in the thick of the battle for performance leadership with tech benchmarks. See the links at the bottom for some of the single name work we have done on the largest builders.
The builders head into the spring selling season with relatively confident guidance whether in specific revenue and volume targets for the year or for the next quarter. For some builders, full year guidance is not a major talking point since the outlook always comes with the qualifier of how the UST curve and mortgage rates move. Mortgage rates have been stubborn and the primary mortgage products are keyed off the 10Y UST (see Footnotes & Flashbacks: State of Yields 3-24-24).
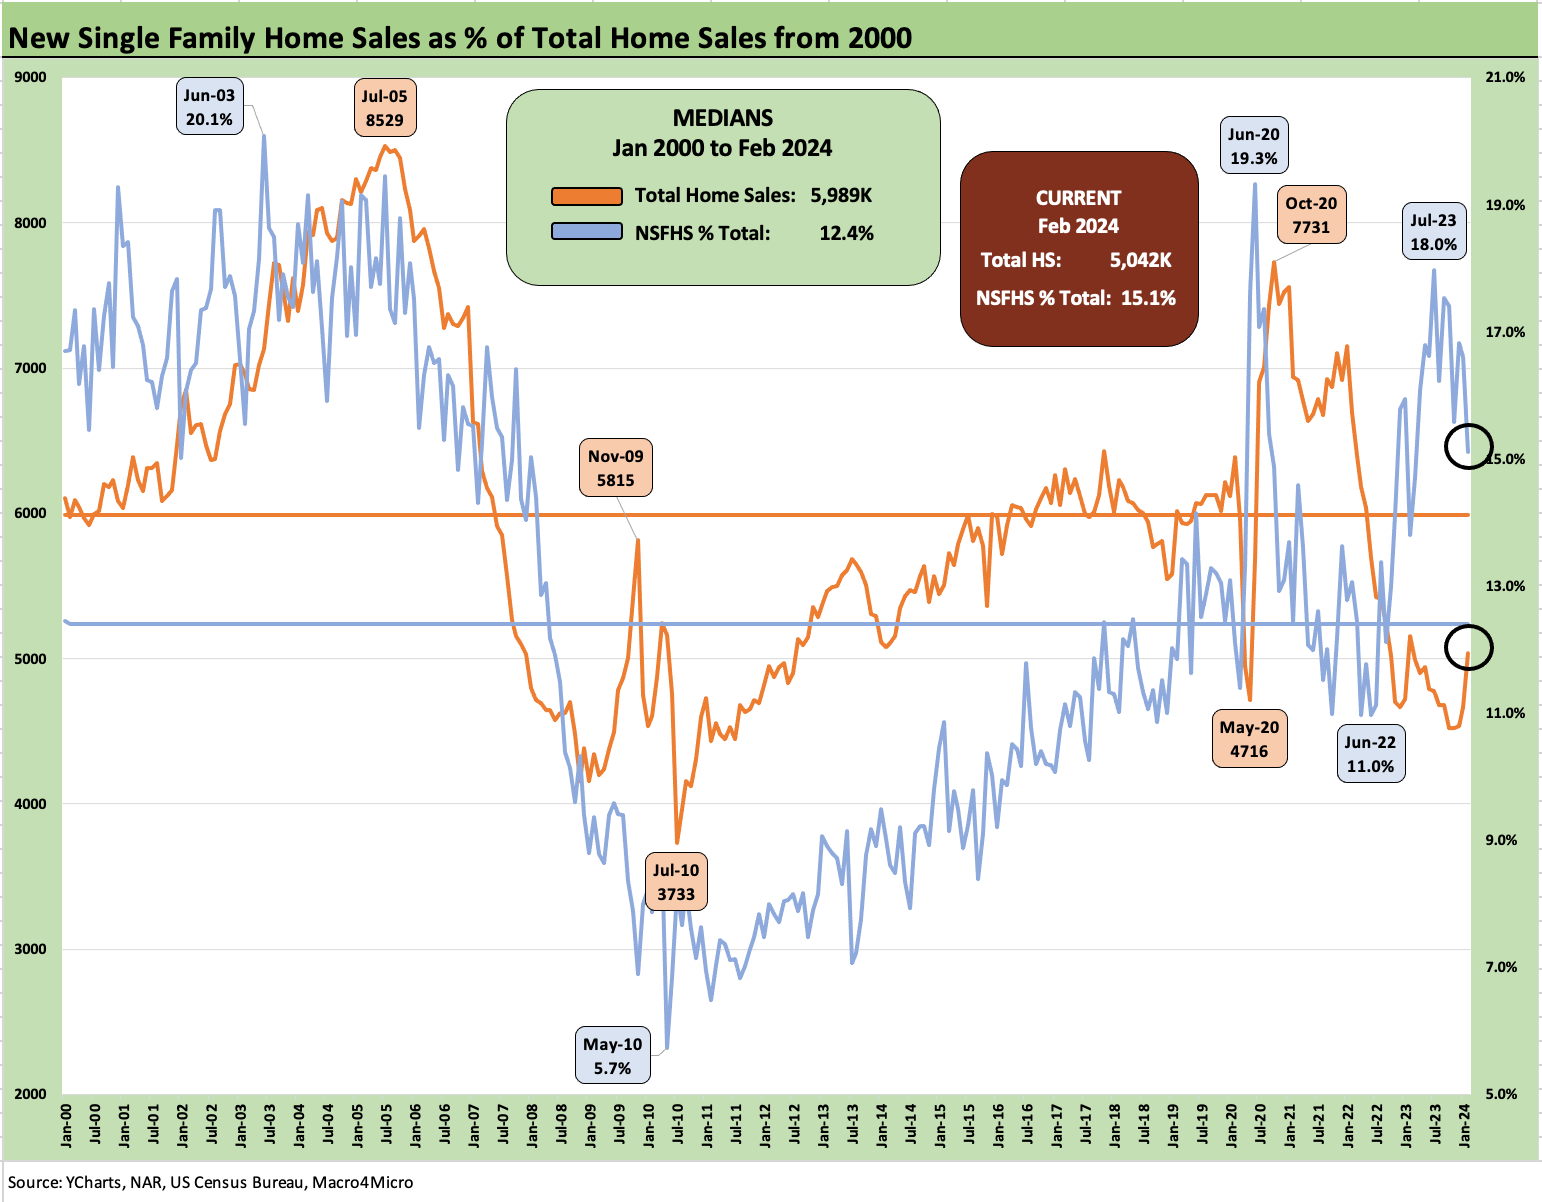
The above chart updates the time series for total home sales and plots the market share of that total held by new home sales. The long-term median is 12.4% and new home sales are currently at a share of 15.1% for Feb 2024. That is down from the 2023 high of 18.0% in July 2023 and the COVID period high of 19.3% in June 2020.
The chart shows the wild swings across the cycles since 2000 with the 20.1% share in June 2003 as the housing bubble was just limbering up for a wild run to 8.5 million in total home sales during mid-2005. The year 2005 was the peak year for homebuilding and was also a period when anyone “above ground” (or near the surface) could get a high LTV mortgage after penciling in the income level of their choice (that may not be an exaggeration based on anecdotes). Not all those homes under construction that were “sold” in the bubble made it to the finish line as the sight of some visible, suspended projects underscored.
The market share capture by the builders is part financial nuance (mortgage buydown incentives) and part obvious (builders can create their own inventory). Builders can generate their own inventory while existing homeowners are locked into historically low mortgage rates and see unattractive refi options on their move-up trade or relocation. For many potential sellers, those refinancing options are unattractive, or they are not eligible at the loan level they would need to seek. Freddie Mac has estimated 60% of mortgage holders are below 4%.

The above chart updates the post-2000 history on volume vs. median home price. The monthly mortgage payment economics are a more dominant variable in the affordability picture than home price. Both are high even if prices are softening vs. 2022-2023. Mortgage math rules the affordability challenge and prices have been supported by the lack of existing home inventory in a market with very strong demand and favorable demographics for builders. The employment backdrop also helps.

The above chart updates the median price history since COVID. The $400.5K is down materially from the peak even if that comes with the asterisk of mix and regional changes. The $300K handles of 2020 and much of 2021 are close again with Feb 2024 on the $400K line, but the mortgage rate math is still rough for the first time buyers and entry level buyers. The rates also make life difficult for existing home sellers under the oft-cited “golden handcuffs” problem of moving from 3% to near 7% mortgages on the other side of a transaction.
On a positive note, these home valuations tell a favorable story for many in terms of home equity levels, household balance sheet strength, and future net asset cushions when rates come down and decisions can be made on monetizing, downsizing, or selling to deal with life’s needs.

The above chart gives another granular set of monthly median price visual for the past two years. The good news for potential buyers is that the median price in Feb 2024 is lower than Feb 2022. The bad news is the mortgage math is much tougher on monthly payments. That is a recurring theme.

The final two charts post the time series for the major regions on new home sales. The above chart plots the two largest regions, and the final chart details the smaller duo with the Midwest plotted vs. the smaller, congested Northeast market where existing home sales and multifamily rules.
The South (with Texas and Florida) is the largest region as classified by the Census (builders can report their geographic segments differently) with the West including one of the largest nations in the world (California).

See also:
Existing Home Sales Feb 2024: Surrendering to Mortgage Market Reality 3-21-24
Housing Starts Feb 2024: Rites of Spring on the Doorstep 3-19-24
New Home Sales Jan 2024: Sales Steady, Prices Resilient but Softening 2-26-24
Select single name homebuilder research:
D.R. Horton: Credit Stronger Even if Stock Takes a Step Back 1-29-24
KB Home: Wraps Industry Rebound Year, Exiting on Upswing 1-14-24
Lennar 4Q23:Buyer Buzz, Curve Support 12-15-23
Credit Crib Note: Lennar (LEN) 11-22-23
Pulte: Relative Value Meets “Old School” Coupons 11-15-23
Credit Crib Note: PulteGroup (PHM) 11-15-23
Credit Crib Notes: Toll Brothers (TOL) 9-11-23
Credit Crib Notes: D.R. Horton (DHI) 8-29-23
KB Home: Credit Profile 6-24-23
D.R. Horton: Credit Profile 4-4-23