
PCE Prices, Personal Income & Outlays: Sideways Tone
We look at a month of steady PCE inflation YoY and consumption that keeps the debate alive with PCE ahead of DPI.


The headline PCE inflation number came in line with expectations with YoY PCE at 2.5% and Core at 2.8% as headline ticked up +0.1 and Core down by -0.1%.
The MoM numbers both ticked lower to +0.3% from Jan 2024 but were higher than each of the 4Q23 months.
Goods stayed in deflation mode YoY at -0.2 % (Durables -2.0%, Nondurables +0.8%) while Services stayed stubbornly sticky at +3.8%.
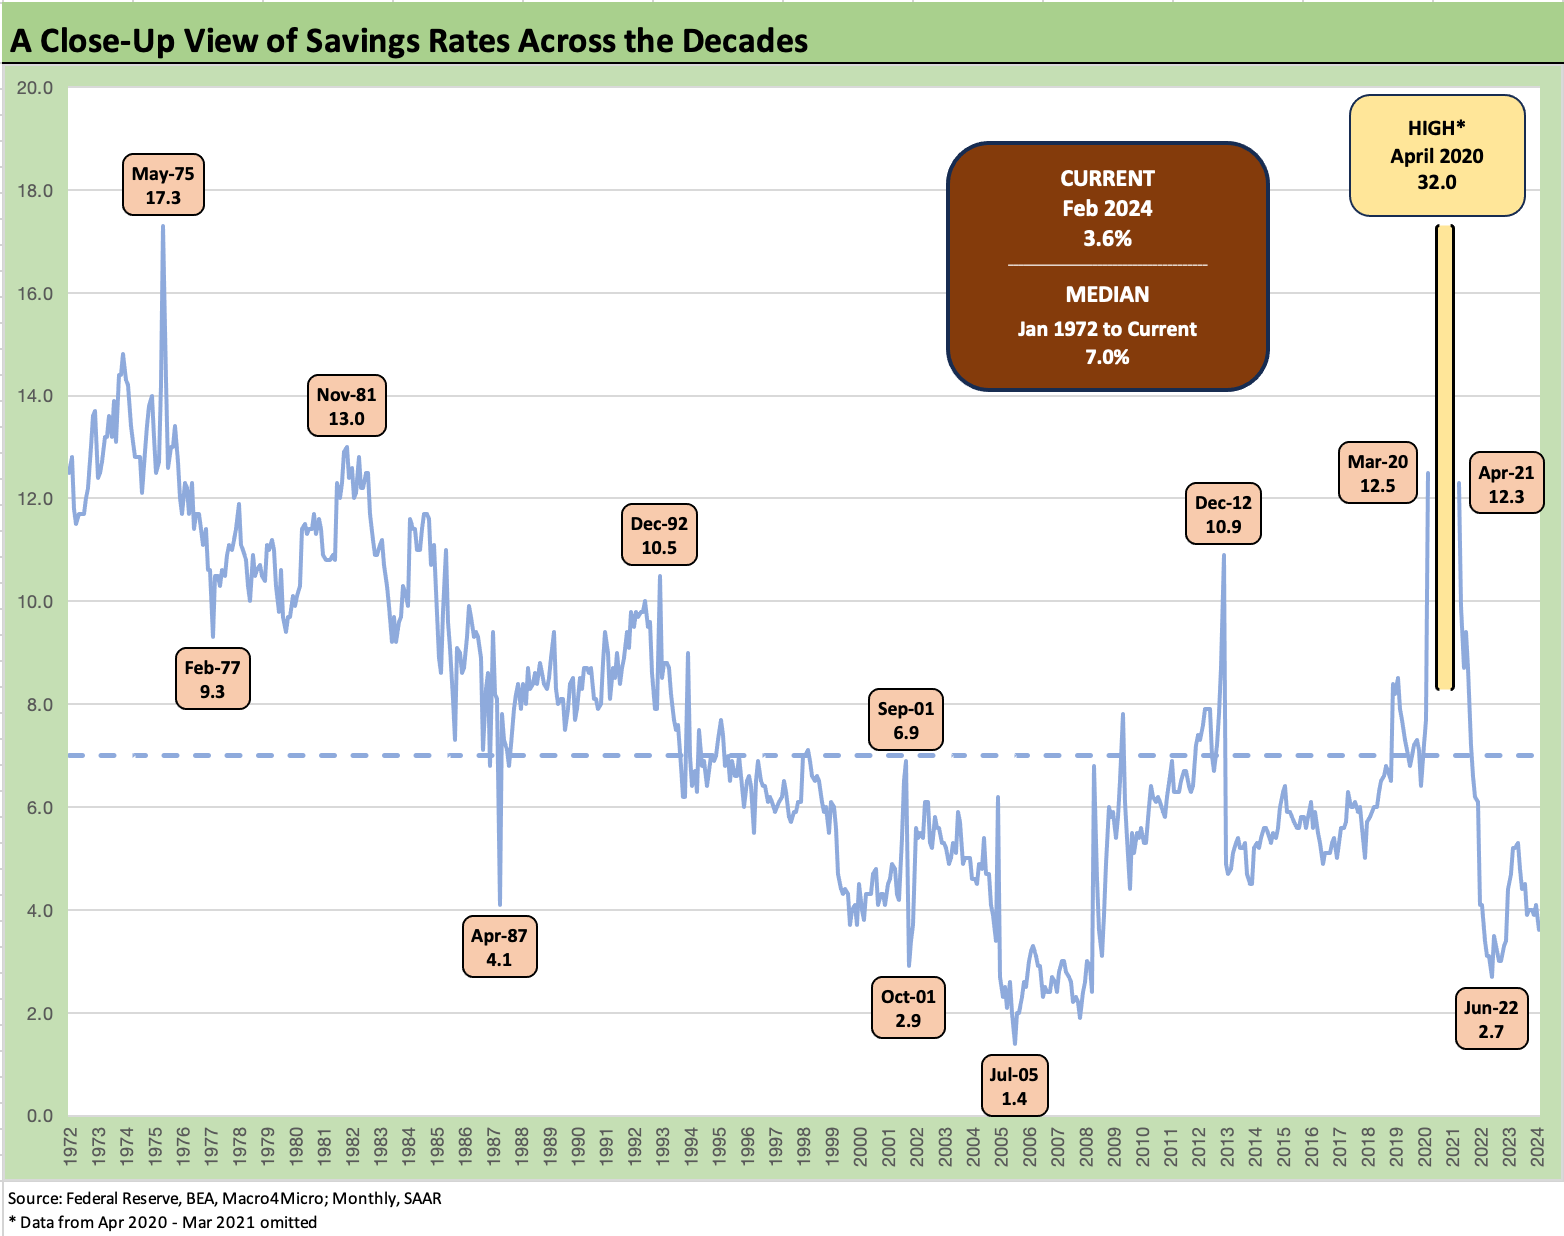
Real Disposable income (DPI) YoY kept moving lower to +1.7% and well below the 2023 months, but real PCE ticked higher sequentially to +2.4% with the savings rate dipping to a low of +3.6% in Feb 2024 after 6 of the 7 prior months posted 4% handles except for Dec 2023 at 3.9%.
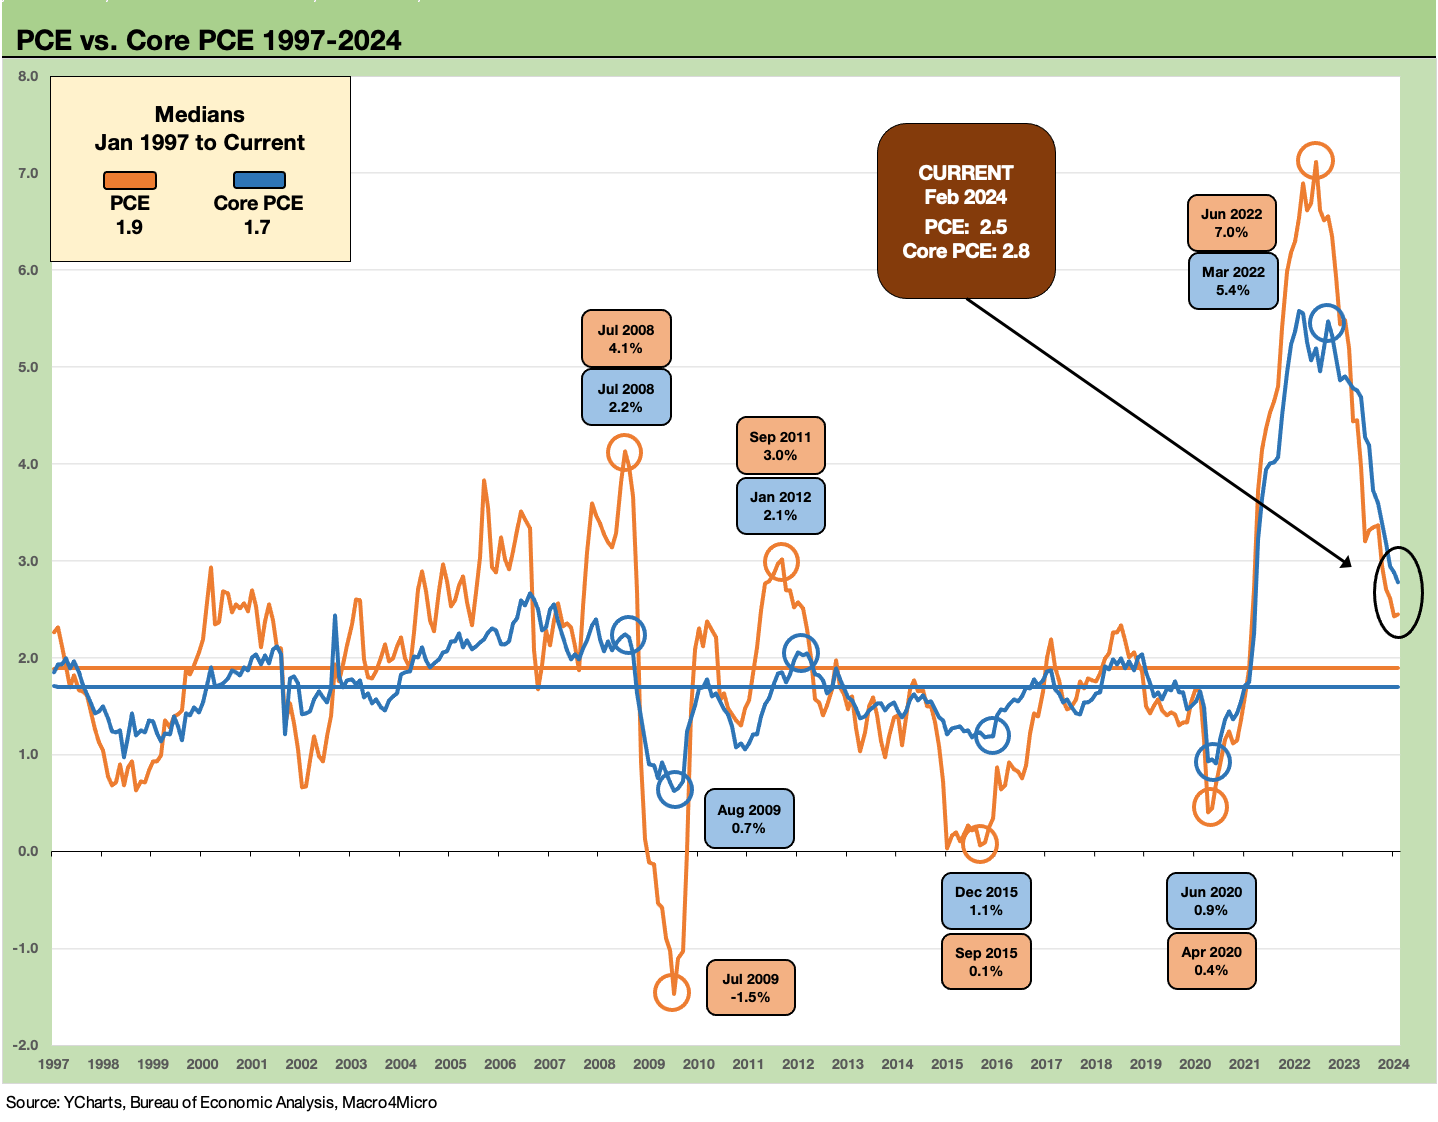
The above chart plots headline PCE vs. Core PCE from Jan 1997 through Feb 2024, and it is not hard to see how a 2.0% target rate is defensible with both medians below the 2.0% line for this time period. That period of course included a brutal credit crisis that almost brought down the global bank system, as well as a deadly pandemic.
The early wave of trouble included a TMT bubble that sent fed funds down too far in response. The market even saw 1% fed funds rates a few years into the recovery in early 2004 under Greenspan. As we now know, that scale of easing by Greenspan set the table for the housing bubble, structured credit excess, and too much systemic leverage in markets on unlimited counterparty exposure.
A longer timeline for PCE vs. Core PCE, as detailed below, edges that PCE and Core PCE median higher to above 2%. At least the current PCE levels are not too far away from targets. Those debates on 2.0% as a target vs. “2-point-something” have grown louder in recent days.

Low-to-mid-2% handles on headline PCE and Core will keep UST markets away from the ledge, but the lack of progress across more of the metrics in Feb 2024 will keep the “3 vs. 2 cuts” debate alive. Personal income edging lower MoM for both current dollar personal income (+0.3%) and DPI (+0.2%) is supportive of a balanced picture, but income fell well short of the current dollar PCE increase (+0.8%).
The numbers came in better for inflation worries than the Jan 2024 heat seen in Personal Income numbers at +1.0% MoM, but consumers are not showing an impulse to dial spending back in aggregate and are saving less of their DPI at +3.6% (see chart below and Savings Rates: Context Across the Cycles 10-27-23).

The above chart updates headline PCE vs. Core PCE differentials across time, and we see how the material swings in Energy can really drive the differences around with the oil spikes of those periods. Energy can spike and deflate in shocking fashion, and it does so often enough where it no longer shocks – just hurts.
In contrast, the decades have seen some major food inflation shocks, but food seldom deflates and the few times it has deflated the magnitude has been small (see Inflation Timelines: Cyclical Histories, Key CPI Buckets 11-20-23).

The above chart updates the recent MoM trend lines in DPI vs. PCE. We see some distorted trend lines in Jan 2023 covered in prior commentaries, but the main highlight for this month was the PCE (+0.8%) well above DPI (+0.2%) and Personal Income (+0.3%).

The above chart extends the timeline on DPI vs. PCE to include the wild period when the market descended into COVID and then the relief and stimulus programs kicked into gear. We have discussed the dynamics of the massive swings in DPI and PCE in earlier commentaries (see Inflation Rorschach Test: Looking at Relief and Stimulus 2-7-23) since it gets swept up in the tactics used to assign 100% of the blame for inflation on Biden.
The stimulus actions show up in dramatic MoM swings. It is worth considering the dynamics of supplier chain dislocations and how that dovetails with fiscal and monetary support delivered to stimulate demand (and jobs and economic recovery etc.). If there is one thing politicians do not like to discuss it is such obscure esoteric topics as supply and demand. It tends to clash with politically driven axes and spin.
There are many lawyers in Washington (and in Congress), and they are accustomed to being “advocates.” That means using facts and concepts selectively to support positions. In Washington, that is sometimes complicated by the inability of the Washington type to grasp the concept (or perhaps give a damn).
The “advocate role” means figuring out how to assign blame to the other guys and take credit for yourself. It is a beautiful thing. The drivers of inflation from the supply and demand side are on a complicated and long list, and the audience is impatient. We refer the reader to the link on that stimulus stretch in 2020 and early 2021 DPI vs. PCE.
What would be interesting in a debate would be to ask Trump and ask Biden what caused the inflation of 2022. Biden might have forgotten what his advisers told him, and Trump never listened to them or cared in the first place. In a debate, Biden would at least get the prepared answer down while Trump would still not listen, would change the subject, refuse to answer the question or simply pin it on the border.
There is no question that the view on how inflation kicks into gear is never a clean one. Having studied economics and more than a few inflation topics in college in the 1970s, one gets different views from different professors. They are dead and buried, but the debate goes on. You are at least supposed to try to get the main issues on the table. Just not in Washington.
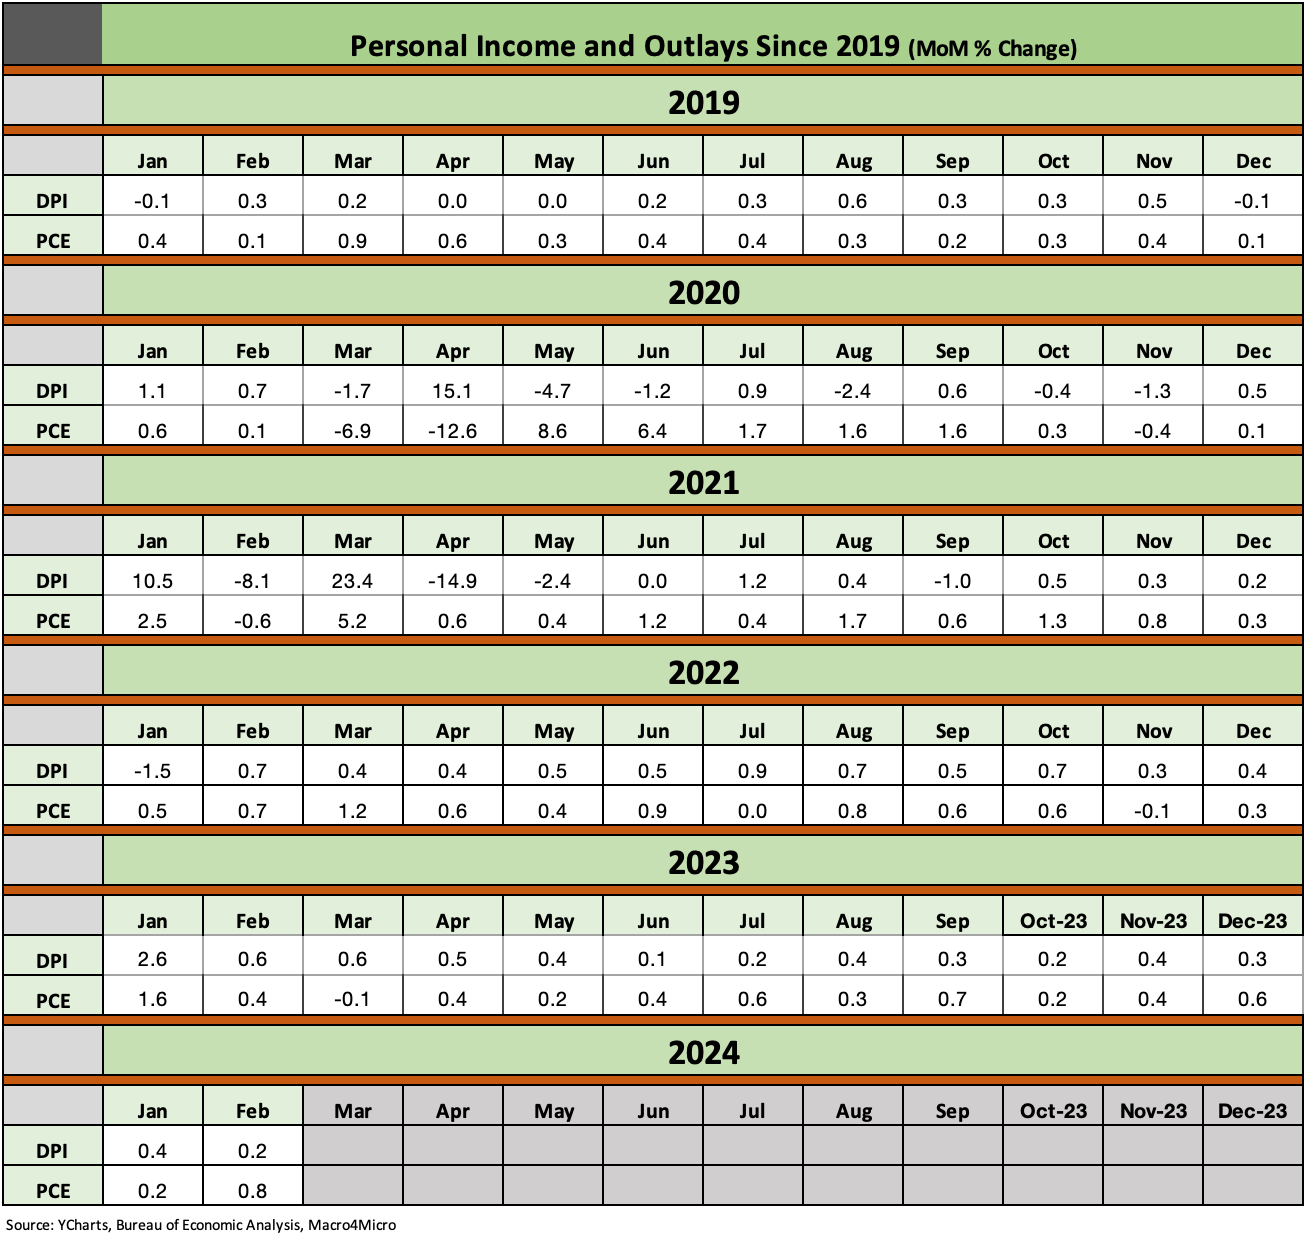
For the above table, we just update the DPI vs. PCE levels by month across the time period from 2019 (before COVID) across the pandemic and then on into the expansion. PCE has been heavy of late and that keeps GDP chugging along.
The income, spending, and savings relationship does not get as much focus in the discussions, but we decided we should update the long-term times series each month in the PCE update. We always look at it and commented in the past (see Savings Rates: Context Across the Cycles 10-27-23), but low savings rates and high consumer debt will be getting a lot of attention as more delinquencies and loss experiences rise.
More jobs and more credit cards help support growth, and the “Mo jobs, Mo money, Mo spending” effect is still very much in evidence. The consumer credit topics are for another day, but this month’s 3.6% saving rate is low. That said, we have seen plenty lower in periods of cyclical strength (see 2005, 2007).
We have also seen lower savings rates in periods of economic pressure (2001). The 2.7% savings rate in June 2022 came with CPI inflation at a peak (9.1%) but payrolls still rising. Wages then started to slowly catch up. We saw another upward revision this past week in 4Q23 GDP numbers, so PCE is holding in well enough so far (see 4Q23: Final Cut, Moving Parts 3-28-23).
See also:
4Q23: Final Cut, Moving Parts 3-28-23
New Home Sales Feb 2024: Hope Springs Eternal, but Demand Seasonally 3-25-24
Pension Profiles: Benefit Drain Rates and Returns 3-22-24
Existing Home Sales Feb 2024: Surrendering to Mortgage Market Reality 3-21-24
FOMC: Hail Powell the Consistent 3-20-24
Housing Starts Feb 2024: Rites of Spring on the Doorstep 3-19-24
Retail Sales: Consumers Will Stop Shopping…Someday 3-14-24
CPI Feb 2024: Extra Innings 3-12-24
Employment: Real Numbers vs. Fictitious Dystopian Hellscapes 3-9-24
Payroll Feb 2024: Record, Revisions, Reality 3-8-24
Inflation Gut Check Jan 2024: PCE Prices, Income, and Outlays Help the Story 2-29-24
Fed Funds vs. PCE Inflation: Peaks and Valleys Across Time 2-7-24
Inflation Timelines: Cyclical Histories, Key CPI Buckets 11-20-23
Savings Rates: Context Across the Cycles 10-27-23
Inflation Rorschach Test: Looking at Relief and Stimulus 2-7-23