
Pension Profiles: Defined Benefit Drain Rates and Returns
We look at Corporate Defined Benefit pension plan drain rates as a reminder of why demand will remain high for IG, HY, and private credit.


We look across almost 100 of the largest corporate defined benefit pension plans for FY 2023 data and frame the range of pension plan drain rates (benefit payments % plan assets).
Pension benefit payout rates tell a story of how ZIRP and low coupon rates have pressured pension cash flow relative to payment demands, but that should gradually improve with more current coupon origination/refinancing ahead in IG, HY, and private credit.
Pension asset allocation decisions for mature plans (i.e., high base of retirees receiving benefit payments) have underscored the priority of fixed income and cash flow generation given the reality of the outflows, demographics and the heavy mix of closed plans in the private sector.
The public sector pension plans remain among the largest in the US, are backed by powerful unions, are less likely to be “closed” (i.e., no more members) so those still face some of the most challenging asset allocation decisions.
The review cuts across 98 companies and 99 plans of over $900 bn in plan assets.
This commentary takes a high-level look at the rate of pension payout ratios (“drain rates”) for major corporate sector defined benefit (“DB”). We use the drain rate as a guide to where the bar is set for funding benefit payments and what that means in the asset allocation game plan. This is just a high-level cut, and we will get more into asset allocation trends for some major plans in other commentaries.
After 16 years of low rates and ZIRP and massive refinancing in the market, we have covered the migration to a higher mix of bonds in asset allocation in other commentaries and in prior research lives. The trends are clear with higher fixed income allocation and lower assumed plan asset returns flowing into actual returns and GAAP pension expense assumptions.
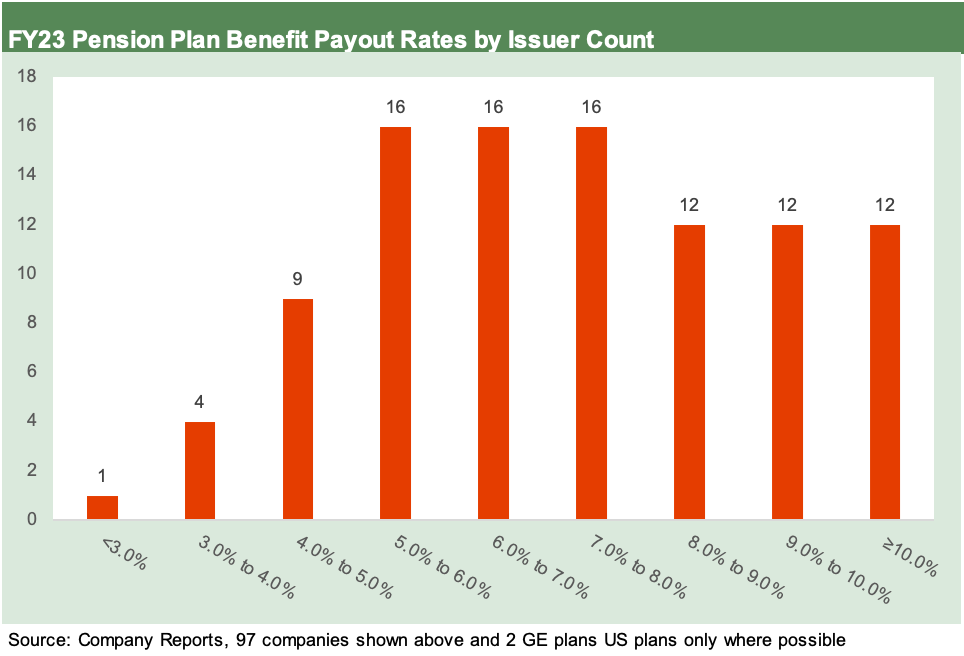
In the chart above, we look at benefit payments as a % plan asset balances (“drain rate”). The message in this piece is that those drain rates are high. That means that plans need some combination of more cash flow generating assets in the plans, more pension plan contributions, strong and steady total returns, or all of the above.
In this commentary, we also update relative underfunding exposure on the liability side and actual 2023 returns for this group of plans. As detailed below, we frame underfunding relative to the projected benefit obligation (“PBO”) for some flavor on the asset shortfalls and surpluses under GAAP.
As we see in the chart at the top, the plans posted a heavy weighting in the 5% to 9% range for the payout rate with a cluster of plans needing to generate cash flows above the IG index par-weighted coupon of 4.1% and for many above the HY index par weighted coupon of 6.1%. The median plan in the overall population paid out 7.2% of assets in 2023 and are projected to pay out 8.4% in 2024. In the context of today’s yield curve, that is a hefty payout.
In the end, shortfalls in income can be offset by asset liquidation to meet the cash payment demands or by more contributions to the plan. Obviously, the corporate DB sponsor prefers to avoid more contributions where possible and wants to have their portfolios perform well and meet their needs. Some markets and asset classes do not always cooperate. The cash generation piece of the puzzle underscores why so many private credit managers see opportunities that will keep growing.
The skeptics worry about the “too far, too fast” risk and asset quality issues. That is why the incumbent managers with a track record have the edge. Having started my career in private placements at an insurance company in the early 1980s, the concept of private credit and customized structures is hardly new. Neither are loans after decades of bank lending – some of it high risk whether lending to emerging markets or leveraged corporates. This current and ongoing wave of private credit would be the modern-day version and a variation on the themes.
The concept of private credit is a topic for another day. We can say again (as we did at a recent FIASI event presentation) that we reject the assumption of adverse systemic risk trends from private credit. There are plenty of reasons why we feel that way. Dark assumptions and extrapolation run amok on asset quality fears are often not applied in broad portfolio context (to the other assets including equities, bank system loans, derivatives and counterparty risk, currency crises, etc.). That is an old-fashioned bear exercise. It is like those medical websites. You can type in “stomach pain” and find out you are dying in 2 clicks. Or you can take Maalox and be fine in an hour.
A look at the Corporate DB plan universe we reviewed…
The universe in this review consists of large corporate DB plans using the required 10-K disclosure available during peak filing season. In our methodology, we only include US-based plans where the disclosure allows. Often just consolidated numbers are disclosed and international numbers are not broken out on materiality.
We use the US pensions for some of the biggest plans (notably autos) since the funding and regulatory framework (including tax treatment) vary widely outside the US. The US plans face more daunting statutory demands and have more clout as debt-like liabilities. US liabilities also are more relevant to what we are trying to frame in USD asset allocation strategies such as debt vs. equities and the relative exposure to US credit assets and liabilities.
The universe in this group is dominated by mature companies with a heavy base of unions and pensions set by collective bargaining deals. The list consists of the consolidated results for 98 companies and 99 disclosed plans (GE contributing two distinct plans). The combined total of the 99 reviewed included over $930 billion dollars of Projected Benefit Obligations (PBO) and just over $920 billion of pension plans assets. In other words, it is a substantial sample within the DB private sector universe. We include 99 plans where possible and 98 for the payout rate. Only one plan had limited disclosure on benefit payments (the first chart above only included 97).
Supply of credit and fear of asset quality issues…
Credit is the key ingredient in economic expansions and contractions, so a new source of lending gets back to the age-old question of “When is too much of a good thing (credit risk) going to create major quality problems and too much heat?” Econ 101 says credit drives expansions and credit contraction can cause recessions. Too much credit causes bubbles (common over the last 4 decades) while collapse of credit causes depressions (has not happened since the 1930s and the Fed will step in today to cushion downside as evident in all modern credit market recessions).
Our point is that there will be a lot more credit assets available for pensions to choose from. The quality and scale of those asset pools are more theory at this point.
On the supply side of the lender base, the scramble is on by credit managers to drive up AUM. Major USD credit indexes are at record highs. Loan and private credit indexes are being recrafted and expanded all the time. The same is true for retirement funds under management in DB or defined contribution (DC) funds. The seasoned credit managers want to be on the receiving end of pension asset reallocation and the fund flows that come with the rethinking of portfolio strategies.
As the pension asset-liability topic gets debated, it is important to remember that we have not had a capital markets backdrop like this current one – ever – in the postwar era. That is true even if just on the breadth and scale of the asset range, the demographic profile of the retiree base, and the inflation fighting process running in parallel since 2022 (Volcker was before the explosive growth of credit markets and post-boomer demographic shifts).
Credit markets did not develop on a large full-spectrum scale until the 1980s (arguably mid-1980s). When people start spinning past vs. prologue scenarios, keep in mind that the past credit cycles are limited even if excess and bad outcomes are not hard to find. The end of Glass-Steagall, the rise of derivatives, too many variations on structured products and shifting regulatory oversight of the banks/brokers are all critical structural nuances across these cycles.
Combine that backdrop with higher rates after a protracted ZIRP and QE period with income generating assets and coupons being repriced, and this is a very opportune time for both traditional asset managers and private equity players. Private equity can use private credit as either part of their leverage finance businesses or as stand-alone, more mainstream credit operations. The next few years will be demanding for due diligence and will be frenetic for asset gatherers and originators.
The retirement fund challenge…
The Corporate DB plans will be just a small slice of that process with public sector plans over half the total retirement asset base. For a sense of scale (Source: Pension & Investments), the Top 1000 US Retirement plans manage over $13 trillion. The Top 200 plans are $9.5 trillion. Around 40% of the allocation in defined contribution plans are allocated to US stocks. For DB plans, the allocation is around 20% US stocks with a comparable allocation to US fixed income. That allows a lot of room for reallocation if demographics call for more income and especially for DB plans for benefit payments. The allocation questions on credit are for another day.
Before we get to the chart exercise, a few more tidbits include the fact that 2/3 of the Top 200 retirement funds are DB plans and a little over 1/3 are DC plans. The trade rags cite DB assets in the Top 1000 at $7.7 trillion and DC assets at $5.3 trillion. DC assets are growing more rapidly given their availability in the new pension benefit programs across the services sectors that dominate the US economy and the closure of DB plans in the legacy corporate sector space.
These numbers we include here are just frames of references, but they are reassuring on the demand side of the equation as pension plans contemplate the expanded array of alternatives along the risk-reward continuum from UST across credit, equity-linked, and the Baskin-Robbins array of US equity subsectors. Riskier credit can be an allocation from high quality fixed income or from equities. Using the old 60-40 starting point, risky credit can come out of the 60 or the 40. It is all part of filling in the risk return preferences and optimizing the mix of price and income returns in the overall picture.
Corporate DB plan drain rates…
For this exercise on Corporate DB plans, we highlight a few metrics in the mix of charts:
Trailing pension plan drain rate for 2023: This metric looks at the rate of benefit payments for the year relative to the asset base in the pension plan. We frame the FY 2023 benefit payments % beginning plan assets (that chart is at the top).
Forward pension plan drain rate for 2024: We look at the footnote disclosure for the forward pension benefit payments estimated for 2024 and compare that to ending plan assets for 2023. With such a material move in portfolio returns from 2022 to 2023, the 2024 version set against ending plan assets version is less daunting for many companies but still a major barrier for most.
Unfunded pension liability % projected benefit obligation (PBO): This metric gives some scale to the underfunded dollar amount per GAAP vs. the PBO. The unfunded pension obligation is derived from the “PBO minus plan assets.” The underfunding can be held up to various yardsticks such as market cap or EBITDA (or EBITDAP) among others. A frame of reference is helpful when looking across peer groups. In this case, the yardstick is the total PBO as set at year end for the most recent set of assumptions. Again, we use US only where available.
Return on plan assets: The actual return on plan assets % beginning assets can really swing around each year and especially in periods such as the move from 2021 to 2022 into 2023 drives home. The actual return can give context over a series of years on how the asset mix performance looks vs. peers and relative to plan asset return assumptions. The performance is more about the asset allocation with so many DB plans moving toward higher bond concentrations.
Top-down and bottom-up views on pension risk is a good exercise…
We recently looked at Boeing as the #1 corporate pension plan as a good example (see Boeing: Peer Group Performance and Pension Details 2-14-24). The Boeing pension ranked #12 for all plans but #1 in the private sector peer group for combined DB and DC plans. The major public sector plans ranked #1 through #11.
Corporate DB pension plans have been getting a lot of breaks from legislative and regulatory tweaks since the credit crisis on discount rate assumptions used by ERISA. Funding demands remain a major risk factor in the public sector domain, where the plans are larger and most still open given the clout and scale of the public sector unions. The disclosure is not there to do a similar exercise, but many surveys get generated on the topic.
When 10-Ks roll in after year end, digging into the asset allocation details (actual and “target”) for Corporate DB plans can be a useful exercise as you look back over the cycles and see the migration away from equities toward more bonds and more income assets with a heavier weighting in credit risk. These days, the private credit topic gets swept up in the debates around what a major growth asset class in credit means for the logical portfolio targets. Retirement funds will be at the top of that list just on the sheer size of the market.
We have also seen a lot of private sector plans use risk-transfer transactions to move DB plan assets and liabilities off their books to insurance companies. It is no coincidence that insurance companies are experts in debt markets with asset managers serving insurance, pension, and mutual funds. Insurance companies were also the kings of private placement debt assets for decades.
Drain rates using 2024 estimated benefits vs. ending 2023 assets…
In the chart below, we look at the benefit payments % beginning plans assets for each bucket from below 3% to 10% and over. The capital markets saw solid total returns in equities and bonds alike in 2023 off a base that had been beaten up in 2022 (see Footnotes & Flashbacks: Asset Returns 1-1-24, Histories: Asset Returns from 2016 to 2023 1-21-24). That is good news, but the chart below underscores those high returns were certainly needed after a bad year.
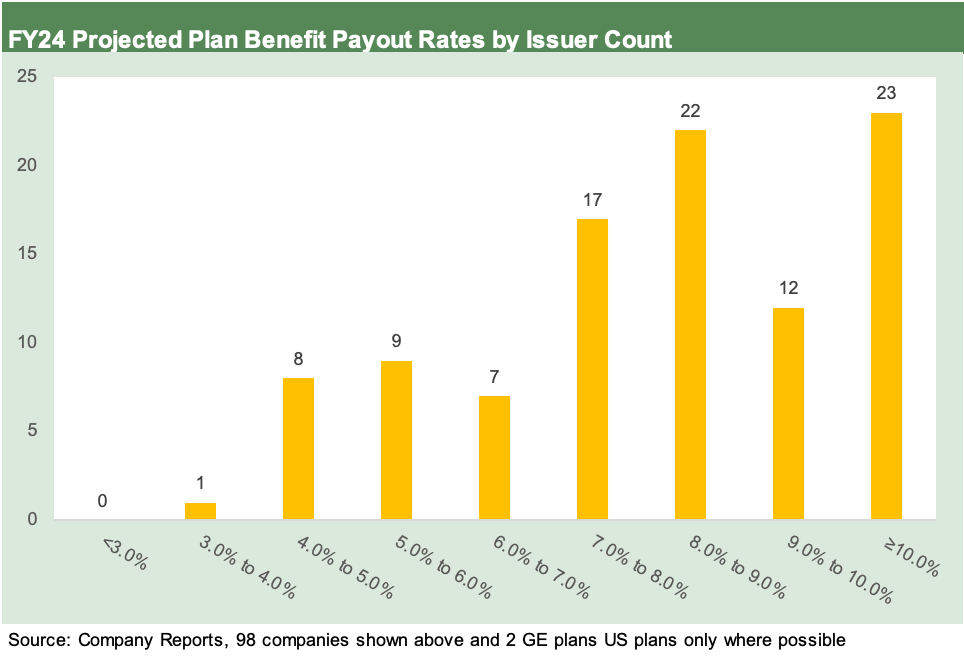
We see 23 of the 99 plans reviewed by this metric are over 10% and a total of 74 plans above 7%. Those rates exceed the par-weighted coupon on the HY index. To the extent a plan is closed, the shift toward bonds has been common. That means some new ideas will be needed to manage the outflow demands.
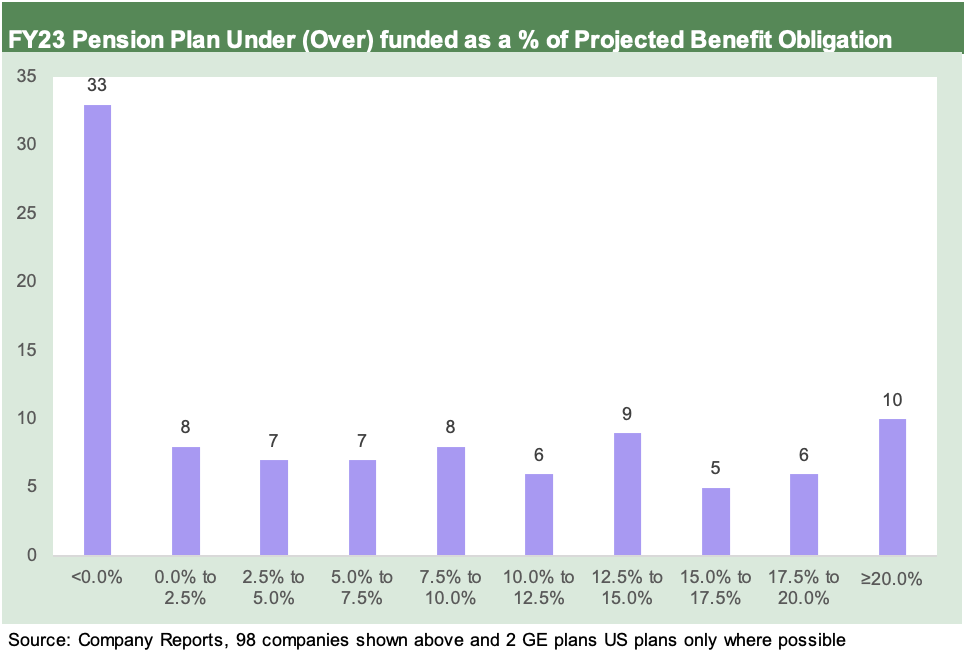
The above chart gives some context to the size of the underfunding vs. the projected benefit obligation. Overall, 33 of the 99 pension plans in the group reviewed were overfunded. The remaining were underfunded with the median sitting at 5.7% underfunded vs. PBO. An obvious point is that the bigger the plan PBO, the bigger the underfunding in dollar terms for that plan for a given % of PBO.
As stated earlier, the underfunded liability can be held up to various frames of reference from equity market cap to EBITDA (or EBITDAP), but attention also had to be paid to the pension income/expense line. As we discussed in the Boeing pension commentary, some companies can actually generate GAAP income instead of expense on a massive liability even when materially underfunded on a GAAP basis. That is part of the GAAP quirks one just needs to be aware of. Assumed plan asset returns operate as a contra-expense line and can throw a curve ball.
The same is true for the “two sets of books” for ERISA vs. GAAP on the risks that unfunded pension liabilities even pose. The “real risks” are the ERISA-based funding demands and claims risk. GAAP underfunding is supposed to be a proxy for that risk, but the ERISA pension relief since the credit crisis has offered meaningful (and at the time) critical protections for corporate entities to ease the threat of a cash flow crisis or credit contraction in the markets due to fears of the ERISA statutory clout.
Unfunded pensions are the “greater among not so equals unsecured debt” in terms of claims power at the table in the Chapter 11 process. So unfunded pensions are a problem in the long run for weaker credits. That is why they are very seldom terminated. It is a disaster for all (including the PBGC).
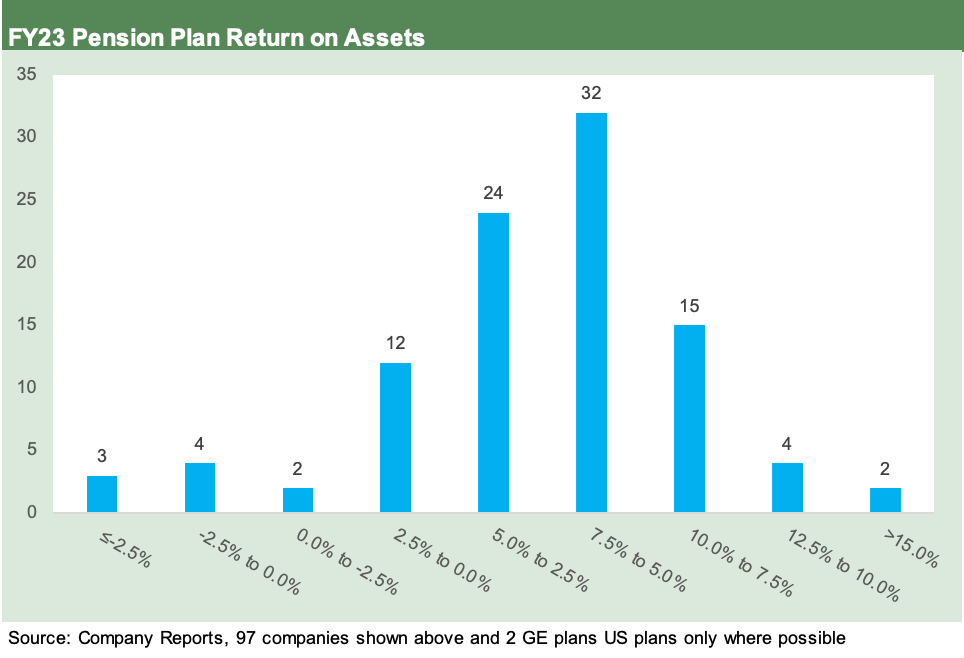
The actual returns (returns % beginning assets) are straightforward enough in a rally year for assets in 2023 after a broad battering in 2022. This chart quantifies for this universe what we already know—2023 was a positive year for asset returns with the wild finish even helping bonds in 2023 (see Footnotes & Flashbacks: Asset Returns 1-1-24 ).
The two biggest return buckets run from 5% to 10% with 5% to 7.5% at a count of 24 and the 7.5% to 10% range at a count of 32. We would highlight that the high mix of fixed income in the major US plans were a brake on the upside seen in various equity asset classes, but there is a very good reason for the debt heavy weighting in so many closed plans whether asset liability management or the need for lower volatility and cash income. GM and Ford are among the best examples among large plans.
Again, we reviewed the moving part of the 98 companies (99 plans) and only 1 had inadequate disclosure. A few had material distortions during the year on mergers, spin-offs, and risk transfer transactions. That did not undermine the utility of this group as a frame of reference. That is important when you get into the single name weeds. This was top down.
A little background music…
We thought we should include some background on pensions as an add-on for this piece.
In past cycles (economic cycles and default cycles alike), we found ourselves navigating the pension footnotes to look for patterns and outliers. Anyone who followed autos and airlines had little choice but to dust off the books and legal filings on controlled group claims risk, joint and several liabilities, how termination liability worked, and the process it takes to get a plan terminated in bankruptcy, the role of the PBGC in the picture, and what it all meant for handicapping recovery rate risks.
Bears (the shorts) talking their book would play “fun with numbers” on pension and OPEB to really drive down the bonds and minimize theoretical recovery. Delphi was one of the more notorious but those are stories for another day.
Pensions and credit analysis context…
The pension topic was often one that would factor into recovery rates handicapping on names in Autos/OEMs/Suppliers (e.g., Delphi and GM), Airlines (too many to list, but each of the Big 3 or their component parts saw time in Ch 11), and Steel (the bad old days of the integrated steelmaker freefalls). After more than a few near bankruptcies, Chapter 11s, liquidations, and various court battles, the flavor and substance of the pension and OPEB risks had plenty of empirical examples across the decades.
The Section 363 gambit with GM and Chrysler was another one for the ages in legal sleight of hand and sometimes circular logic. In that one, we saw one case where the company indicated they could not get financing “since the bankers said so” while the bankers said, “the company cannot get financing since the company said so.” Classic.
The auto history is a long and convoluted one, but in the end, the UAW pensions moved to the new entity. OPEB and the protection of those liabilities in the GM and Chrysler cases gets more involved given how they had morphed into debt obligations and an independent VEBA transaction from a prior collective bargaining process. Those were also protected, but that is another story for another day.
In a world where defined benefit pension plans were increasingly being closed (no more members) or frozen (no more accruals), and for a smaller subset to troubled companies where pensions were terminated, the risk of unfunded pensions for ERISA purposes (vs. GAAP) was getting plenty of airtime in the markets across the cycles. That was notably the case when the airlines and steelmakers were getting restructured and sometimes liquidated.
The typical outcome is that pension plans generally were not terminated given the brutal impact on the measurement of the legally enforceable liabilities with statutory clout. That would just cause more damaging fallout for the Chapter 11 process with termination liabilities a complicating factor.
At the risk of oversimplifying, the pension often comes out on the other side of a financial structuring with the plan closed or frozen (but not always). There clearly have been exceptions to that as underscored by the balance sheet exposures of the PBGC (Note: I personally have a Lehman pension on the books at the PBGC, and I also got to visit them during the auto bailout years). The PBGC has a tough job, but they have plenty of rights when the plans are in jeopardy.
For those companies most-exposed, the topic of pension-adjusted leverage was a risk factor many lenders and bondholders would contemplate when framing valuations vs. the peer group. The use of EV multiples and adjusted EV multiples for pension and OPEB (basically, health care) is not a topic for today, but the whole EBITDAP and EBITDAPO exposure exercise and related multiples could add some other variable into the relative value analysis.
In the end, the EV/EBTDAP comps exercise is useful, but seldom embraced as the primary metric in equity markets. It often ends up as more like a tiebreaker. The same was true for statutory minimum funding requirements and ERISA risk in cash flow analysis. Those are topics for other days.
Pension vs. OPEB: debt vs. contract risk…
Our short form version of unfunded pension liabilities vs. OPEB is that DB pensions are debt-like risk and OPEB is contract risk. The OPEB claims risk often comes down to debates around vesting and how the language in the plans were written. The complexities of collective bargaining agreements make for higher OPEB claims risks than the salaried employees, and the status of vested retirees generally is another variable.
One lesson we always took away from the bankruptcy and court filing over the years is that two parties can always find a lawyer who can argue 180-degree opposite views with 100% certainty and conviction on what a given party is due and what is a legally enforceable liability and dollar amount of claims. GM even used to put in its disclosure (long ago) that they did not view OPEB as a legally enforceable liability.
In future commentaries, we will get deeper into the weeds in specific names. The most interesting aspects of DB plan disclosure to us beyond the simple GAAP measurement of funding and PBO is looking for asset allocation patterns as more DB plans are closed and the actuarial wheel keeps turning.
For a closed plan, demographic trends will play out and the grim reaper does his thing on timelines. That typically means rising fixed income exposure and more focus on income-generating assets to fund benefit payments. After retirement, the longer-term time horizon on investments gets shorter. There has also been an increased pattern of buying down pension exposure with lump sum payments. These are among the items to look for in the footnotes.
See also:
Histories: Asset Returns from 2016 to 2023 1-21-24
Footnotes & Flashbacks: Asset Returns 1-1-24
Pension Plan Drain Rates: Plan Benefit Payments % Assets 2-16-23
Contributors:
Glenn Reynolds, CFA glenn@macro4micro.com
Kevin Chun, CFA kevin@macro4micro.com