
FOMC: Hail Powell the Consistent
The market celebrates the lack of big surprises and embraces the 3 cuts affirmation with a rally.


The FOMC projections stay in somewhat of a holding pattern with some narrowing of the range of projections since Sept and minimal adjustments from Dec 2023.
The median midpoint for fed funds for 2024 holds at 4.6%, flat to Dec 2023 and down from the 5.1% in Sept 2023, which had for its part marked a bump from 4.6% in the June meeting.
The current projection of 4.6% fed funds midpoint for 2024 show 2 of the “Gang of 19” at a 5.5% upper range still holding, 2 at a 5.25% upper target, 5 at 5.0%, 9 at 4.75% upper, and 1 at 4.5% upper.
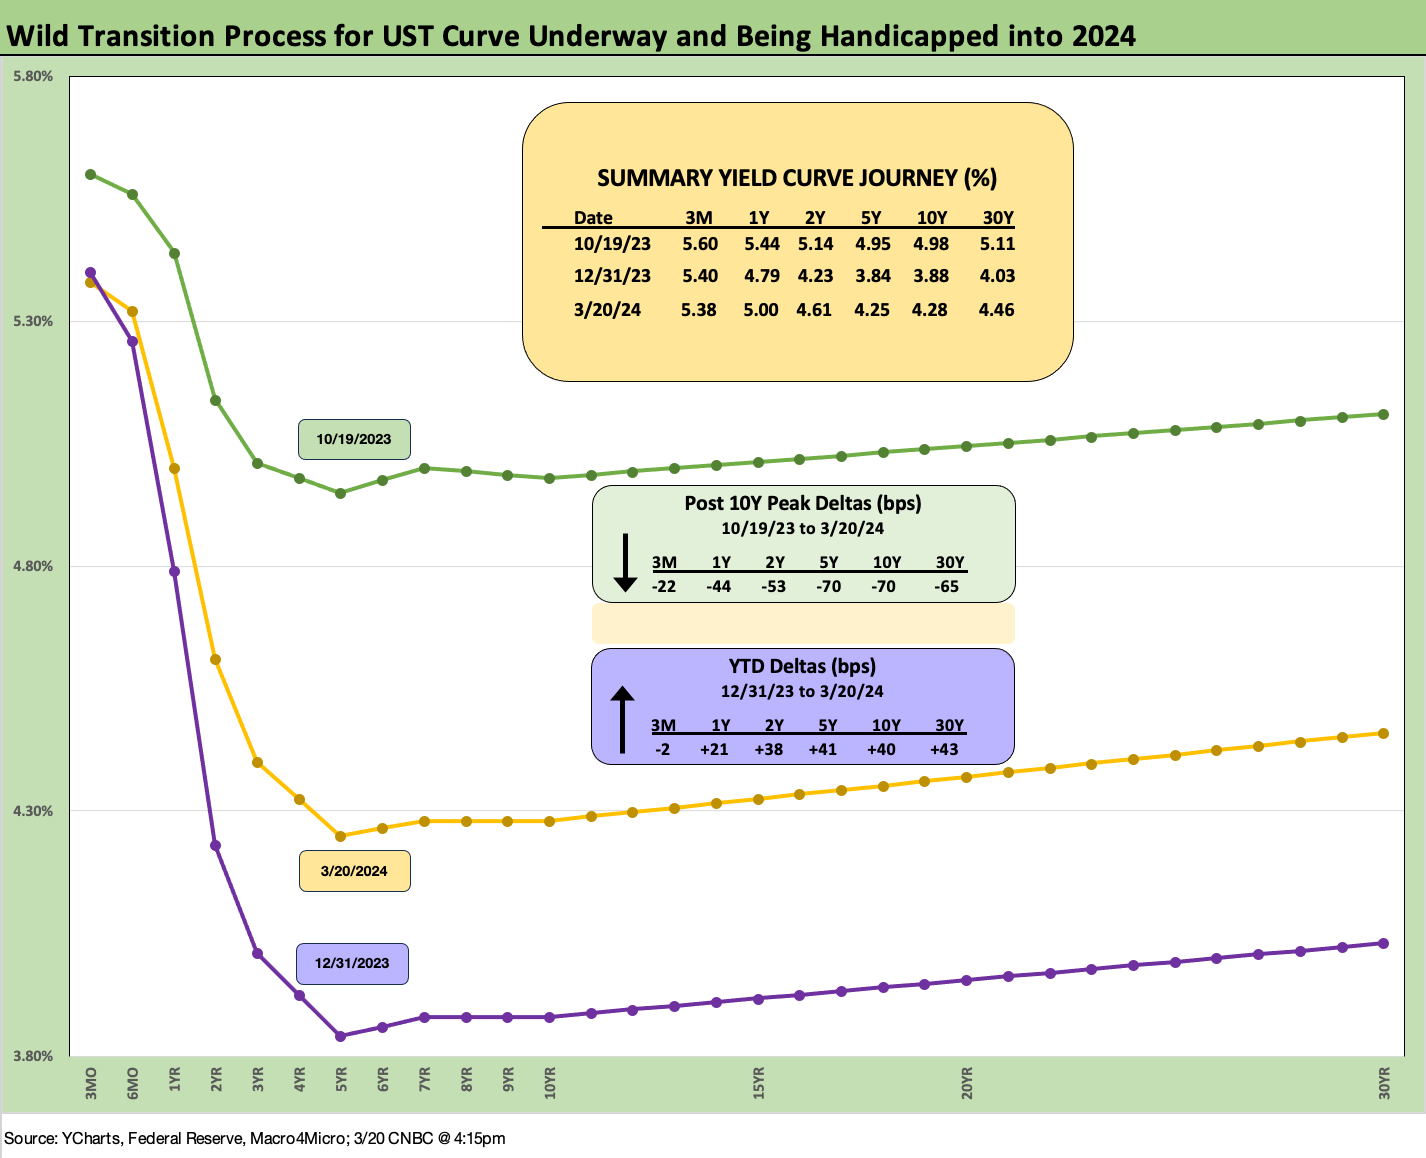
The FOMC dot plot was expected to be a point of market tension one way or the other given how bullish the market was to start the year. Many major investors were looking for 5 to 6 cuts and a downward shift across the curve. The Fed was sticking with 3 cuts. As noted in the chart above, the UST is going in the other direction YTD even as it edged lower today as we go to print.
One fear ahead of the FOMC release today was a move to a 2-cut consensus in the forecast, but it remained at 3. Some of the talking heads see more likely a 2-cut outcome in 2024 as the year goes on. Spring selling season for autos and housing are ahead along with a cleaner read on summer vacation season (airline bookings, etc.). The spring season will go a long way to firming up the odds makers on the 2 vs. 3 cuts debate.
It is only March and there is a lot of year left, but cyclical trends and the broader macro picture we regularly watch are not signaling material weakness yet just by seeing payroll move higher. Jobs have shown some light signs of softening with the number of unemployed rising despite the consistent positive payroll adds. The wider array of consumer and industrial indicators are holding steady even if some are muddling along.
Employment has been the most debated threat to the inflation trend line (see CPI Feb 2024: Extra Innings 3-12-24, Employment: Real Numbers vs. Fictitious Dystopian Hellscape 3-9-24). The FOMC projection for 2024 unemployment released today ticked down to 4.0% from 4.1% in the Dec 2023 FOMC numbers. As noted in the chart, the path of the UST across the tightening cycle has been a burden for many but is down from the 2023 peaks as we follow each week in our Footnotes and Flashbacks publications (see Footnotes & Flashbacks: State of Yields 3-16-24).
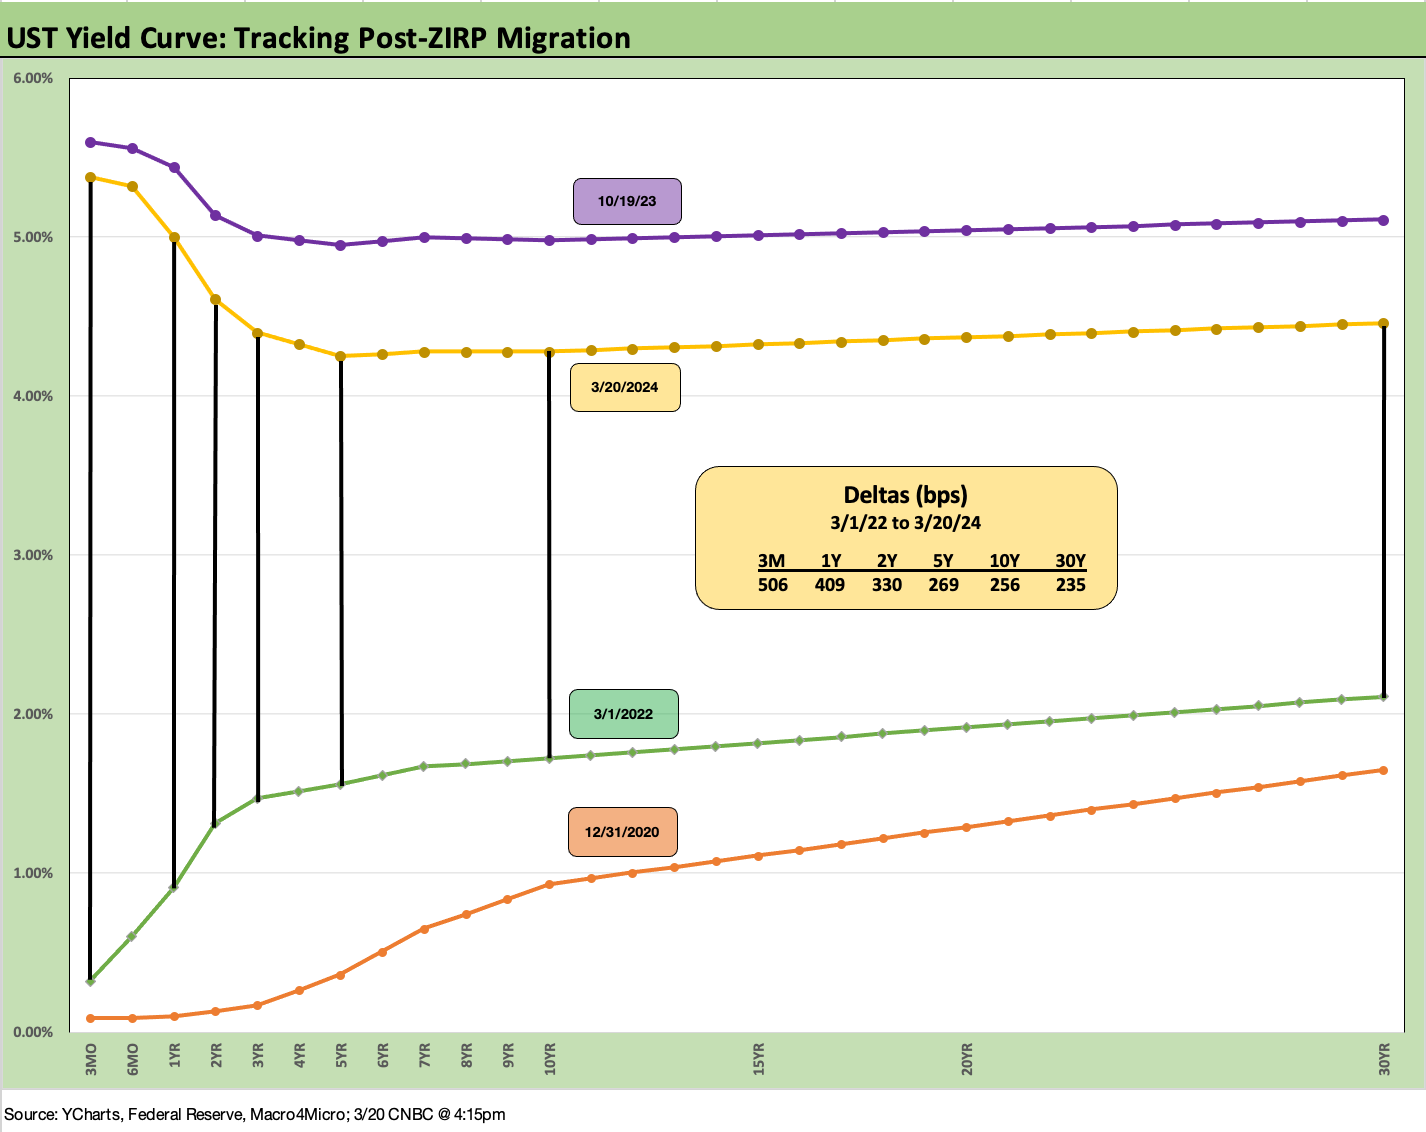
As higher rates have played out, the real economy and the stock market have been adjusting to only 3 cuts and rallied again today. The UST curve story has been higher YTD but is materially lower than the peak levels of late Oct 2019.
Inflation has been moving in the right direction despite somewhat of a stall in Jan-Feb 2024. The PCE inflation forecast remains at 2.4% for 2024, flat to the Dec 2023 meeting. The Core PCE inflation projection for 2024 ticked higher to 2.6% at the median for 2024, up from 2.4% in the Dec 2023 meeting. Next week we will get a fresh read on PCE and the final set of numbers on 4Q23 GDP. We also get another read on durable goods along with income and outlays in the PCE report, which is the big one for the Fed’s favorite inflation gauge.
Ceilings and floors…
At the very least, the outliers on high rates such as the 6% handle in Sept 2023 are now getting reeled in. We see 2 of 19 dots at unchanged for the high end of fed funds projections. We see a floor of 4.5% upper range (midpoint 4.375%). The biggest cluster on the dot plot was 9 of 19 at 4.75% upper range (4.625% midpoint).
Looking back to the fall, Sept saw more than a little UST turmoil on the way to peak rates in the third week of Oct 2023. The Sept 2023 forecast saw a ceiling fed funds forecast for 2024 at 6.125% and a floor of 4.375%. The Dec 2023 meeting showed a high of 5.5% upper target by the end of 2024 and 5 of 19 votes for 100 bps or more of cuts in 2024. The June 2023 projection for year end 2024 fed funds rate was 4.6% but was bumped up to 5.1% in the Sept 2023 projections ahead of being knocked back to 4.6% in these Dec 2023 projections. Those held flat for the March 2024 numbers.
Powell: tough job but rises to the occasion…
The market is in a tough stretch at this point as a critical juncture for the cycle is coming up against an inflation policy dilemma of multicycle, multi-decade significance. Powell and the current FOMC do not want to end up in the Burns/Miller Rogue’s gallery of the 1970s. Powell is also facing an election year dilemma since any support to the economy would send Trump into an apoplectic spasm of conspiracy-laced venom (i.e., a day ending in “y”).
Politics will show up no matter what action the Fed takes. In Q&A, Powell fielded questions on the demand from a couple of Senators (Warren, Whitehouse) to lower rates. He brushed it off. As a reminder, Trump wanted negative rates (like Germany at that time) back in 2019 and 2020 and wanted to fire Powell. At the time, it was pointed out that such a backdrop could be inflationary or later could generate destructive unintended consequences. Trump’s response was reportedly paraphrased as “that is the next guy’s problem.” Powell stood up to Trump on negative rates as well as an independent Fed.
Looking back to the 2018-2019 cyclical and monetary transition, Powell and team did it their way. After an abysmal year for asset performance in 2018 (see Histories: Asset Returns from 2016 to 2023 1-21-24), Powell eased 3 times in 2019 to prop up a fading economy on the basis of poor corporate investment.
The facts of 2019 are that the Fed was seeing trouble ahead and came in with three 25 bps cuts. Fed funds were cut in July 2019 to 2.0-2.25%. Then came the mid-Sept cut down to 1.75-2.0% and October was down to 1.5-1.75%. Powell’s action supported the economy and a market risk rally from a very weak 2018. Then the cycle came crashing down with COVID by March 2020.
It was one year ago this month when the regional bank crisis reared its head (see SVB: Hail Powell the Merciful 3-13-23). That was very well managed for the market even if regional banks still lurk as an asset quality pocket of anxiety (NYCB, etc.). Banking system risks still lurk and will be a watchlist item for regulators.
Overall, Powell has done a masterful job. He rose to the occasion across COVID as part of his tag team with Mnuchin at UST. Those two managed to reassure credit markets and get the refi and extension wave rolling. Their actions saw the market door open wide for companies to lock in low coupons and extend liabilities and set the stage for homeowners to refi mortgages lower and bolster household discretionary cash flow. Those two do not get enough credit for the actions of 4 years ago this month as the world was melting down. As a frame of reference, the credit market’s low tick on 3-23-20 saw the HY index hit a 78 dollar price on 3-23-20 and was back to par by August 2020 even before the vaccine.
For now, the ability of the FOMC to thread the needle has been impressive.
See also:
Footnotes & Flashbacks: State of Yields 3-16-24
Industrial Production: Capacity Utilization Shows Manufacturing Edging Higher 3-15-24
Retail Sales: Consumers Will Stop Shopping…Someday 3-14-24
CPI Feb 2024: Extra Innings 3-12-24
Employment: Real Numbers vs. Fictitious Dystopian Hellscape 3-9-24