
Payroll March 2024: Payroll Spike Brings a Political Theme Shift
We look at a banner March payroll count, drill into the occupational level, and consider the latest theme shifts on immigration.


The horror! The horror! Another record total payroll number in the carnage!
Another very strong month of payroll adds blows away the consensus and starts to inspire some reevaluations of sustainable payroll growth targets for 2024 that will keep growth going without triggering inflation pressure.
Various studies on the role of immigration in the macro models are making the rounds in 2024 and setting up yet another new inflation debate that could start to blur with election year political themes.
With 4.1% YoY hourly numbers in the mix for March payrolls, the story on FOMC cuts is not getting easier ahead of CPI and PPI this week, after a string of solid numbers of late, with the first round of 1Q24 GDP estimates later this month.
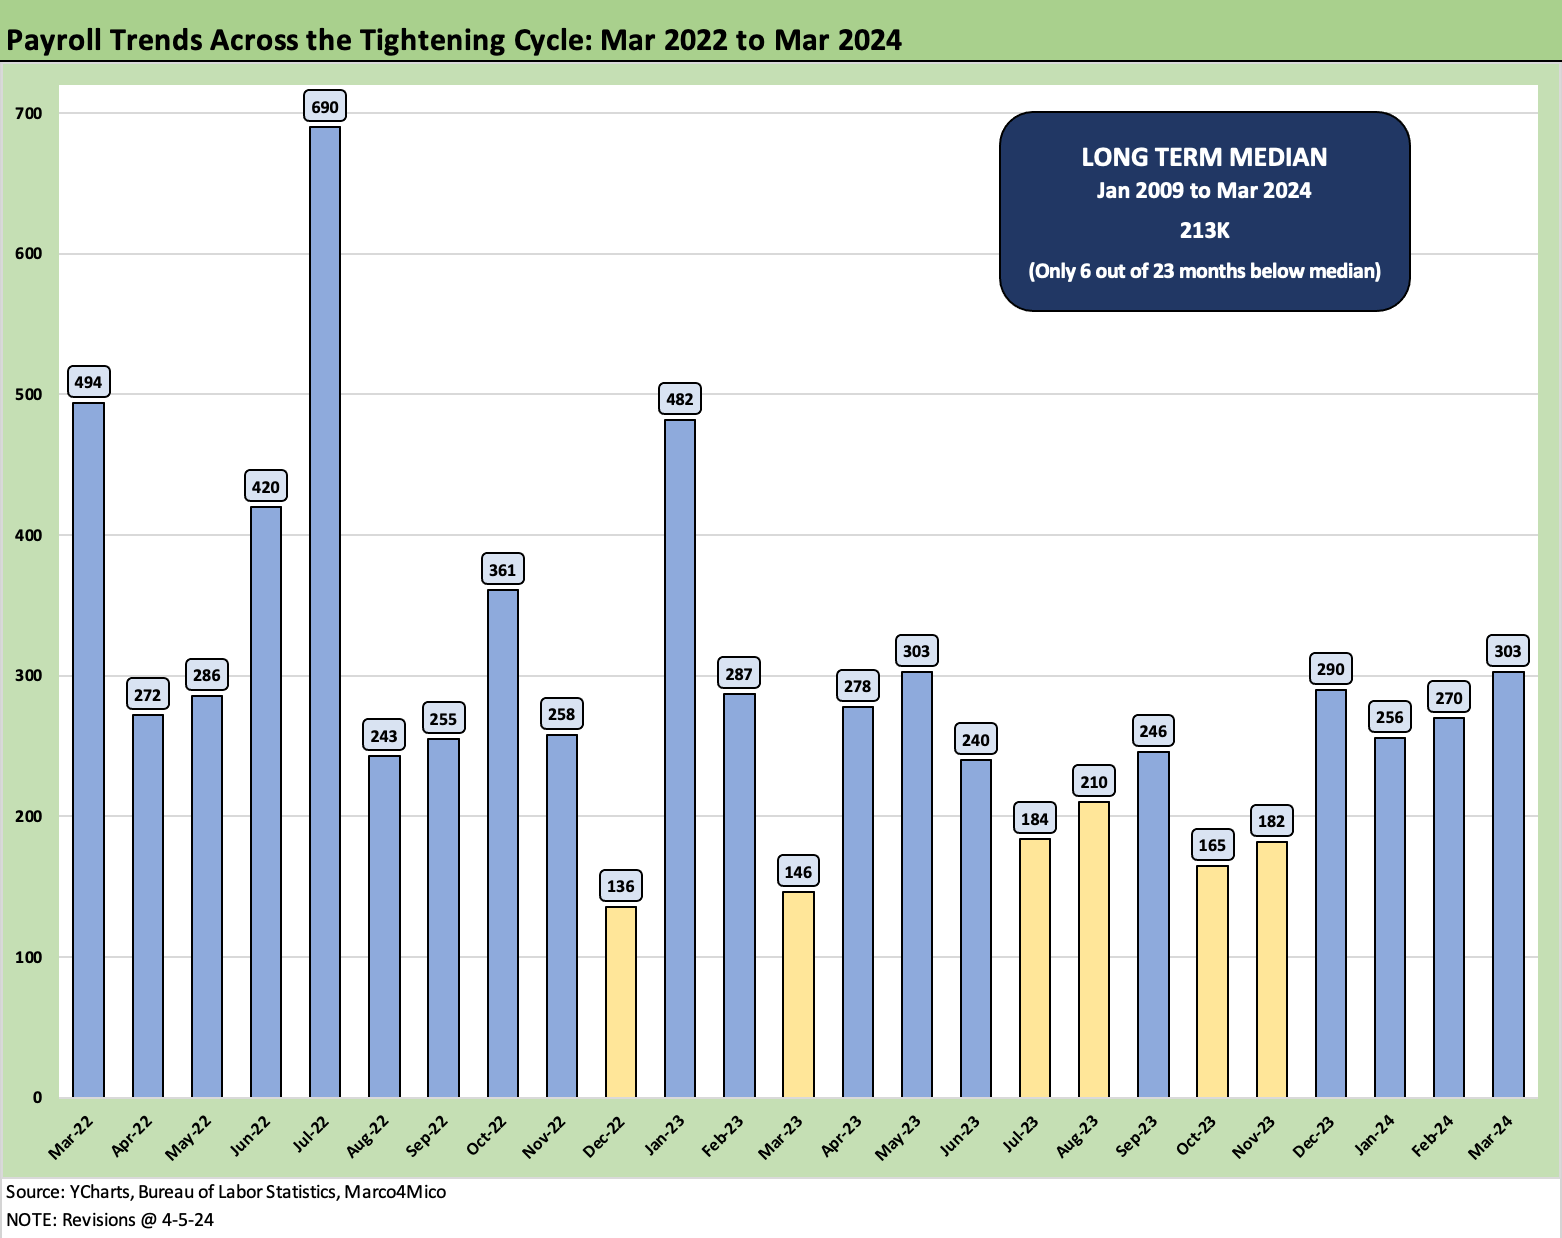
I was at a presentation and out of town on Friday 4/5, so we pushed off our employment review until today for some drilling into the numbers. The 303K headline number immediately rang the “Wow” bell and sent the UST curve modestly wider. The stock market rallied anyway on the day.
We will recap the UST curve action in our weekly Footnotes publication to be posted later this weekend. The main takeaway from the employment data is that the growth in PCE and payrolls are not signaling a slowdown. That in turn shifts the FOMC debate yet again (3 cuts, 2 cuts, no cuts?). The CPI and PPI are dead ahead this week.
We are now seeing more focus being directed toward finding the right mix of ingredients to explain how inflation goes lower with jobs heading higher. Immigration and changing demographics have caught on with the debate circuit the last few weeks. Melding the always-toxic immigration variable with the employment picture is not going to help make the political debate easier on employment as a positive for Biden (cheating on inflation, etc.).
The Friday UST reaction to payroll was less than what was already seen when Monday trading opened after the holiday to react to Friday’s PCE release (see PCE Prices, Personal Income & Outlays: Sideways Tone 3-29-24 ). The UST sold off on the upbeat economic data and inflation release from the prior week.
The payroll numbers from Friday were easy enough to drop right into the ingredients of a developing swing towards the “maybe not 3 cuts” school. The CPI and PPI release this coming week could even give more weight to the “maybe not 2 cuts” view that has been making the headline rounds of late. In other words, fresh legs for new debates.
Immigration as the swing factor?
Some recent studies have been locking in on immigration as the wildcard explaining how the sustainable employment growth rate (i.e., how many job adds without triggering inflation) is moving higher. The nature of US demographic trends and the influx of immigrants across varied categories of immigration from “legal immigration” and “lawful permanent residents” to “INA nonimmigrants” to “Other nonimmigrants” (i.e., illegal) get broken out in the analysis. The models seem to point at the economy having been able to accommodate as many as 230K per month of job additions in 2023 with a modestly lower number than that in 2024 (200K).
We are not digging into that here today, but a useful read is the Hamilton Project study just posted by Brookings in March (2024). That study taps into the Demographic Outlook report by the CBO released in Jan 2024. The idea that the aging population is an issue for productivity and quality of work force will get all swept up in AI impact discussions anyway, but there is no shortage of assumption-driven factors to keep looking into during 2024.
Those debates will rage on, but the +4.1% hourly wage inflation (+5.4% for durable goods) does not give a lot of confidence that the wage inflation number is poised to come down fast enough in coming months from a rising supply of illegal immigration that the report cites. That topic could also turbocharge the immigration and border battles and distract from a very strong employment story.
Team Trump is already using some of the data to say Biden is throwing open the border to keep inflation in check and hurt the American worker. The same old politics show up in all these issues, but more jobs and more paychecks with inflation materially lower than peaks offers some data points that support steady growth and PCE. Where inflation heads with sticky wages in services and higher oil is among the many inputs.

The above chart uses a two-sided chart to plot the monthly payroll addition time series vs. the unemployment rate. We start the time series at Jan 2009. We break out the COVID period separately in the box embedded in the chart to mitigate distortions of the visual scale. The 3.8% is derived from the slight uptick in the civilian labor force to 167.89 million and very slight decline in the unemployed ranks to 6.43 million.

The above chart updates the U-3 vs. U-6 rate. The comparison is helpful in considering the trend line in structural underemployment or lower quality employment. As a reminder, the U-6 metric is defined as “total unemployed + persons marginally attached to the labor force + total employed part time for economic reasons.” The denominator is “civilian labor force + workers marginally attached to the labor force.”
For March 2024, the U-6 rate was flat at 7.3% while the U-3 (standard unemployment rate) ticked down to 3.8% from 3.9%. The U-6 has been deteriorating from 6.7% in March 2023 to the current 7.3% while the U-3 has also risen YoY from 3.5%. This mitigates some of the headline risk on the headline job adds number for cyclical sentiment and how the Fed might process these numbers.

For another angle, the above chart plots the “U-6 minus U-3” differential. The current 3.5% is up from the 3.0% lows of Dec 2022 but still below the long-term median from 1994 of 4.1%. The 7% area on this differential from the 2009 recession period across the slow post-crisis employment recovery (7.4% in Sept 2011) underscores the brutal toll of the credit crisis on employment and the protracted lag time to the recovery of hiring after the bank system shock.

The above chart starts in Jan 2009 and offers a reminder of how total payroll stacks up against the unemployment rate. The 158.1 million on payroll is a record while the 3.8% is above the multidecade lows of 3.4% seen in 2023.
The unemployment rate vs. total payroll and where the civilian labor force (as defined) fits into the math is an old-time discussion. I tend to favor “how many paychecks” as an easy guide of how well the economy is doing and how much can keep flowing into the social security coffers as well as spending in the economy and growing the PCE line.
That does not support a recession theme as of now. Russia-Ukraine, Israel-Gaza with an Iran escalation kicker, and trade tension percolating for 2025 offers plenty of ammo for gloomy scenarios. That is always the case with China and Iran, but Ukraine-Russia seems to get little weight after 2022.
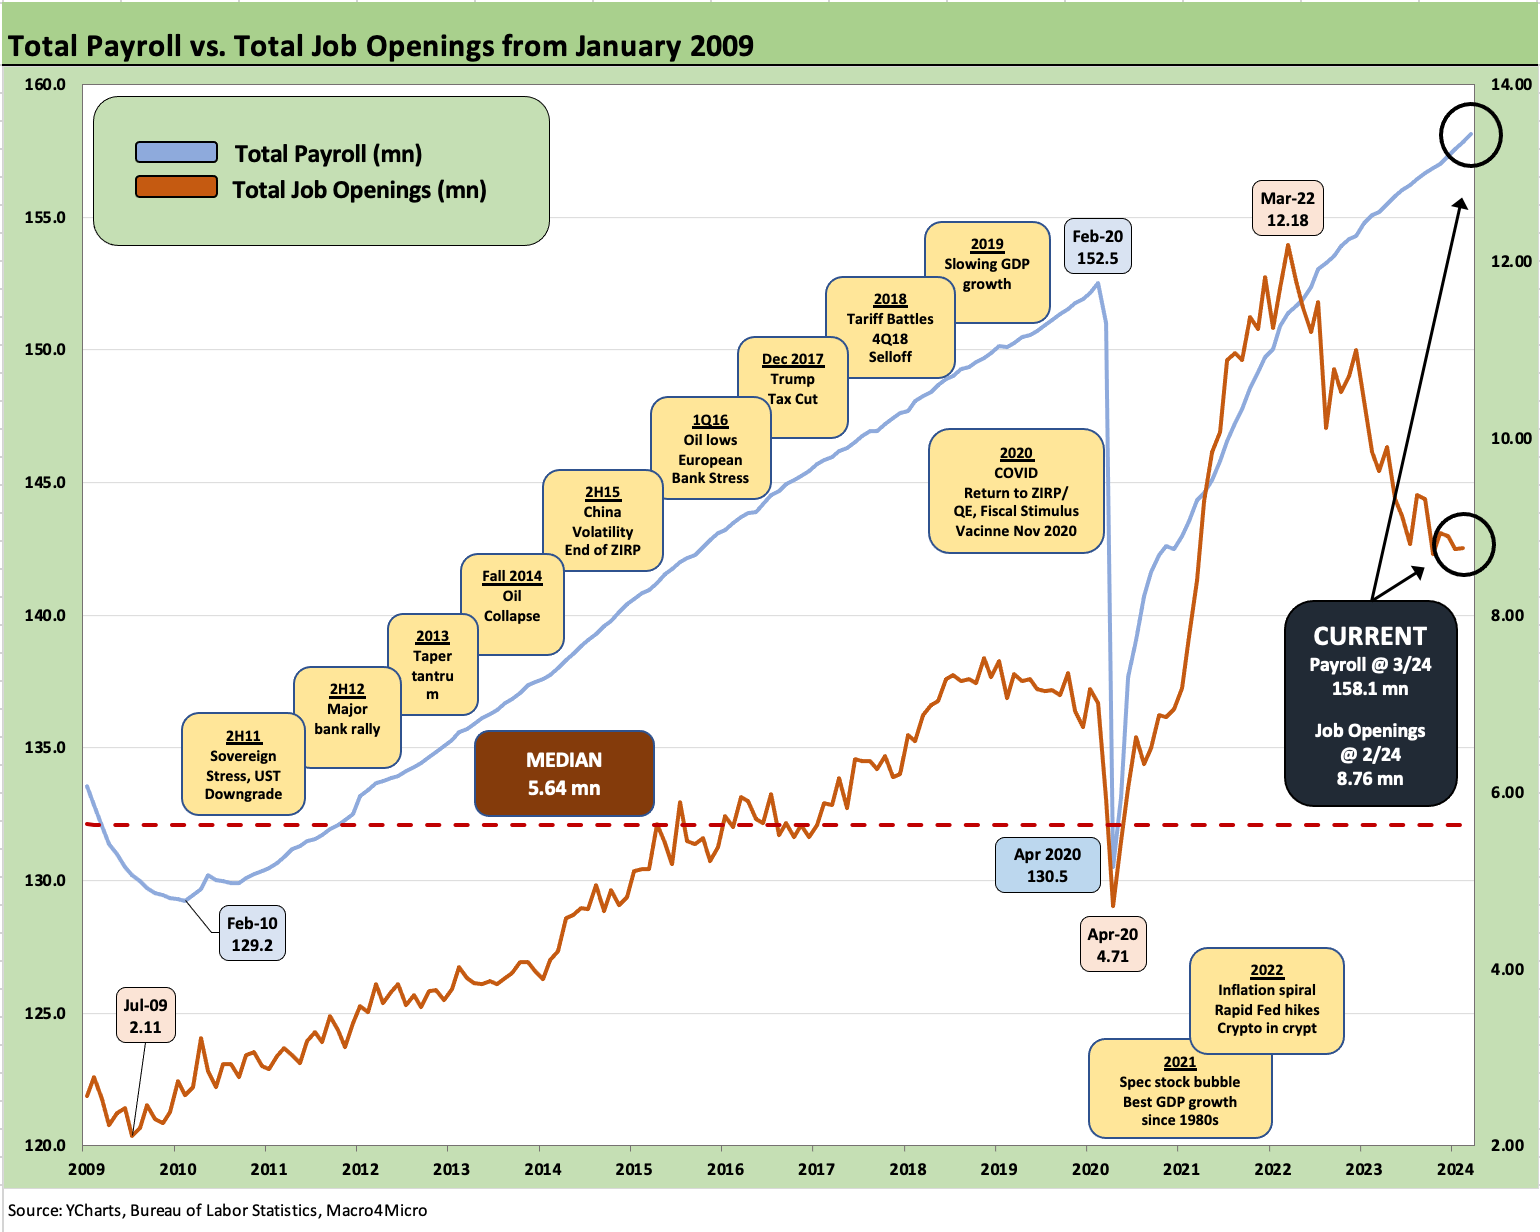
The above chart frames total payroll and job openings. We already looked at openings in the JOLTS commentary (see JOLTS Feb 2024: Steady and Sideways 4-2-24), and the news was biased favorably for jobs. The fact that job openings of almost 8.8 million remains 3.3 million above the long term median (5.5 million for 2007-2024) and more than 1.2 million above the pre-COVID peak (7.5 million Nov 2018) shows a favorable mix of inputs in an economy where we have been seeing consistently high payroll adds each month.

The above chart update CPI vs. the unemployment rate over the decades back to the early 1970s. The current headline CPI in Feb 2024 of 3.2% matches up with the long-term median. We get a new CPI number this week, and the worry is that Services will stay sticky, the gasoline line keeps creeping higher, and Shelter keeps dragging (see CPI Feb 2024: Extra Innings 3-12-24). A notable highlight above is that the current 3.8% unemployment rate is well below the long-term median of 5.8%.
Drilling into the Occupations
The next series of charts details the occupational trends in payroll mix. We look at the change vs. COVID and the previous month and then get deeper into the weeds on some important occupation classifications.
As noted earlier in this commentary and past pieces, structural underemployment and a high rate of part-time workers has remained the main item to push back on getting too excited over the employment numbers. The reality remains that we are looking at a record payroll tally.
On the political spin front, the new game may be to turn record payroll into an immigration debate and distract from the fact that more people are working, spending fuels more growth, and more payroll brings more funds for a wide range of governmental budgetary needs whether payroll taxes, income taxes, social security, local sales taxes, etc. In an election year, some will seek to take good news on the economy and give it a negative twist unless it is “your guy” in the White House or Governor’s residence. That is the nature of the beast.

The above chart updates the running deltas since just before COVID (Jan20) through today. The deltas for each major bucket show the payroll mix over the 4+ years since the immediate pre-COVID month of January 2020.
As a reminder, the US had its first isolated case of COVID in late January. We could have started the count at the beginning of March, but later February was when the major COVID panic had hit Italy and was on the way in force to the US. That was when the “sells” started rolling into the market in late Feb 2020 and the market cracked in March 2020.
The latest release shows the post-Jan 2020 payroll delta crossing the 6 million job adds mark after a strong 1Q24. The top 3 occupational categories above include Health Care and Social Assistance, Professional and Technical Services, and Transportation & Warehousing. These accounted for over 3.5 million or over half of the post-COVID job gains. As covered in earlier notes, the construction boom has continued to impress and sits firmly at #4.
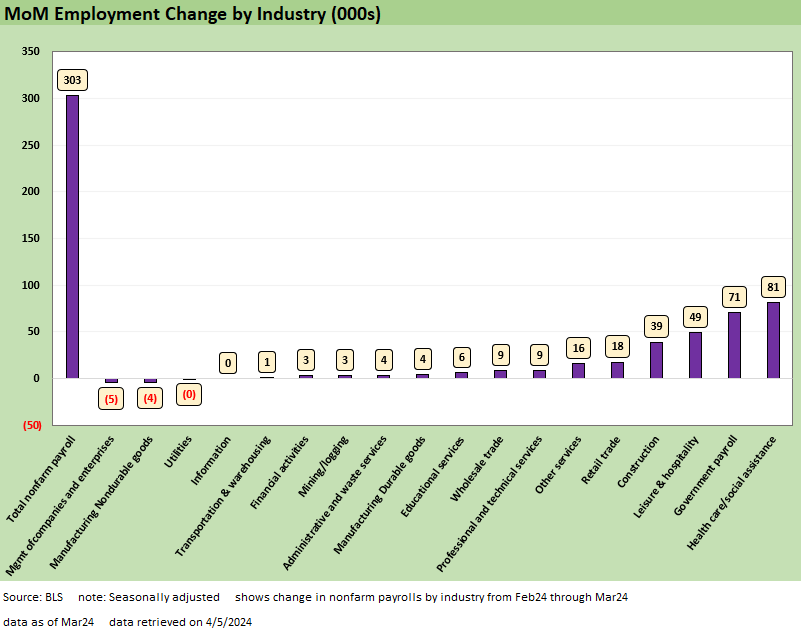
The above chart breaks out the sequential monthly changes for Mar 2024 vs. Feb 2024. Leisure and Hospitality sits at third after coming in second the previous month and continues a long-tailed, post-COVID bumpy ride back to positive. Many restaurants and bars shut down during COVID and never came back.
We also see another very strong Construction print at 39K job adds in addition to revisions in Jan and Feb data that showed another net gain of 17K construction jobs.
As we break out in a separate table further below, Construction cuts across a range of line items, but the highest number of the mix for the MoM payroll adds was “Nonresidential Specialty Trade Contractors,” which also shows the largest payroll count in the mix (2.8 million) followed closely by “Residential Specialty Trade Contractors” at 2.4 million.
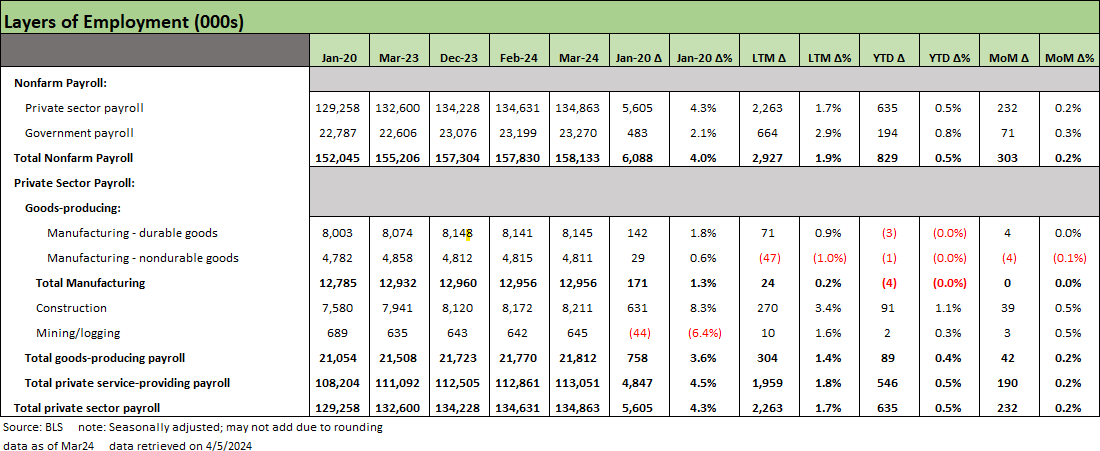
The chart above shows the bird’s eye view of the total nonfarm payroll across the major buckets we look at. The private sector increases of 2.3 million LTM and 635K YTD continues to provide the Fed room to maneuver around the timing of rate cuts. After all, inflation has been coming down with that pace of additions. Services still have provided the lion’s share of those payroll increases as the manufacturing revival still has not found legs.
Whether manufacturing will find those legs without more tariffs will remain a debate into 2025. The dilemma there is that trade aggression and the inevitable retaliation would get us back to the situation seen in 2018-2019, when capex grew defensive, investment slowed down, and the Fed stepped in to ease in 2H19. The trade X-factors will loom for hiring into 2025. As a reminder, 2018 was an ugly year for asset returns (see Histories: Asset Returns from 2016 to 2023 1-21-24) as tariff clashes undermined some of the investment benefits of the 2017 tax cuts.

The manufacturing line items remain anemic with no net gains this month and a slight decline this year. Minimal additions to Durables were offset by the decline in Nondurables. The LTM +71K rise in Durables shows a clear story around the disparity between Transportation Equipment and Fabricated metal products and a mix of flat and declining numbers in the other Durables lines.

Nondurables still only show small pockets of “strength” amid many red deltas across the period since Jan 2020. The secular decline and offshoring trends continue with another slightly negative month on the books. Since January 2020, the trends for Food Manufacturing and Chemicals remain positive at +77K for and +46K, respectively, but show minimal additions LTM and YTD.
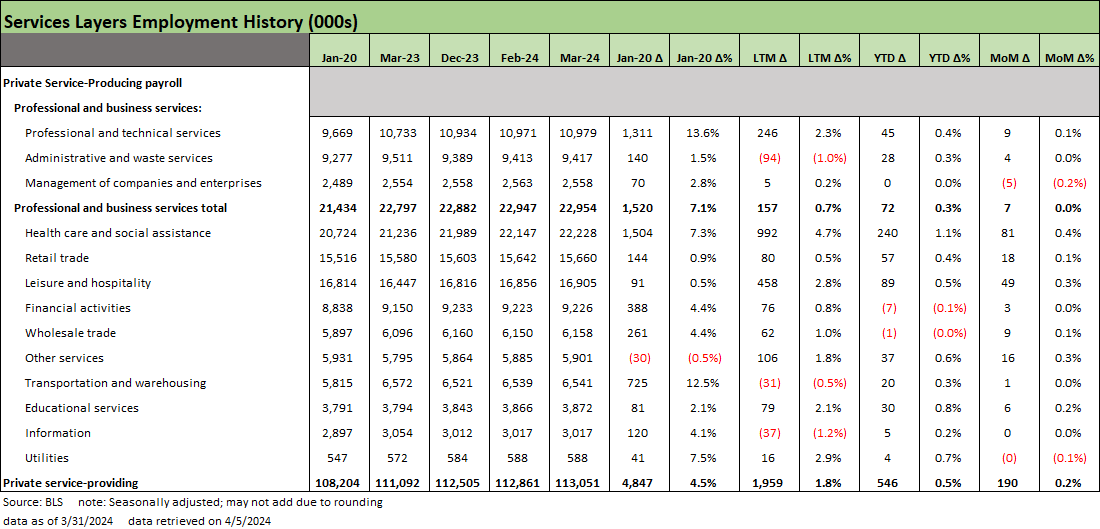
A strong payroll print would not happen without broad-based Services gains given that Private Services is 84% of total private sector payrolls and 71% of total payrolls. The above chart provides details on the 4.85 million adds since Jan 2020, 1.96 million LTM adds, +546K YTD, and +190K MoM.
The recurring critique on the payroll mix is that it lacks the multiplier effects on the economy seen with the Manufacturing lines within the Goods bucket. The theme remains that offshoring has destroyed higher paying skilled manufacturing jobs while bringing a race to the bottom in wages and benefits. That will remain a hot topic for both sides in the upcoming election season.
The counterpunch from labor in the Manufacturing sector on wages is that unionized industries are making major progress. That has been very much in evidence across 2023 in collective bargaining, but that is part politics and part supply-demand analysis until the reshoring becomes more a reality than a theme or talking point.
A threat to trade flows could come in the form of more tension with Mexico, where a great deal of manufacturing and supply chain dependence has been a reality on the “manual labor arb” with a lot of two-way traffic at the border. Mexico in theory goes into the “friendshoring” bucket, but many in government and labor might challenge that label. The leadership clashes between the US and Mexico are likely to get worse no matter who is elected. That is a topic for another day.
While it is a separate topic unto itself, private sector unions are also a minimal factor in the overall payroll count. For 2023, unions only represented 6.0% of private sector workers vs. 32.5% in the public sector for a unionization rate of 10.0% overall. For Manufacturing, the rate was 7.9%.

Construction line items above detail the overall expansion of labor demand in the sector. The +91K YTD adds is an acceleration vs. the +270K LTM numbers. Construction comprised over 10% of nonfarm payroll adds for the YTD period.
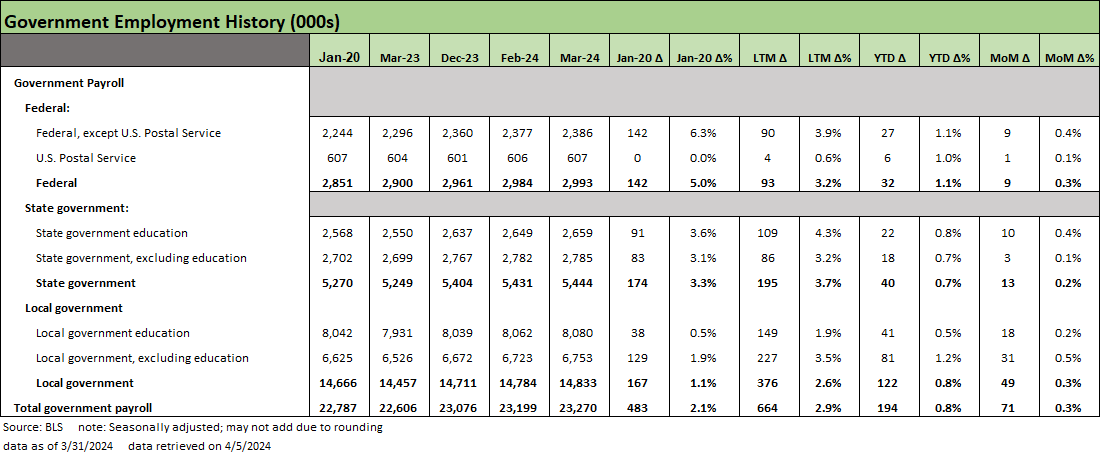
The Government hiring spree continues with +71K MoM and brings the LTM total to +664K vs. 483K since Jan 2020. The LTM adds have picked up from Local government when compared against the post-COVID hiring trends, though still lagging on a percentage basis vs. the smaller numbers in State hiring.
Lately we have been focusing more on State and Local hiring in the context of how the political talking heads (yapping mouths?) who decry an abysmal national economy (as they pitch it) while seeing periods of record low unemployment in their home states (see Employment: Real Numbers vs. Fictitious Dystopian Hellscapes 3-9-24). The payroll adds are impressive. We assume there is a tax base to back that up and especially where balanced budgets are required. (Most states require balanced budgets.)
One question to pose is how they reconcile all their self-congratulatory descriptions of booming home state economies with their doom and gloom national color. Another question could be the following: If the national economy is so bad, how can the state and local operations (mostly local) afford to hire so many new employees? Is it to man the soup lines?
See also:
PCE Prices, Personal Income & Outlays: Sideways Tone 3-29-24
4Q23: Final Cut, Moving Parts 3-28-23
FOMC: Hail Powell the Consistent 3-20-24
Retail Sales: Consumers Will Stop Shopping…Someday 3-14-24
CPI Feb 2024: Extra Innings 3-12-24
Employment: Real Numbers vs. Fictitious Dystopian Hellscapes 3-9-24
Payroll Feb 2024: Record, Revisions, Reality 3-8-24
Inflation Timelines: Cyclical Histories, Key CPI Buckets 11-20-23