
JOLTS Feb 2024: Steady and Sideways
JOLTS is a one-month lag with the main payroll event on Friday for March, but JOLTS is not signaling cyclical trouble for jobs yet.


After solid 4Q23 GDP adjustments across numerous line items posted last week and a hefty increment of personal consumption expenditure growth over personal income, the economic setback scenario for jobs is still light on ammo even if we see some increases in Layoffs and Discharges in the Feb 2024 JOLTS data.
On a SAAR basis, Job Openings were essentially flat but technically slightly higher while total Hires also rose sequentially in Feb 2024.
The private sector posted a small downtick in openings sequentially after a higher volume of hires on the month while state and local openings rose after a small decline in hires.
Total Separations rose in total and for the private sector with Quits rising and Layoffs/Discharges also rising.

The JOLTS data is always a useful exercise even with the 1-month lag as we await the total payroll changes and occupational deltas this Friday. The above Job Openings data is in substance a sideways move around 8.8 million even if there was a very small uptick from 8.75 million to 8.76. That number is still comfortably ahead of the 6.5 million unemployed to start March (see Payroll Feb 2024: Record, Revisions, Reality 3-8-24).
Everyone has their favorite or almost-favorite economic indicators. My own favorite is jobs. Perhaps it is my own background from a “former” industrial town and high school and college years of brutal inflation and high unemployment. A job is critical even if underpaid and not getting enough hours for those in hourly vs. salaried jobs. Buying a car on credit or being able even to get to the cash register to bitch about inflation helps when you have a job.
Inflation is a dagger for sentiment, but joblessness + inflation is worse. The 3% handle in CPI (2% handles for PCE inflation) alongside high rates of employment ease some of the worst of forward anxiety even if the “menu” in the aisles should be viewed as permanently repriced higher. Without a job, there is a defined limit on how much you can put in the cart (or basket) or more decisions to make as tradeoffs. Getting a mortgage usually requires a job unless you are very well set.
With that backdrop, we thus always call out the political spin of ignoring jobs as a critical X factor in the economic picture when so many states are seeing record low unemployment across 2023. Despite that core economic strength, many talking heads in politics are citing the Book of Revelations on the health of the national economy while sending out self-congratulatory press releases on how great things are in their home states (see Employment: Real Numbers vs. Fictitious Dystopian Hellscapes 3-9-24). They assume people are that dumb. Many people do not disappoint them.
More jobs are better than less jobs when household reality matters…
There is no question there is a structural underemployment problem and a high mix of part time employment (the vast majority “by choice”), but the states scream bloody murder when anyone moves to raise the national minimum wage since it “hurts” local businesses. With such a diverse range of local economic cost structures across the US, that hourly wage question is a Rubik’s Cube where the colors keep changing.
After careful consideration (nanosecond), we still believe more jobs is better than less jobs. We await the other side of that debate. There is no other good side. There is also the reality that enough states with enough strong economies (many very strong) and record low unemployment now or over the past year tend to add up to a good national economy. 50 states added up is not exotic math, but one set of books is not very common in politics.

The above chart plots the time series of total Hires as a multiple of Layoffs/Discharges. We are still comfortably ahead of the long-term median. Excluding COVID, the low print over this timeline is 1.5x during the post-crisis cyclical low stretch in April 2009 (March 2009 was the stock market low, June 2009 was the economic trough).

The above chart plots the timeline for Total Hires vs. Total Layoffs/Discharges. We omit the peak COVID numbers to avoid distorting the visuals too dramatically. We discuss the COVID period numbers as a memory jogger in a box further below in this commentary.
The most recent Layoffs/Discharges number of 1.72 million in total (SAAR) is up sequentially from 1.6 million (1,596) in Jan 2024 so there is some action in the Private sector at +113K of that increase. Increases in Leisure and Hospitality, Construction, Retail stand out on the list. Professional Business Services and Transportation/Warehousing saw Layoffs/Discharges move notably lower.
The big wildcard in Separations is “Quits” at 3.5 million (SAAR) rather than Discharges/Layoffs given the high rate of two-way traffic in lower paying services jobs.

The above chart plots Hires vs. Total Separations once again with COVID distortions removed. Hires exceeding Separations is always a good thing. Both are above median in a growing population but well down from the cyclical highs before the tightening cycle kicked into gear in Spring 2022.
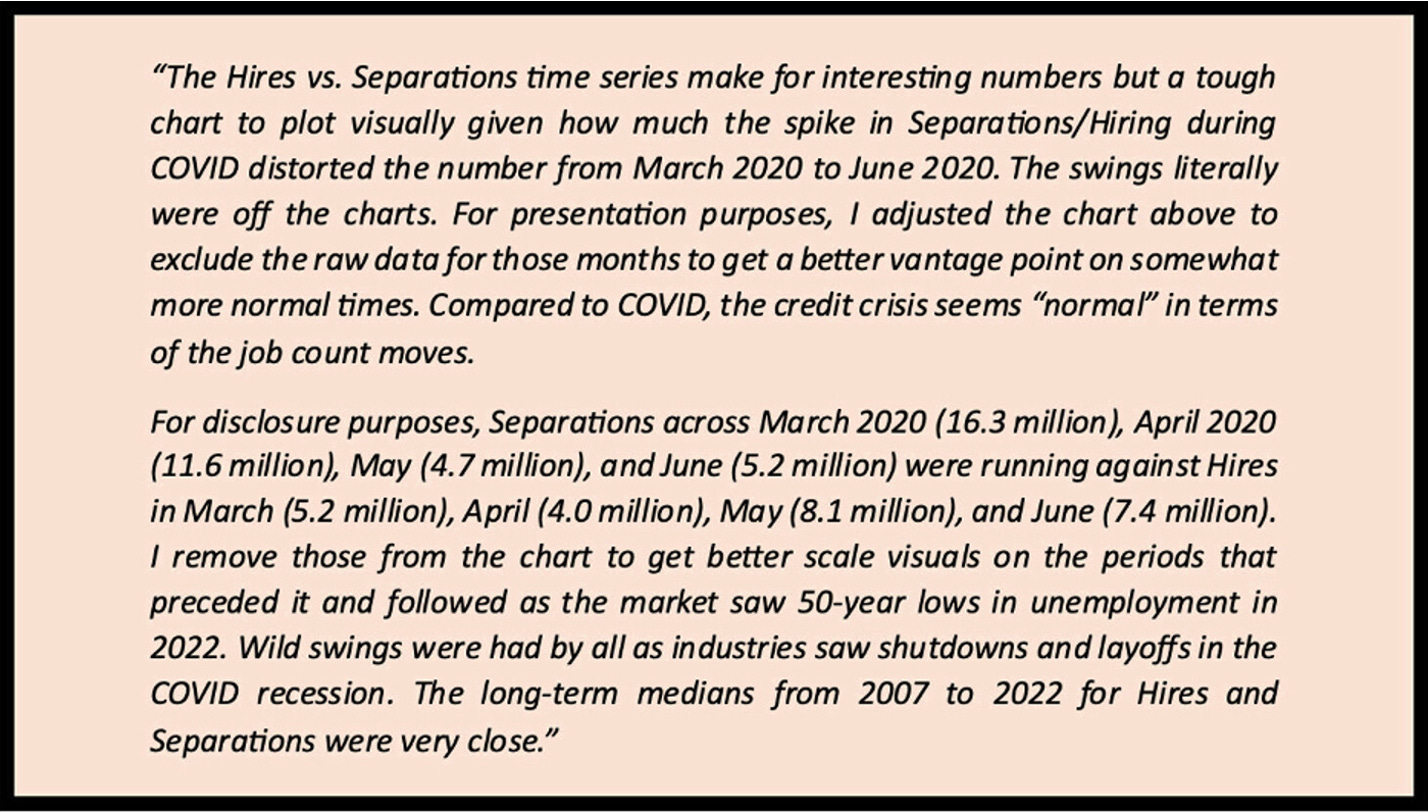
The above chart is a recurring cut-and-paste that serves as a memory jogger of the first pandemic in over a century. The Separations number of over 16 million in March 2020 and over 11 million in April 2020 defy adjectives.
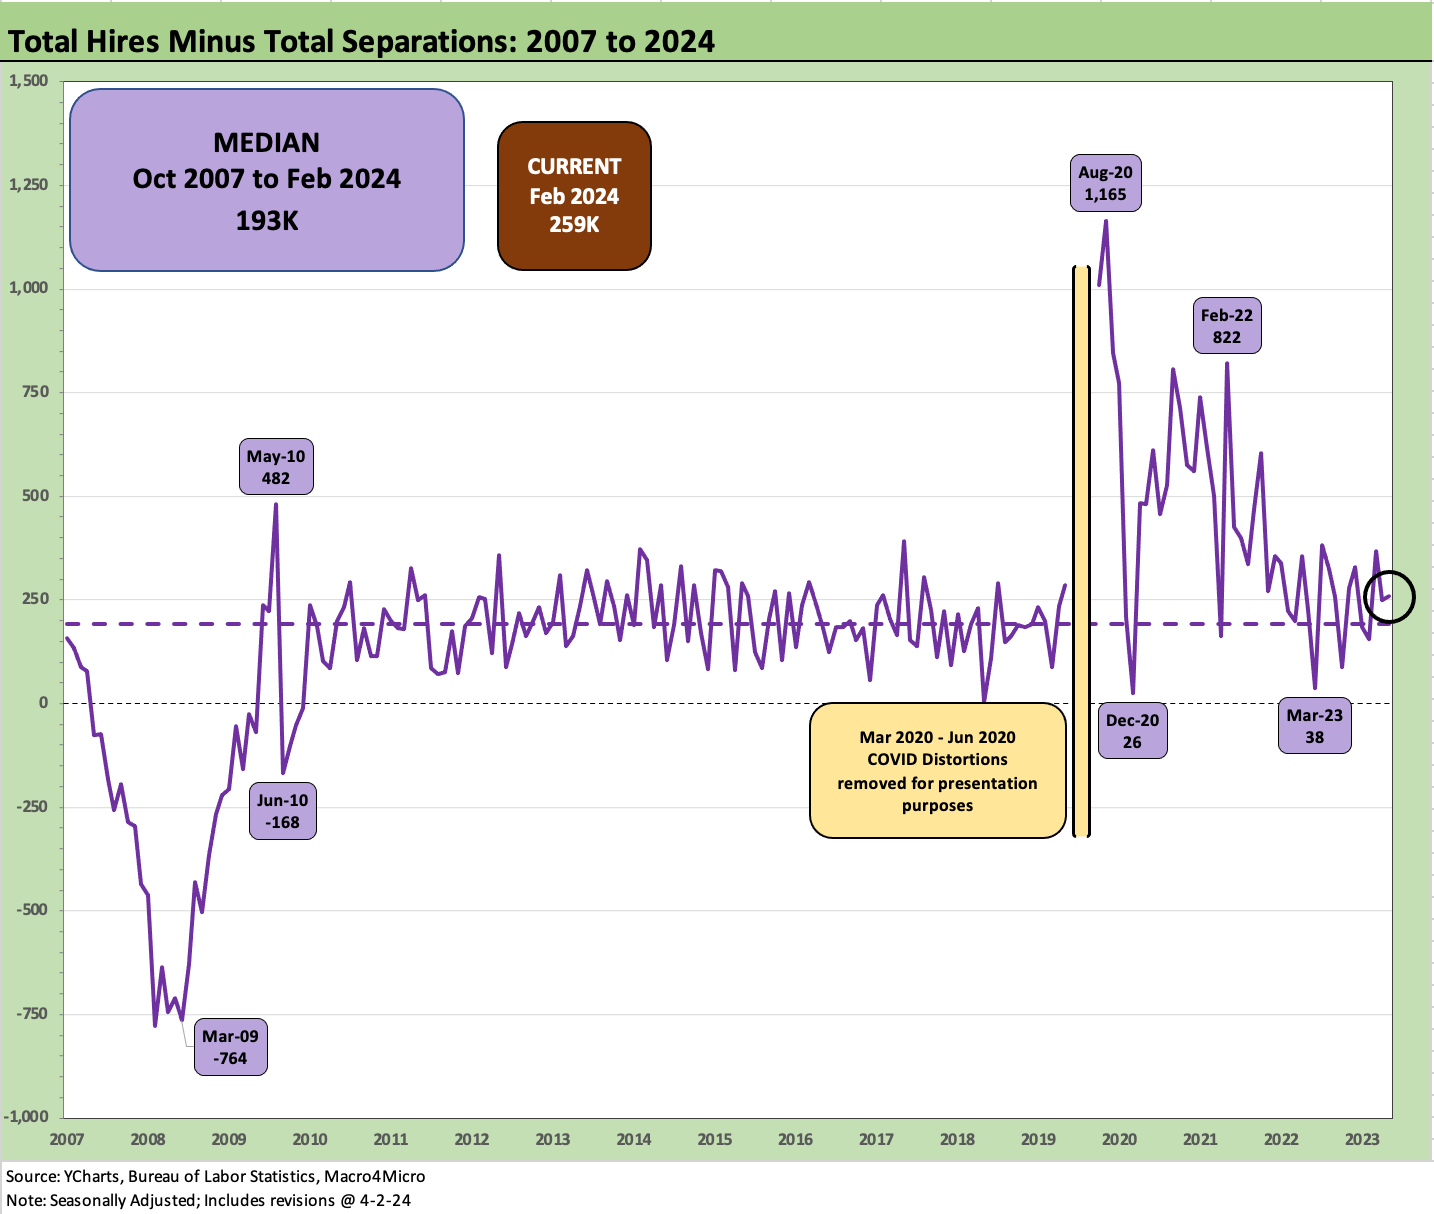
The above chart updates the time series for “Hires minus Total Separations.” The positive number of +259K is still above the long-term median of +193K.

The above chart plots the mix of Quits withing the Total Separations. It helps give context to the moving parts and employee traffic. At 62.7%, the quits mix is higher than the long-term median of 57.3%. The “Quits Rate” (Quits as a % of Total Employment) was flat at 2.2% on a SAAR basis.
Overall, the JOLTS data this month is not making it easier to get bearish on the cycle and last week’s data is not helping the economy bears or UST bulls as the UST backtrack this week signals.
Relatively Good ISM Manufacturing numbers this week rose above the 50 line this week after 16 months below the line in contraction mode. The 50.3 in March compares to the 47.5 average over the LTM period. We will see what the spring selling season holds for jobs across what is often a peak time for autos, housing, and booking travel.
See also:
Footnotes & Flashbacks: State of Yields 3-31-24
Footnotes & Flashbacks: Asset Returns 3-31-24
PCE Prices, Personal Income & Outlays: Sideways Tone 3-29-24
4Q23: Final Cut, Moving Parts 3-28-23
Pension Profiles: Benefit Drain Rates and Returns 3-22-24
FOMC: Hail Powell the Consistent 3-20-24
Retail Sales: Consumers Will Stop Shopping…Someday 3-14-24
CPI Feb 2024: Extra Innings 3-12-24
Employment: Real Numbers vs. Fictitious Dystopian Hellscapes 3-9-24
Agree more jobs is better than less and with ISM finally over 50 maybe more of the jobs will be full time cause part time vs current actual not adjusted inflation life is likely pretty darn hard.