D.R. Horton: Credit Profile
We provide a comprehensive credit profile of the #1 homebuilder in the US and frame its inherent cyclical resilience and liquidity strength.
The company is well prepared for any short-term weakness in volume and margins in a core homebuilding business that has a very strong intermediate term demand outlook despite near term affordability setbacks.
The capital structure is more nuanced than a total debt number given the stand-alone, profitable business lines outside of homebuilding which have their own distinct capital structures and that are not guaranteed by D.R. Horton or their homebuilding subsidiaries.
In a show of strong cash flow fundamentals and liquidity strength, D.R. Horton continues to reduce homebuilding debt and has been paying down bonds with cash rather than refinancing at current rates.
Among the more interesting expansion programs at DHI is the single family rental operation that plays to a core strength at the same time the rental business offsets some of the headwinds from affordability challenges to homebuyers.
Credit Outlook
A key strength of D.R. Horton (ticker DHI) lies in the rock-solid balance sheet of its homebuilding operation and its demonstrated financial resilience across homebuilding cycles. The overall financial strength, business risk profile, and operating success helped DHI graduate into the investment grade index. Since then, the company’s overall risk profile has steadily improved across the most important risk factors. DHI plans to pay down $700 million in homebuilding bonds due in 2023 with cash ($300 mn done, $400 mn to go).
In terms of credit quality, DHI posts a high BBB composite rating with its bonds trading inside the credit spreads of the IG index and the index’s A3 composite rating. DHI posts the risk profile of a single A issuer relative to where the company is rated. Even in a housing cycle downturn, the liquidation of inventory in the normal working capital cycle and variable cost structure of DHI will generate very strong cash flow to meet the combined priorities of a strong balance sheet and shareholder rewards.
The financial risk of DHI’s homebuilding debt is even lower than the overall consolidated entity given how DHI has configured its guarantor and recourse exposure across its business units. We see financial debt distributed across its land/lot development subsidiary Forestar, its financial services business, and its growing single family and multifamily rental operation. As broken out herein, those entities have their own debt and are not guaranteed by DR Horton. All of those operations are also distinctly profitable in their own right.
The debt obligor mix, guarantor mix, and nonrecourse structural nuances across the family tree of companies underscores DHI’s priority of protecting the credit risk profile of the core homebuilding segment that generates over 90% of revenues.
Operating strengths and market position….
DHI ranks as the #1 US homebuilder ahead of Lennar at #2 with Pulte a distant #3. DHI boasts a broad national footprint and strong position in leading single family markets such as Texas, in the Southeast, and in the Southwest. DHI has been especially well situated in the states where secular trends in population growth are most favorable.
The company has regularly flagged that it is #1 in 15 of the Top 50 markets and #1 in 4 of the Top 5 markets. DHI boasts significant market share leadership in metros such as Dallas, Houston, Atlanta, Phoenix, and Austin over the last decade. DHI product offerings run the full range of product tiers from entry level to luxury, but its regional breadth and strategy still leaves it at the low end of average selling prices as a builder.
Following D.R. Horton is a useful exercise for any owner of any housing-related security since the company’s strategic actions serves as a bellwether indicator for the direction of the industry. The expanded investment in single family rental operations and majority control of a lot development company (Forestar) reveals the company’s ambition to be ahead of the curve whether in strong markets or in periods of cyclical weakness. We look at those other operating units in more detail below.
D.R. Horton in Industry context…
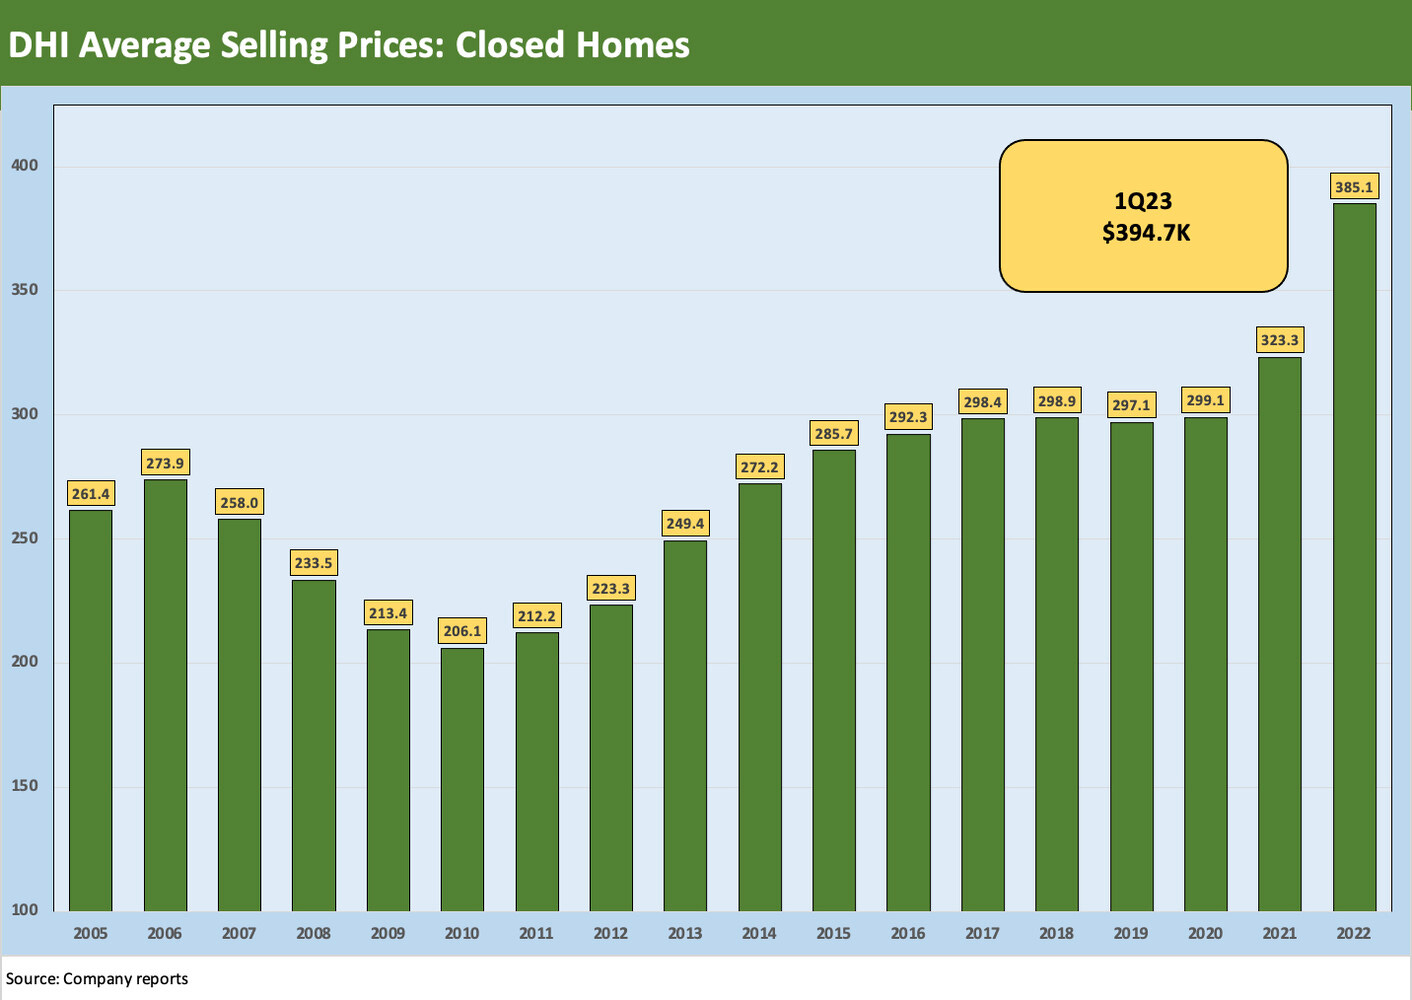
In the next two charts, we frame the history of DHI’s average selling price (“ASPs”) for closed homes. The chart starts back in 2005 during the bubble and runs through FY 2022. We post the 1Q23 ASP in the box inside the chart.
Brand strategy and ASPs…
The history of D.R. Horton has been built around its major presence in the largest and most diverse single family housing markets across the sunbelt. DHI operations are characterized by a material presence in middle and lower price segments, but it competes in all price tiers. The brand strategy has evolved since the housing bubble and has been designed to cater to a wide range of customer segments. The brand strategy targets Entry Level (“Express Homes”), First Time/Move Up (“D.R. Horton”), Active Adult (“Freedom Homes”), and Luxury (“Emerald Homes”).
During 1Q23, the home price mix ranged from 20% of units below $300K to 13% of units above $500k. We still see DHI with 44% of the mix below $350K and 35% of the mix above $400K. In the middle of the price tiers, the DHI mix shows 21% in the $351 to $400K bucket. As a frame of reference, the most recent new home sales median for the industry in Feb 2023 was approximately $438K. That means that 2/3 of DHI’s home closings in 1Q23 (Dec 2022 quarter) were below the industry median. That mix has helped drive DHI’s market share of total industry new single family home closings to more than double since the housing bubble years with its market share around 12%.
The competitive position of DHI in lower-price tiers, and the demonstrated ability to post consistently solid margins in those tiers will matter in a market where affordability is strained by higher monthly payments after the mortgage rate spike in 2022.
As we discuss below, the financial services operation and single family rental business broadens the ability of DHI to respond to current market conditions. DHI can be creative in its use of incentives for homebuyers but also offers rental alternatives in some key markets. The rental business started with a multifamily focus, but the single-family rental operations have grown dramatically over the past three years. We look at the mortgage operations and rental segment further below.
As we look at the largest builders that join DHI and Lennar (LEN) in the upper ranks, we see Toll and Pulte at materially higher ASPs with LEN and NVR in the mid to high $400K handle range. The largest housing markets and those with the highest growth rates offer a wide range of price tier opportunities, but DHI is best positioned competitively in serving the below median markets and operating in those markets for years with established subcontractor and developer relationships. That is evident in the consistent national market share gains.
In the industry context detailed above, only LGI Homes (ticker LGIH) had lower ASPs than DHI, but it should be noted that LGIH has been an emerging growth company built around a low-price strategy. DHI also started with a heavy focus on the Texas market. Back in 2013, LGIH posted closings that were 84% in Texas and is now down under half of its closings in TX. LGIH has quickly grown the business of bulk sales to single family rental operations. Wholesale units as a share of LGIH closings doubled to just under 30% in 4Q22, so the lower price range is seeing pockets of opportunity from high rental demand.
DHI now is also growing in that rental space by building its own units and selling them off opportunistically. The drop-off in mortgage-qualified buyers in the lower price tiers is a risk, but the demand for rentals remains high and that is just one more opportunity for DHI. The mortgage “rate watch” more directly impacts potential buyers of lower price tiers at the margin.
The Forestar acquisition by DHI was an innovative approach to expanding more efficiently in markets where land/lots and developer relationships are sometimes strained. That was notably the case when inventory was lean and prices were rising sharply. We look at that unit in more detail further down in this report.
Financial profile reflects steady growth and consistent performance…
The chart below captures how quickly DHI has grown even without the major acquisitions seen at some other builders who are looking to grow their national scale or improve their range of product tiers across markets. DHI’s core area of operations and history in geographic growth markets has allowed a balanced strategy. The expansion programs such as rentals also have been anchored in such areas since that is where the housing demographics and relocation trends are more favorable.
The shift to less capex intensity via the heavy use of lot options was part of the Forestar deal economics. Reducing exposure to land development has been an industry trend since the credit crisis. The goal of lowering risks associated with land investment is more common across the industry. The rental operations also mirror a top-down trend in capital pools and dedicated operators in the single family rental space. The approach by DHI to exploit the opportunities in single family rental is more innovative as a builder.
The scale of the company and recent growth history is evident above. Revenue and earnings more than doubled since 2018. As we cover elsewhere in this report, the “Notes Payable” line includes a range of bonds and loans not guaranteed by D.R. Horton or its main homebuilding subsidiaries. The Homebuilding bonds are just under half of that total debt line.
Operating Segments and Reporting Segments
D.R. Horton is a massive national scale homebuilding operation with almost 80 divisions operating across six major regions that are broken into reporting segments within Homebuilding. Forestar is a reporting segment from its position as a lot and land development operation. We round out the segments with Financial Services operations and Rental. Below we summarize some of the revenue and earnings metrics of these various business lines.
Forestar as a strategic acquisition to build lot development capabilities and reduce risk…
The acquisition by DHI of a 75% stake in Forestar (ticker FOR) back in Oct 2017 came with a price tag of $558 mn in cash. DHI had stepped in front of an LBO deal between FOR and Starwood Capital after FOR had agreed to a $605 million deal ($14.25 per share) in April 2017. The FOR deal was consistent with DHI’s plan to derisk the homebuilding operation by acquiring less land and shifting its lot control strategy to a higher mix of land/lot option contracts.
The deal offered a path for growth to FOR management with a public equity and much healthier financial profile, so both sides had upside in the relationship given the shift in business mix underway for DHI. FOR has continued to grow since the acquisition, and the DHI stake is now down to 63% at FY 2022. The deal would allow FOR to become a leading national player in land development while also offering DHI the means to invest less in land and focus on its core homebuilding operations.
While Forestar has core strengths in many of the traditional DHI growth markets, they continue to expand their geographic footprint to 53 markets in 21 states as of FY 2022. Another idea over time for the FOR asset could be that a more valuable operation could be created as a potential shareholder reward for a future spin-off when (or if) the time is ever right for such a move. FOR was in fact formed in a spin-off from Temple-Inland in 2007.
The idea of a spinoff appears to be a long way off given where the market is in the housing cycle. DHI equity has materially outperformed FOR over the past three years while FOR had modestly underperformed the S&P 500 and more notably underperformed the overall homebuilding ETF (XHB).
The economic logic of the FOR deal…
The economics of the FOR deal for DHI was that FOR allows DHI to generate a much higher rate of lot deliveries at minimal incremental capital costs to the homebuilding operation while also leveraging FOR personnel and expertise. FOR can tap into targets that DHI may see but which FOR can more efficiently manage in the context of any other constraints.
The substance of the combination is that the total lot development program is under the DHI consolidated umbrella but with FOR in a majority owned stand-alone entity with its own balance sheet and debt obligations. The high concentration of FOR lots in TX, FL, and AZ fit with DHI’s traditional regional strengths.
Within the industry, the material increase in the use of lot option purchase contracts has been a common and evolving practice since the housing crisis. Back during the crisis, the homebuilder NVR was a model for the industry in the use of options. The use of such contracts reduces risk tied to land investment. Most builders have been on board with that strategy since then. For DHI, 75% of lots for the homebuilding operation are tied to such lot purchase contracts. NVR came through the crisis with minimal damage on the land side while others faced massive impairments and had debt incurred to build up land/lot holdings.
DHI is active in the use of such options but has much larger needs than what FOR can handle even as it has grown. For some context on the scale of FOR lots vs. DHI’s controlled lots activity, the 36,700 lots controlled or owned by FOR are dwarfed by the 573,200 lots owned and controlled by DHI at the end of FY 2022. That is under 7%. DHI is that big.
Forestar revenue and earnings growth…
The above chart gives a simple timeline table on revenues and earnings at Forestar since the first full fiscal year of ownership under DHI. We see the 3.5 fold growth in the revenue line from FY 2019 to FY 2022 and the almost 5-fold increase in net income. The growth plan has been working. The arrival of a sharp retrenchment in starts and the need for builders to manage a large base of homes under construction put the brakes on rapid growth in lots/land development. We see this reflected in the YoY plunge in revenues and earnings at FOR.
That revenue and earnings growth also brought a doubling of the real estate line running alongside the YoY trend for 1Q23 (Dec quarter) vs. 1Q22 that shows the sharp drop-off in activity. The good news is the relationship of the real estate balance vs. the total debt line. That is very healthy asset coverage, but DHI and FOR need to sort out the pace of inventory liquidation and investment by region and by community.
Financial services as a standard business line for builders…
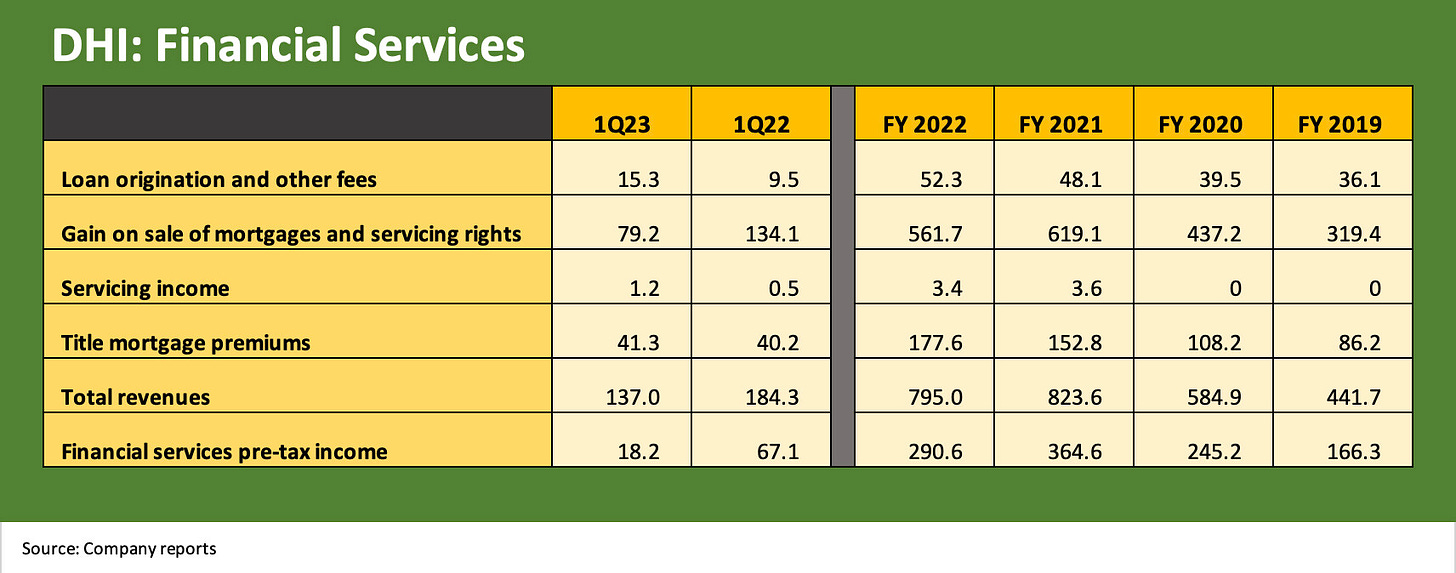
Mortgage finance is a typical part of the business planning for homebuilders. DHI as #1 homebuilder is no different. The activity is an extension of building and selling new homes. The mortgage originations are 98% to 99% linked to DHI built homes, and DHI provided services for 69% of their home closings in FY2022. The title services and insurance products are also a material fee generator that drops to the bottom line as detailed in the attached chart. The mortgage operation of DHI handled financing for 77% of 1Q23 DHI homebuyers.
Balance sheet risks are limited as the mortgages and servicing rights are sold. The mortgages are structured to conform with the requirement of government agency mortgage buyers (Freddie, Fannie, Ginnie). The $1.8 bn mortgage repurchase facility at 1Q23 was collateralized by mortgage loans and was not guaranteed by D.R. Horton. The ability to use mortgage operations as a useful selling tool is intuitive while title services bring additional fees to the revenue stream.
Rentals present an attractive growth market and logical fit for DHI…
The Rental business has been getting more attention in equity analysts’ Q&A since it is showing very solid growth. As recently as the 2020 10K, the Rental business showed up under the heading of “Other” in business line disclosure but then earned its own segment name. DHI Residential (single family) and DHI Communities (multifamily) have plenty of visuals on their websites to capture the product flavor and location details.
The expansion in single family is a natural extension for DHI and one where they would have a competitive advantage. They can sell to capital pools or run the operations as a stand-alone segment until valuations are favorable. They can be patient and tactical in monetizing with home prices under pressure, but their local market knowledge and production capacity is an intrinsic competitive advantage.
The “build-for-rent” space is an extension of the core business for some builders. DHI describes the single-family homes under construction as “purpose-built rental only communities.” The rental business has its own revolving credit facility that was increased to $1.025 billion at 12-31-22 (1Q23) with $800 mn outstanding. The revolver can be upsized to $1.25 bn. The revolver is not guaranteed by D.R. Horton or any of the subsidiaries that guarantee debt of the homebuilding operations.
Beyond the rapid revenue and earnings growth of these projects, the margins as disclosed in the financial statements were very impressive. DHI also now breaks out cost of sales information for multifamily and single family rentals and the 50% area gross margins tell a story. The rental properties are typically sold in bulk, but they also book rental income under “other income” in a small slice of the overall segment profitability. DHI can have a patient time horizon for selling these rental inventories.
The trends around single family rental trends have been a hot topic for some time. DHI has a natural edge. Who would have a better sense of local markets or where the supply-demand balance is ripe for expansion of single family supply than the #1 builder of lower priced homes? As noted in the financial results chart, the revenue and earnings growth justify continued expansion.
Some see the trends in capital pool demand for rental assets near term as uncertain in a housing market that is under pressure. We looked through the recent results and management discussions of leaders such as American Homes 4 Rent and Invitation Homes for more color. We heard and read positive views on the demand side and constructive guidance even if there are a few areas where supply is being felt more. The irony is that eroding affordability supports such projects in the rent vs. buy decision for those facing housing shortages that undermine new home sales. Rental will remain a viable option with renting new single family homes, especially so.
The pushback on single family rentals as business lines is that rents will also necessarily come under pressure in a weaker housing market. The wide range of players have very distinctive histories including those buying up distressed existing home properties after the credit crisis. Some are fragmented small investors, while some are large institutional capital pools.
DHI knows how to price new homes with their own production capacity. They know the renter and potential buyer profile in regions where they traditionally serve a very large base of first time and entry level buyers. The single family rental business captures a lot of tomorrow’s buyers served by their Express Home brands.
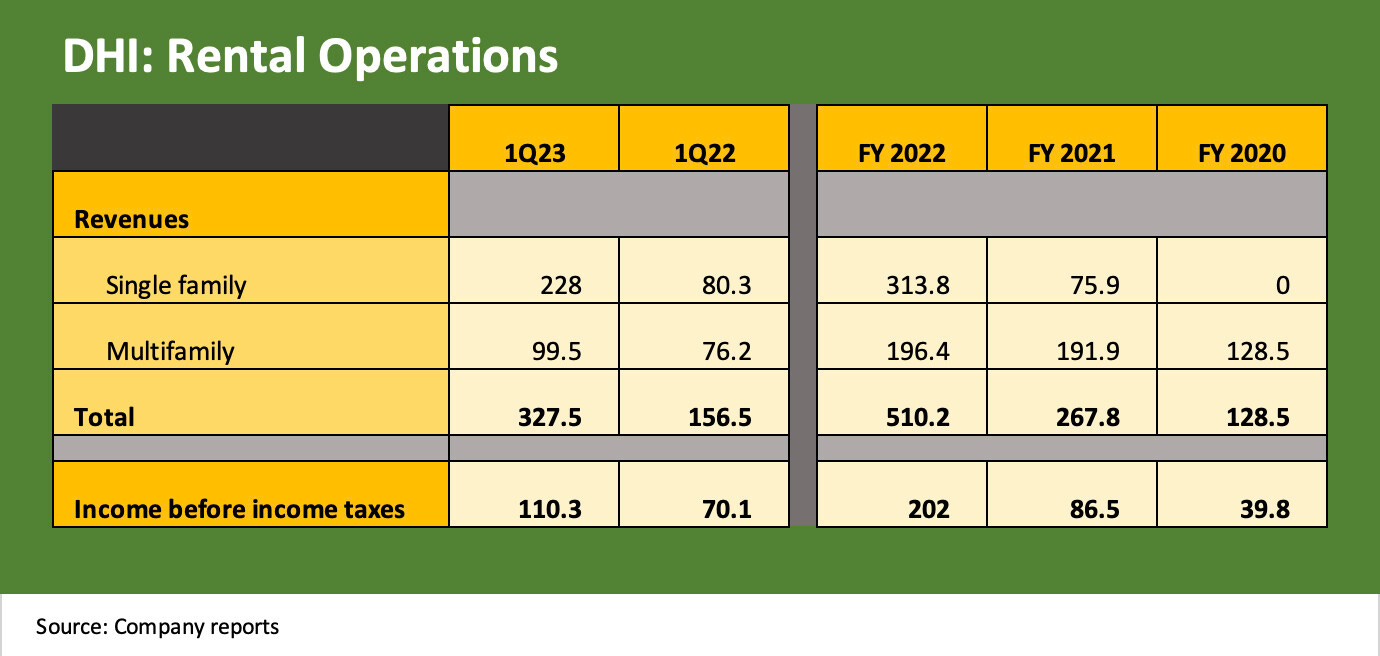
The single family rental business was a very logical fit for DHI’s core competencies and that single family revenues stream has grown from zero in 2020 to $313 mn in 2022, and now $228 million just in 1Q23 alone. The straining affordability for homebuyers in search of a single family home has seen a hefty base of capital chasing that space, but DHI can now focus on the expansion with a full view of the dynamics of the sector in a post-mortgage spike world. The sales pace of such projects can be lumpy, but the numbers don’t lie.
The Multifamily operation is now smaller than the single family operation in recent reporting periods and is around 1/3 of the rental inventory line. Multifamily was a more natural fit than some might have assumed since the focus is on garden style communities with 200 to 400 units and more concentrated in areas DHI knows well (e.g., Texas, Florida).
Major reporting segments and income statement disclosure…
The above chart breaks out the reporting segment income statements for FY 2022 for another angle on the mix. The most important aspect of this disclosure is that the four major business segments are all profitable, and clearly the fundamentals for all of these business lines are tied to the demand for housing whether homebuilding, lot development (including Forestar), mortgages/title services, or Rentals (single family, multifamily).
Credit quality and the equity valuation of DHI is set by the quality of execution in the homebuilding unit and how that overriding business segment leverages the other business lines to drive the homebuilding unit. That mix of company assets runs from lots to building and financing the sale of homes.
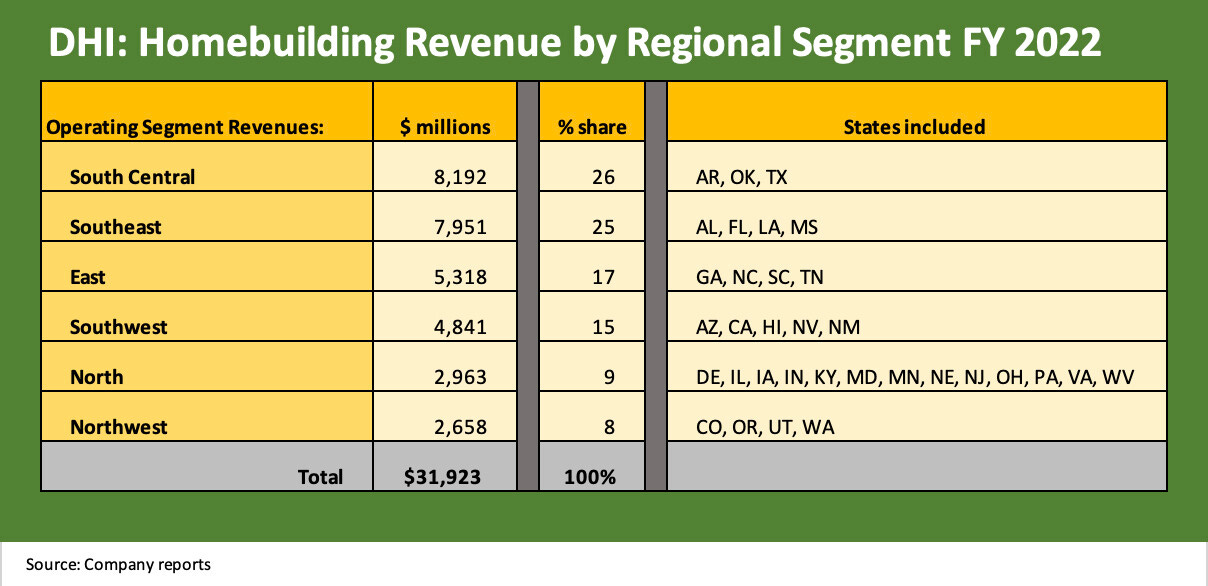
The snapshot for DHI’s most recent fiscal year shows the regional breakdown of its homebuilding reporting segments and the relative revenue share. South Central is driven by Texas, the Southeast by Florida, and the East features DHI’s leadership position in Atlanta. The Southwest segment includes a leadership role in such important markets as Phoenix.
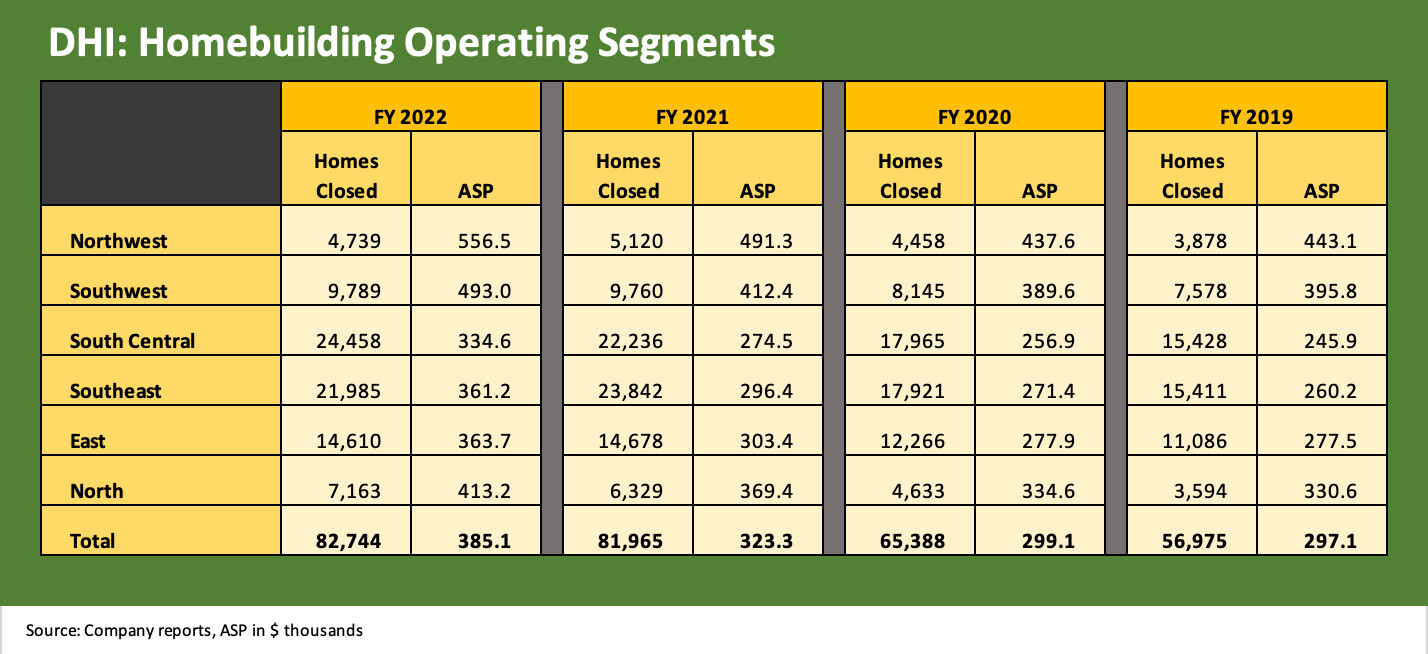
The above chart looks back across the years for the homebuilding reportable segments as amended in 2021, when the regional mix was changed to those regions detailed above. We provide the volume and ASP details from 2019 to 2022 as reported by DHI.
The above chart frames the volume and average selling prices while the chart further below looks at revenues and pretax margins in those regions. The regional ASP range is from $556K in the Northwest to $334K in the South Central. Among notable mix trends is $300K handles on ASPs in DHI’s three largest geographic segments, including the South Central market (dominated by Texas), the Southeast (includes Florida), and in the East (Georgia and the massive Atlanta market, the Carolinas, and Tennessee).
Financial Risk Profile
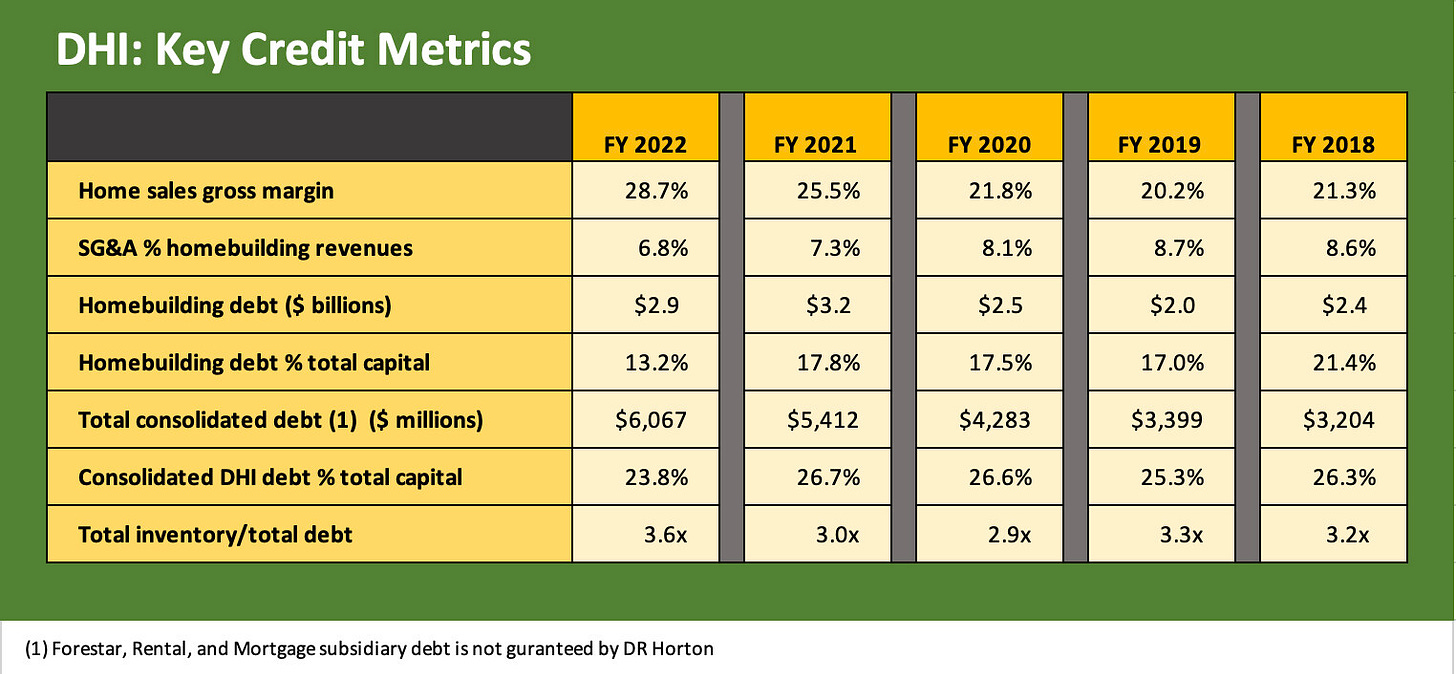
The DHI financial metrics broken out below frame the Homebuilding only portion vs. the consolidated numbers. For the homebuilding segment of DHI, we look at the gross margins, the SG&A expense ratio that flows into overall profit margins, the homebuilding total debt and the homebuilding debt to cap. We then look at the consolidated debt and leverage numbers.
An important distinction in looking at the balance sheet of DHI is that only the homebuilding debt is guaranteed by D.R. Horton and its significant domestic homebuilding subsidiaries. As we break out in a separate chart, there is no D.R. Horton guarantee on Forestar debt or the other non-homebuilding operations in Financial Services or Rentals. That fact further supports the risk profile of the Homebuilding bonds in the capital structure. It also highlights the other business lines as creditworthy on a stand-alone basis.
The gross margin consistency of D.R. Horton has been a feature of the company’s resilience across a wide range of macro backdrops, but the 2020-2022 timeline was exceptionally strong given market conditions and pricing power in a housing market that had seen supply-demand balances thrown out of alignment by COVID.
A low 20% area for margins should be considered quite solid for purposes of credit stability while still allowing DHI to meet shareholder needs. DHI has been one of the most generous of the major builders to shareholders in the form of combined dividends and buybacks while still paying down homebuilder debt.
M.D.C. Holdings is an anomaly on the dividend front with its high payout rate of a 5% are yield (4-3-23). Most builders do not pay dividends, but more investment grade builders have moved to a low payout with some exceptions. The ability of DR Horton to maintain healthy gross margins is a matter of history, and we need to go back over 10 years to 2011 to find a 16% handle low on gross homebuilding margins.
We have always liked using inventory coverage of debt for homebuilders or “cash + inventory.” The asset coverage of total debt from the inventory line makes a strong statement at the consolidated level at well over 3x (3.6x at FY 2022). As covered in other charts, that includes major inventory lines at Forestar and Rentals. If you wanted to get more legalistic about the bondholder related asset coverage, you could just use the inventory line of the Homebuilding unit vs. the homebuilding debt. That ratio is closer to 5.9x at fiscal year end. Book value leverage in the Homebuilding business was 12.8% at the end of 1Q23.
Profitability trends
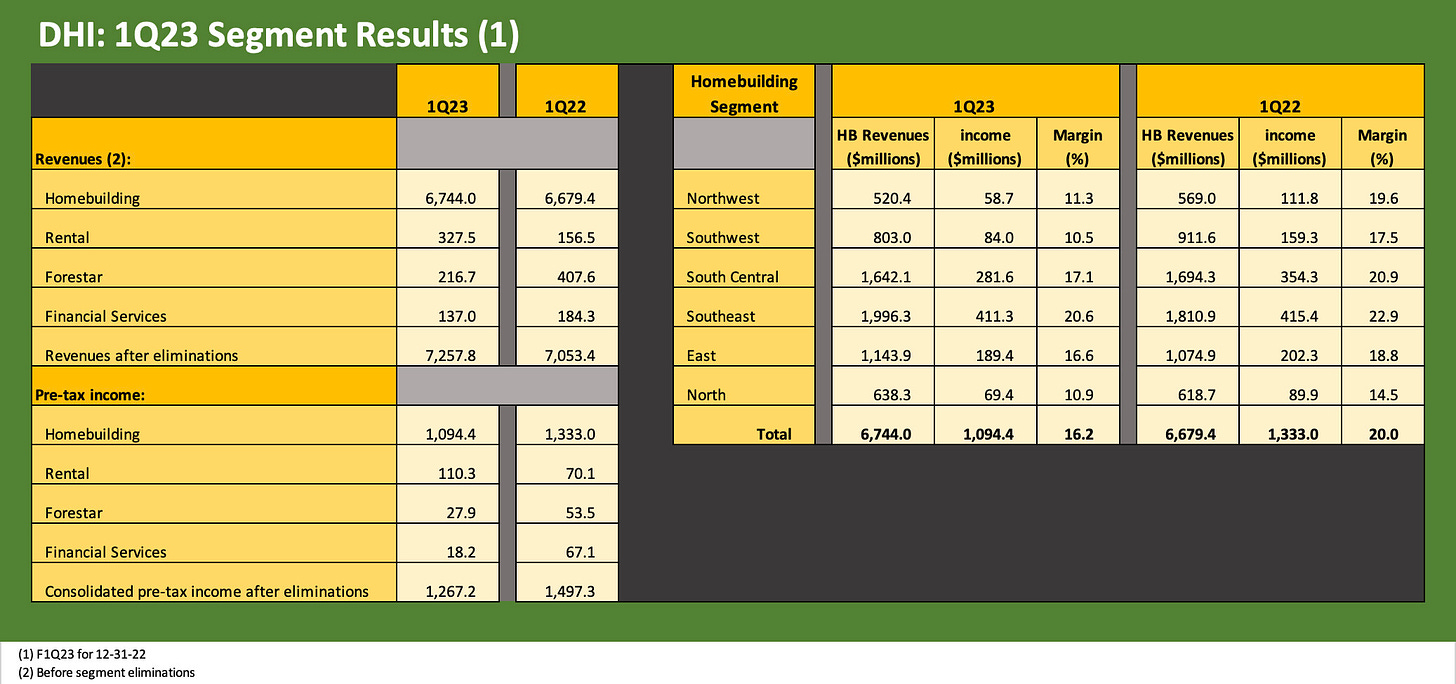
The chart below breaks out the revenue and pre-tax profit and profit margin trends for the geographic reporting segments of the DHI. The segments were changed again in 2021, so we only include the 2019 to 2022 segment disclosure. That time horizon includes the pre and post COVID periods.
The strong revenue growth and margin expansion across the tumultuous period from 2019 to 2022 is detailed above. To avoid any confusion, these are pre-tax operating margins and not gross margins. The 20% operating margins for all segments represents peak profitability measures across this housing cycle and were almost double those of 2019. We see five out of six homebuilding segments at or over 20% pre-tax margins vs. none in 2019-2020 and only one in 2021 (the Northwest). The weakest segment in profitability is seen in DHI’s “North” segment (the smallest segment), which includes markets across 13 states and ends up as a catch-all geographic segment.
Those 2022 profitability metrics were not sustainable on soaring home prices nationally. The sustained shortage of houses came in a high demand market that featured low mortgage rates on the turn into early 2022. The following periods in 2022 included many contracts signed under very different conditions.
The industry saw contracts that were signed “early and often” in 2022 with very low inventories of new and existing homes. COVID with supplier chain disruptions along with ZIRP and QE (including MBS holdings at the Fed) made for a very unusual backdrop.
The demand profile on tight supply flowed into record revenue and profitability for numerous major builders that had grown impressively over the past cycle. For DHI, the free cash flow allowed for balance sheet improvement and debt reduction as well as over $1.1 bn in stock buybacks and a healthy dividend payout of over $300 mn in dividends.
Interim results for F1Q23
The historical resilience of DHI is reassuring given the reality of what will be a bumpy 2023 as volumes slide and margins compress. After the 1Q23 earnings call, management did not give complete guidance for the full FY 2023 in their usual format. They did frame the low end of the range at a decline of mid-teens percentage and stated that they see 20% gross margins in 2Q23.
The quarterly breakdown as disclosed in the Homebuilding segment shows a mix of pre-tax margin weakness. The three largest geographic segments holding up better for DHI but all show margin compression. The margin weakness came in the face of a small uptick in revenues. We highlight that the two largest segments delivered almost 2/3 of homebuilding segment earnings with the Southeast posting +10% in revenues and a small dip in profits and still slightly above a 20% pretax margin line. The South Central segment saw declines in the Houston and Fort Worth markets. The Southwest segment posted the biggest YoY quarterly decline in homebuilding revenues with weakness in California (DHI includes CA in Southwest).
Cancellation rates remain high at 27% but were down sequentially from 32%. As a frame of reference, cancellation rates were 21% in 2022 and 17% in 2021. The 2022 market delivered +20% in home sales revenues, so the fallout from mortgages gets delivered at a lag. For 1Q23, DHI posted a 6% decline in numbers of home sold but home revenues still increased by 1%. Home sales gross margins of 23.9% in 1Q23 compared to 27.4% YoY. The margin compression is still underway (note: the above chart frames pre-tax margins).
Net sales orders (under contract but not yet closed) declined by 38% in a sign that the year will be one of downsizing inventory but managing inventory levels prudently by region. The high number of active communities at DHI is consistent with what we see in the broader new home construction data (the monthly “starts” release) with the high levels of homes under construction (see Housing: Starts, Permits, Construction, and Cyclical Moving Parts 3-16-23).
Sales order prices showed modest erosion in 1Q23 by only 4%, but the real dagger for the builders is volumes and not prices. The peak selling season starts in the 2Q23 period, and DHI has guided to materially higher volumes in 2Q23 vs. 1Q23. Move-in ready homes are ready to go.
Capital Structure
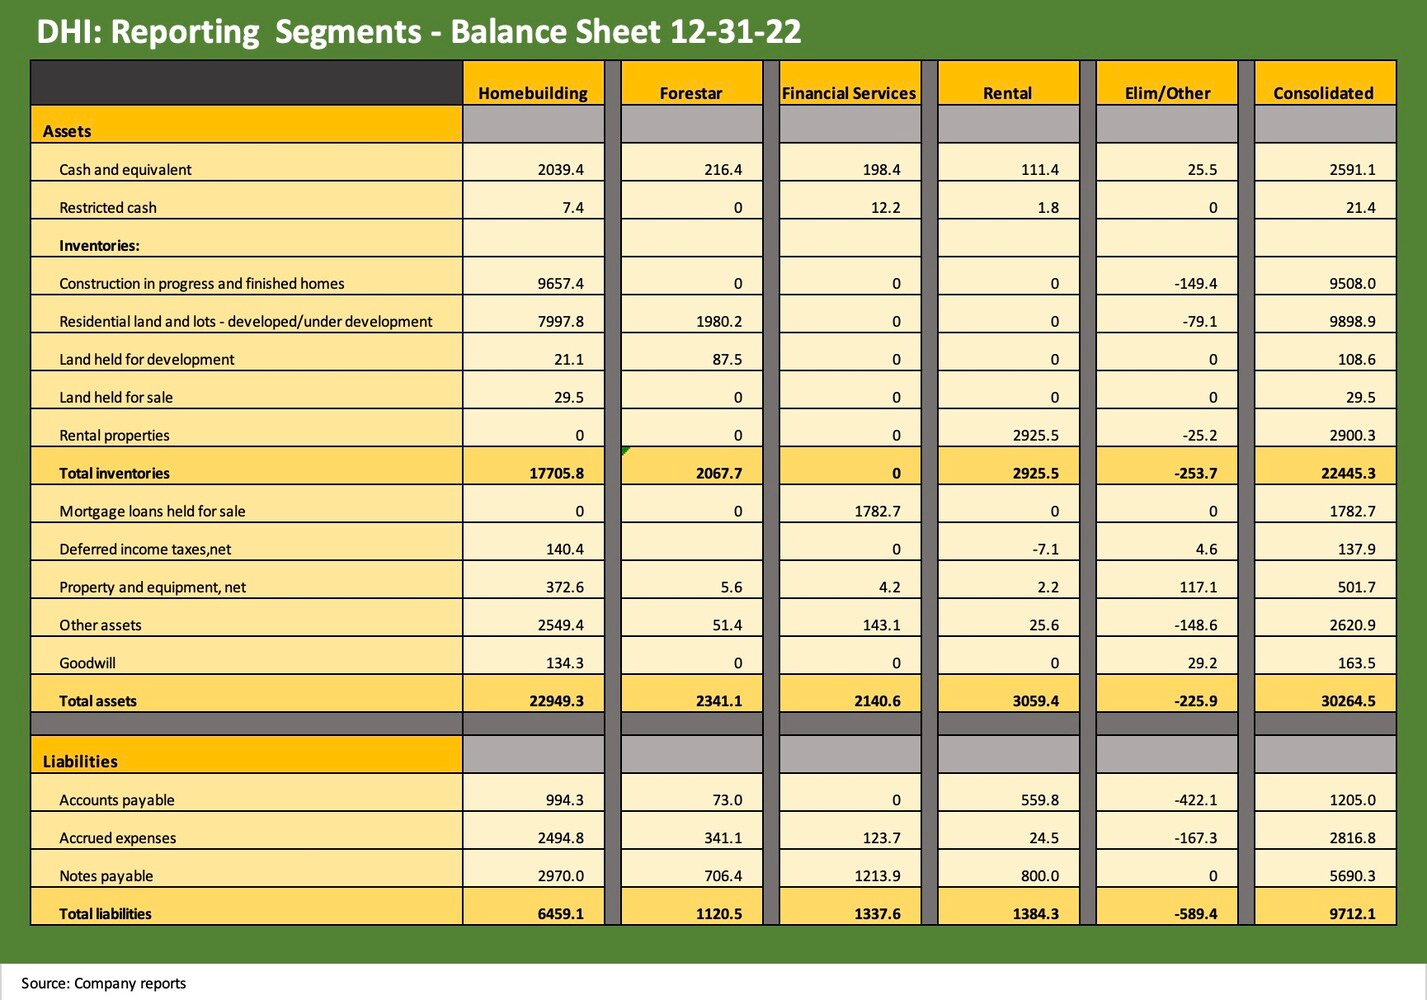
The above chart adds more granularity to the most recent balance sheet mix at 1Q23 (quarter ended 12-31-22). We show the line items across the asset base and liability structure of DHI for the four main reporting segments of the consolidated entity. The distinctions of the capital structure mostly revolve around the debt of a few major operating units that is not guaranteed by D.R. Horton. We see those debt lines broken out to the right of the Homebuilding column on the way to a consolidated number on the far right.
We like the format the company uses since it gives you very clear granular disclosure on the inventory lines and their components. We also see the debt lines by major business unit. Inventory is 74% of total assets. If we add cash, that is almost 83% of assets. If we throw in mortgage loans, then “cash + inventory + mortgages” totals 89% of total assets.
“Other assets” are heavily weighted toward “earnest money and refundable deposits” of $1.7 bn at 1Q23 that are generally tied to land/lot purchase contracts (note: earnest money is cash paid in connection with a contract, usually in the form of deposits). That is a liquid balance sheet.
As noted earlier, the rental business is a newer expansion plan that has soared the past few years. With the rent vs. buy decision very much a core part of the housing cycle equations, DHI clearly has decided to capture its slice of the value chain on the rental side as well.
Forestar is a separate and distinct bond issuer (low BB tier composite) with two bonds in the ICE index and trading moderately wide to the BB tier index with its BB2 tier composite ratings. Forestar is not guaranteed by DHI and is a stand-alone credit.
That mix of balance sheet line items includes a lot of cash generating working capital and liquid assets over the course of a year as inventories get liquidated in a slower market and mortgages turn over and get sold off. As BBB cyclical issuers go, the IG homebuilders present very strong cash generation whether in earnings or in working capital liquidation cycles.
Paying down homebuilding debt with cash in 2023…
DHI has already paid down the $300 million bond debt with cash during 2Q23 and has another $400 million bond maturing in the summer that it expects to pay down with cash. They specifically indicated that they did not have an interest in refinancing those bonds at current interest rates but would have the flexibility to add back some debt later as essentially refi transactions of the bonds paid down. Outstanding DHI homebuilding bonds declined by $350 mn in FY 2022 and will now decline again by $700 mn in FY 2023 subject to lower rates or opportunistic use of the proceeds.
Spec building and inventory cycles…
The balance sheet is dominated by inventory on the asset side, and that inventory cuts across the homebuilding unit, Forestar, and the Rental operations. Inventory liquidation drives cash flow in soft markets and can use more cash in bullish markets. The uncertainties of 2023 in terms of demand – notably given the sensitivity to moves in mortgage rates – will make inventory tracking more critical than usual for those watching free cash flow numbers at DHI or any builder in the markets.
The supplier chain is in better shape now, but the erratic moves in the curve will be a challenge for the rate of turnover if rates head back north of 7%. There are more than a few scenarios that also take mortgages back to 5% handles. As we framed in a recent weekly, mortgage rates today look a lot like 2005 and 2006 at the peak of the housing bubble. A big difference is that the UST yield curve today is materially lower than in 2005 and 2006 and notably the 10Y UST that drives 30Y mortgages (see Footnotes and Flashbacks: Week Ending April 2, 2023 ).
As a builder that is more heavily weighted than many peers toward speculative building, inventory is a critical risk factor for DHI and the industry that needs to be monitored. The good news is that DHI has an excellent track record. DHI has a strategy that is rooted in the market backdrop we have today with challenging mortgage rates swings and builders coming out of a period where supplier chain problems have undermined and elongated construction cycles.
Building an inventory of completed unsold homes allows builders to compete with existing home sales offerings in the market. Spec inventory allows the builder to shorten the time frames between an order and closing with a mortgage approval process. Spec inventory is closely monitored at the local level to reduce the risk of too much inventory that would lead to higher incentives or price weakness.
The general theme from some builders as well as DHI is that homes are being sold later in the building cycle given the need to manage the certainty of mortgage approvals and payment in a more compressed time frame. The DHI strategy is to have move-in ready homes and employ a steadier build rate to mitigate the supplier chain risks. The theory is that a more level building rate makes DHI less vulnerable than many other builders with a reliable flow from those suppliers. This allows their suppliers to plan. DHI will be well positioned to close more quickly in the event of rapid moves lower in mortgage rates.
The level approach to building makes it easier to manage supplier chain disruptions. The risks in spec building that one saw in the housing bubble presents a very different score on the “risk meter” in today’s markets. Yesterday’s vice is today’s virtue in DHI’s case. The increased use of land options and a more strategic and prudent approach to spec building is a common thread across some of the major builders. We will look at more of that in other builder reports in the future.
The typical “spec ratio” ahead of a spring selling season is usually “heavier” than the normal 50% of inventory unsold, but that has migrated higher by design ahead of the peak season given the developments in the mortgage markets and uncertainties around cancellation rates.
At 1Q23, the spec inventory was closer to 2/3 with home inventory of 43,200 units including over 27,800 unsold units. To give some scale to that unsold inventory number, DHI just closed over 17,000 homes in its seasonally slowest quarter. In other words, it does not take long to run through that number of unsold units as long as you properly manage new starts.
If the market does see a decline in mortgage rates in what has been a very volatile UST market, the ability or desire of more buyers to pull the trigger will serve the interests of those who have been building spec inventory. Closing on a home sale and a mortgage in an expected time frame underscores that spec inventory makes sense in this market. So does pulling back to the lower level on starts subject to local pace and community planning. DHI routinely highlights this balancing act in its comments.


