
Footnotes & Flashbacks: State of Yields 5-25-25
UST yields were hit by budget nerves as the 30Y UST crossed 5%. Japan systemic debt chatter made UST investors edgy.


The dark side of tariff aggression is strong with this one. Reckless he is!
A bear steepener with a major move higher in 30Y UST never helps, and it was set against major headlines out of Washington about reckless US deficits and record borrowing needs. The largest international holder of UST (Japan) was also catching systemic headlines with markets pondering if Japan would be selling UST holdings as a liquidity source.
To make matters worse, Trump went for another big swing of the bat with 50% tariffs against the EU, the #1 trade partner and one much more bureaucratically organized and almost hard-wired as an administrative culture to retaliate proportionately. A 50% tariff on top of the current tariffs with many more to come makes for big “proportions.”
The inflation wait continues as more transactions roll in with tariffs attached across the summer with an expected pipeline of new tariffs in process including pharma (a huge EU issue and China risk), semis, aircraft/parts, lumber, and copper and anything else that moves Trump. The Japan and South Korea trade talks drag on and many “reciprocal” tariffs (except they are not reciprocal) are set to be unilaterally assigned in the coming weeks without negotiations. That will warm the hearts of allies.
We look at the 5Y to 30Y UST slope history as the 30Y move makes for a very different comparison now with 5Y to 30Y above long term medians and 2Y to 30Y closing in on medians. This week brings 1Q25 second estimates on GDP and PCE inflation, and some clarity on the 50% EU tariffs would be nice.

The above chart plots some key cyclical transition periods from the Carter inversion of 1978 across the Volcker years, the credit cycle peak in 1989, the TMT cycle in 2000, and the housing bubble in 2006. The chart then jumps from 2006 to 2023 beyond the crisis period and the ZIRP years when the market saw QE and normalization distortions.
The half full view is that these earlier periods before 2007 had much higher rates and presented a mix of brutal cyclical downturns (1980-1982) and experience with stagflation (1974 was especially ugly as was 1980-1981). We see asset bubbles pop (2001, 2007) and even a pandemic (not shown above). The US markets always came back strong even if the post-Clinton years condemned the US to slow and low growth with high systemic UST debt. That is a story of remarkable resilience.
On the half empty side and despite Trumpian delusions on his overseeing the “greatest economy in history,” the growth of the 1980s and 1990s has not been replicated by a Democrat or Republican (see Trump's “Greatest Economy in History”: Not Even Close 3-5-25, Presidential GDP Dance Off: Clinton vs. Trump 7-27-24, Presidential GDP Dance Off: Reagan vs. Trump 7-27-24).
If you buy into the theme of “This Time is Different,” high systemic debt levels assure low and slow GDP growth. By assuring eroding consumer purchasing power for goods with tariffs, weak growth is almost a certainty in tandem with high mortgage rates and consumer financing rates.
As noted in the chart above, we use the Oct 2023 UST peak date on the 10Y UST as a key frame of reference. The UST rates now are very low by any historical standard but well above the Sept 2024 lows as we lifted off from the initial easing into another steepener.

The above replays our weekly chart detailing the migration of the UST curve from 12-31-21 with a memory box detailing the tightening dates and magnitude and more recently the easing.
The UST curve seems to intermittently mix bear steepening patterns and flattening rallies since the Sept 2024 lows, but market fear was creeping into the shapeshifting after Liberation Day before calming down with the pause. We shifted back into the bear steepening this past week as we detail in other charts below.
The UST curve will not be helped by record supply and shrinking demand, eroding confidence in US governance and diminished functionality in Washington (sounds better than utterly dysfunctional extremism dominated by legislative cowardice with “low IQ” personnel and weak conceptual grasps of economics). We are looking at the highest risk of stagflation since the 1980-1982 double dip and tariffs will certainly not help.

The above chart details the material move from the peak UST curve of 10-19-23 down into the UST bull rally of Nov-Dec 2023 and then eventually into the lows of Sept 2024. The Sept 2024 low tick only came after a bear steepener hit the curve through the summer of 2024. We then moved back into the bear steepener mode until the tariffs roiled the UST markets and initially sent 2Y to 30Y lower on cyclical fears.
The shift higher from the Sept 2024 lows and steepening from the low point at the end of 2023 is in the chart. We see the 10Y and 30Y notably higher with a more normal shape from 2Y out to 30Y. The challenge is still that front end inversion from 3M. This week we look at the 5Y to 30Y UST slope history further below.

The above breaks out the weekly UST deltas that we already looked at in Mini Market Lookback: Tariff Excess N+1 5-24-25. The big news was the budget headlines screaming about a UST crisis taken in tandem with the nerves around Japan risks. The Japan issues generate very different headline sovereign leverage metrics than UST debt, but the theory has always been they can place government debt and refinance domestically unlike the US. We will leave Japan risk to those that watch the world of JGBs closely.
Overall, Japan debt noise is not new. We were scrambling during the 1995 Japan Bank system crisis back in my Lehman days when the exercise was about framing counterparty exposure on swaps/derivatives. Such exposure was at a magnitude that looked more like a mid-sized nation in “maximum potential exposure math.” I was drafted (more like “volunteered”) to serve as head of credit risk in 1995 into 1996 while I was running global credit research (I told them that was bad internal controls from my years as auditor).
Japan in 1995 was my first taste of the outsized counterparty interconnectedness risk that was often ignored in the market until 1998 (Long Term Capital), but that type of risk was then forgotten by the market until revisited with a vengeance in 2007-2008. A bout of headline risk aversion is the last thing this market needs today. UST funding risk is about repricing UST levels to higher yields with more steepening. It will remain relevant.
We always go back to a few simple questions:
If everyone is a net borrower, where are the net lenders?
If many of them are international trading partners, is it a good idea to piss them off and treat them badly?
We would venture a guess that Trump does not spend much time looking at how various EU domiciles are holding UST. Everyone talks about Japan and China, but Europe adds up in total.
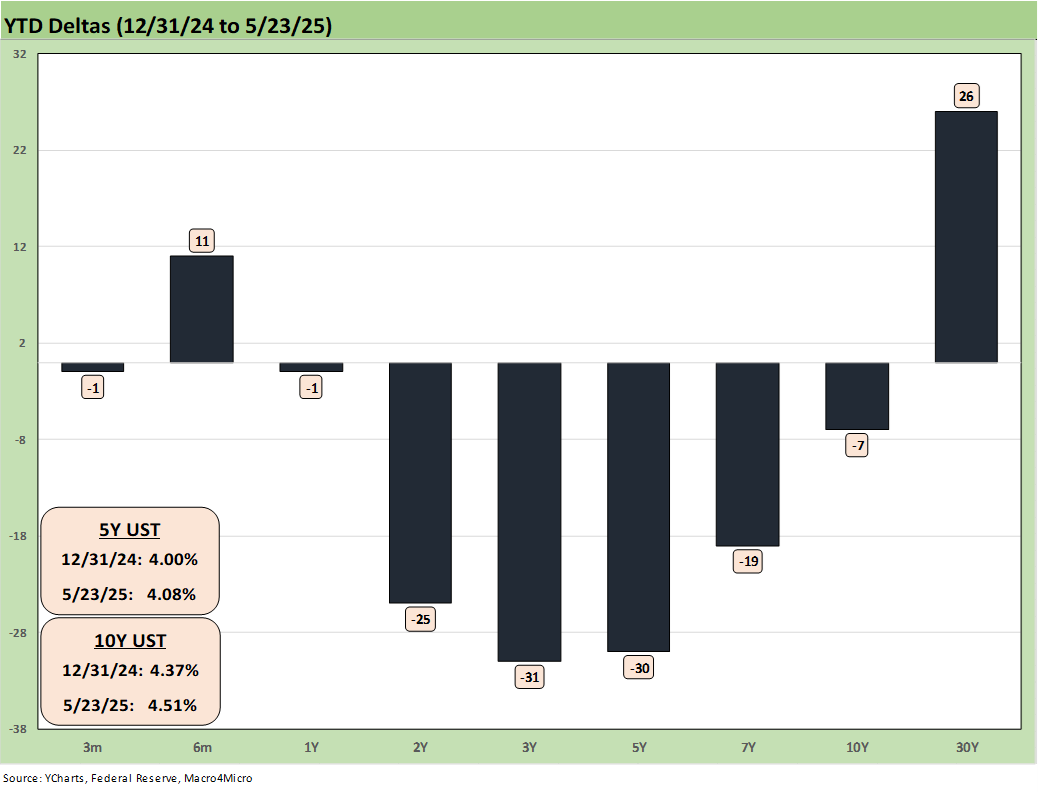
The YTD UST deltas are broken out above. We still see a rally from 2Y to 10Y but the 30Y is breaking down. As noted in our separate asset returns Footnotes publication, we saw 5 of the 7 bond ETFs we track in positive range YTD but the long duration UST ETF (TLT) and GOVT were in negative range (see Footnotes & Flashbacks: Asset Returns 5-25-25).

The above chart updates the UST deltas since the 9-16-24 lows that came alongside the easing. That has not worked as many market watchers predicted on the shape of the UST curve and number and pace of easing that was supposed to follow. While Trump rails at the Fed and Powell, the FOMC would likely be easing if it was not for Trump’s over-the-top and unprecedented tariff game plan.
The risks of an early move without clarity on the final tariff plan and some market-based data could be very costly by compounding the problem and leaving the Fed facing inflation and stagnant growth. The politics of tariffs is one challenge, but the fact remains that this tariff strategy has never been tried in the postwar era or in modern capital markets. That leaves confidence low and market risks high.
While Trump highlights low inflation during Trump 1.0 when the post-crisis markets featured ZIRP for a few years (until Dec 2015) and oil collapsed in a Saudi market share war before it all gave way to a pandemic, that does not change the fact that 2018 was a brutally bad year for asset returns, capex was dialed back into 2019 and the Fed eased in 2H19. The tariffs back then were low, narrowly targeted and still struggled to work (see Histories: Asset Return Journey from 2016 to 2023 1-21-24). What is unfolding today in tariffs is on a different planet in scale and in a global economy that features global supplier chains fashioned over decades.

The above chart updates the UST deltas from the end of 2023 after a massive rally in rates and risk in Nov-Dec 2023. The follow-on in 2024 expected by the consensus mildly disappointed the UST bulls in the timing and number of FOMC cuts but was materially different from the expectation of a material bull flattening during 2024. A bear steepener prevailed by the end of the year.

The above chart updates the running UST deltas from the 10-19-23 peak date of the UST 10Y when it barely missed the 5.0% line. For those looking for a frame of reference on what a bad move in inflation metrics might mean, these deltas at least offer a recent set of data points during an inflation fighting year such as late 2023 and into 2024 (until Sept 2024). That is why we keep revisiting that timeline. It reminds us what we could revert to.
These rally deltas could reverse in part or in whole with the wrong inflation outcomes. We don’t need to see 2022 again, but the old saying “It happened before, it can happen again” resonates for many. It does not have to be an asteroid moment like 1974-1975 or 1980-1982, but stagflation would be a major economic setback and bear market outcome if that did unfold.
Losing a rally of over -47 bps in the 10Y UST above would not help the mortgage market and would lead to a material valuation headache in equities and M&A economics. Mortgages have been a drag on housing (new and existing home sales). Inflation heading the wrong way would do more damage. The short end to 5Y would hurt consumer durables financing.

The above chart is one of those replay slides we update each week. This one posts the UST curve for this past Friday and the Freddie Mac 30Y Mortgage benchmark rate (noon Thursday release). We include two useful historical periods including the peak homebuilder year end of 2005 and mid-2006 when RMBS quality concerns were catching headlines as the housing bubble was peaking.
We post UST curves for each period in the chart. The past week saw rates move higher to 6.86% from 6.81% the prior week (and from 6.76% the week before that). The Mortgage News Daily survey ended Friday at +7.0%.
We recently added a column above detailing the differential between the Freddie Mac 30Y and the 10Y UST. That differential moved slightly lower this week to +235 bps from +238 bps. The year 2005 posted a differential of only +100 bps and makes a statement on what the mortgage market was like in 2005. The mortgage market was hot back then in the housing bubble as volumes soared during that peak homebuilding year. RMBS had run wild and risk senses were dulled. The history of that era is one for the record books and time stamped with a consumer credit meltdown and systemic crisis.

With the sharp move in the 30Y UST this week, we update the 5Y to 30Y UST segment slope. We also post the long-term medians for the other slopes we watch in the box. The 5Y to 30Y has reached +96 bps which is higher than the post-1984 median of +70 bps. For the 5Y to 30Y, that is a long way from the peak inversion of -46 bps in March 2023.
On a separate note, we see the 2Y to 30Y at +104 bps now or modestly inside the long-term median of +123 bps.
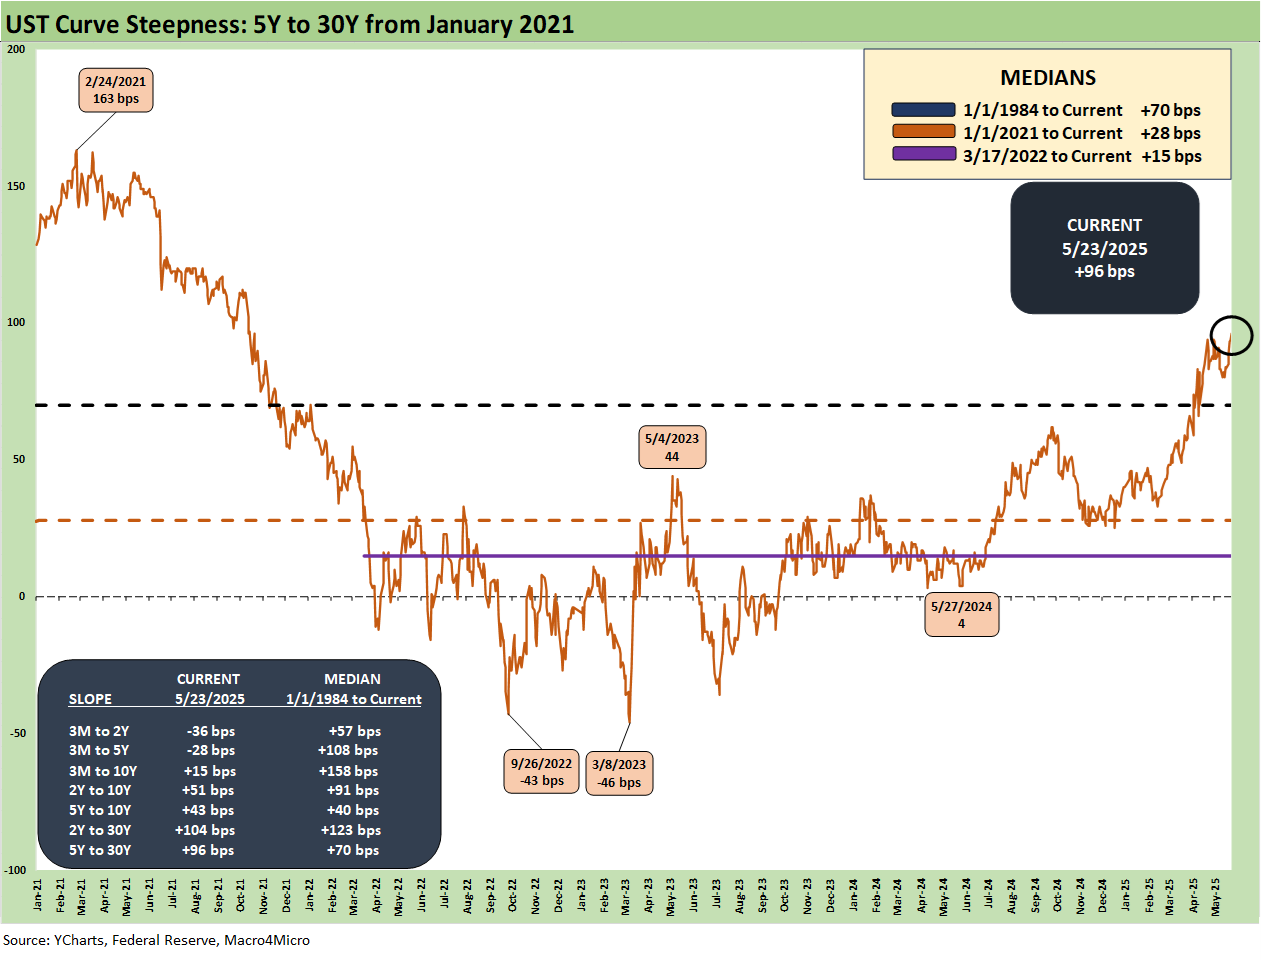
The above chart shortens the timeline to the start of 2021 during ZIRP. We see the steepening to +163 bps in Feb 2021 and then down to near peak inversions in Sept 2022 and March 2023. The current +96 bps at least resembles history. The front-end inversion is still not normal but that would also describe tariff policies and the strangest stretch of inflation and monetary policy shifts since 1980-1982.

We wrap this week’s State of Yields with an update of the running UST deltas since March 1, 2022 just ahead of the end of ZIRP (effective 3-17-22). We include the 12-31-20 UST curve and 10-19-23 peak UST curve as frames of reference.
See also:
Footnotes & Flashbacks: Asset Returns 5-25-25
Mini Market Lookback: Tariff Excess N+1 5-24-25
New Home Sales April 2025: Waiting Game Does Not Help 5-23-25
Existing Home Sales April 2025: Soft but Steady 5-22-25
Credit Snapshot: Lithia Motors (LAD) 5-20-25
Home Starts April 2025: Metrics Show Wear and Tear 5-19-25
Footnotes & Flashbacks: Credit Markets 5-19-25
Industrial Production April 2025: CapUte Mixed but Time Will Tell 5-15-25
Retail Sales April 25: Shopping Spree Hangover 5-15-25
Credit Spreads: The Bounce is Back 5-13-25
Recent Tariff Commentaries:
CPI April 2025: 1st Inning for Tariffs and CPI 5-13-25
US-UK Trade: Small Progress, Big Extrapolation 5-8-25
Tariffs: A Painful Bessent Moment on “Buyer Pays” 5-7-25
Trade: Uphill Battle for Facts and Concepts 5-6-25
Tariffs: Amazon and Canada Add to the Drama 4-29-25
Ships, Fees, Freight & Logistics Pain: More Inflation? 4-18-25
Tariffs, Pauses, and Piling On: Helter Skelter 4-11-25
Tariffs: Some Asian Bystanders Hit in the Crossfire 4-8-25
Tariffs: Diminished Capacity…for Trade Volume that is…4-3-25