
Footnotes & Flashbacks: State of Yields 11-26-23
We look at a relatively quiet UST week with a modest adverse move in rates.


In what was a quiet, holiday-shortened week that was light on major releases, the market saw limited drama with the UST curve slightly higher, spreads tighter, and equities again posting up gains.
Looking ahead, we have PCE inflation data and a fresh read on consumer expenditures again this coming week plus a small side betting exercise of whether the second cut of GDP will hit the 5% line with any revisions.
We look at the latest inversion update for 3M to 5Y UST and 3M to 10Y UST as the inversion remains a factor for those pondering deployment into more risks – duration or credit or equities.
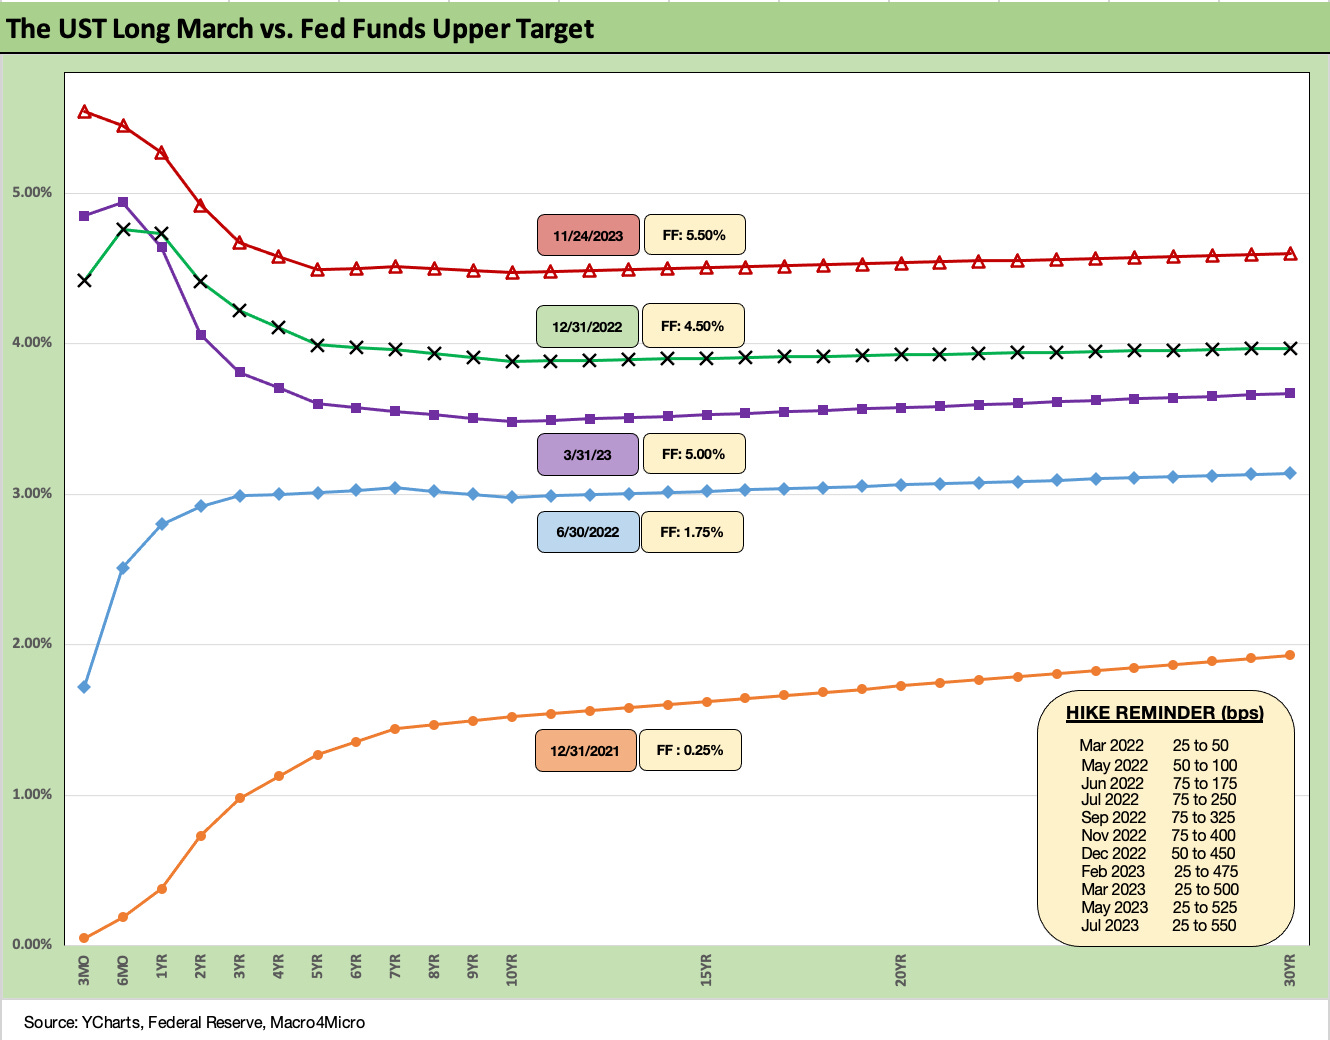
The above chart revisits the path of the UST curve across the tightening cycle with a “reminder box” in the chart detailing the timing and magnitude of the Fed hikes. The UST curve and duration has been riding a bit of a wave in recent weeks that had calmed nerves in the equity markets and drove some UST hedge fund super bears to retreat.
While it does not always get the focus in all the political noise, the inflation numbers are getting back to healthier levels in multicycle context and headline inflation now sits on top of the post-1972 median (see Inflation Timelines: Cyclical Histories, Key CPI Buckets 11-20-23).
Headline inflation is much improved while CPI for All Items Less Shelter is comfortably below median at a 1% handle. The role of Shelter in the CPI picture and how it basically dominates the Service component of CPI. That makes the debates over the value of overstated Owners’ Equivalent Rent (over 25% of the CPI index) a pretty important variable. (If you ever had an econ professor who you thought was a smug, self-important tool, this would be a good time to remember it.)
The UST action picked up after Oct 2023 CPI (see October CPI: The Big 5 Buckets and Add-Ons 11-14-23) in a period that saw mixed retail numbers (see Retail Sales: No Disturbance in Retail 11-15-23), balanced industrial production (see Industrial Production: Pit Stop or Tapping Brakes? 11-16-23), and respectable residential construction (Housing Starts Oct 2023: Back in the Game Coach? 11-17-23).
That catalyst for the UST curve came after the absence of hot employment trends (see October Jobs: Market Ponders the Enigma in the Puzzle 11-3-23). Positive payroll but lower adds to payroll are among the mixed trends that have kept the risk bears at bay and generated an impressive trailing 1-month return pop across more benchmarks with a much broader equity rally all the way down into small caps. We look at asset returns in a separate publication.
The waiting game for job losses still lies ahead. With the UAW collective bargaining battles over, we will see some variances in the payroll numbers to be reconciled when November employment numbers come out on Dec 8.
The new theme music of “how long” rather than “how high” has benefited from some supportive releases that show the UST curve can come down without a contraction threat as the consumer sector hangs in and mitigates PCE downside. The same is true of corporate capex levels in the fixed investment accounts as reinvestment stays healthy and such markets as new construction stay resilient even if topping off (see Construction: Project Economics Drive Nonresidential 10-2-23).
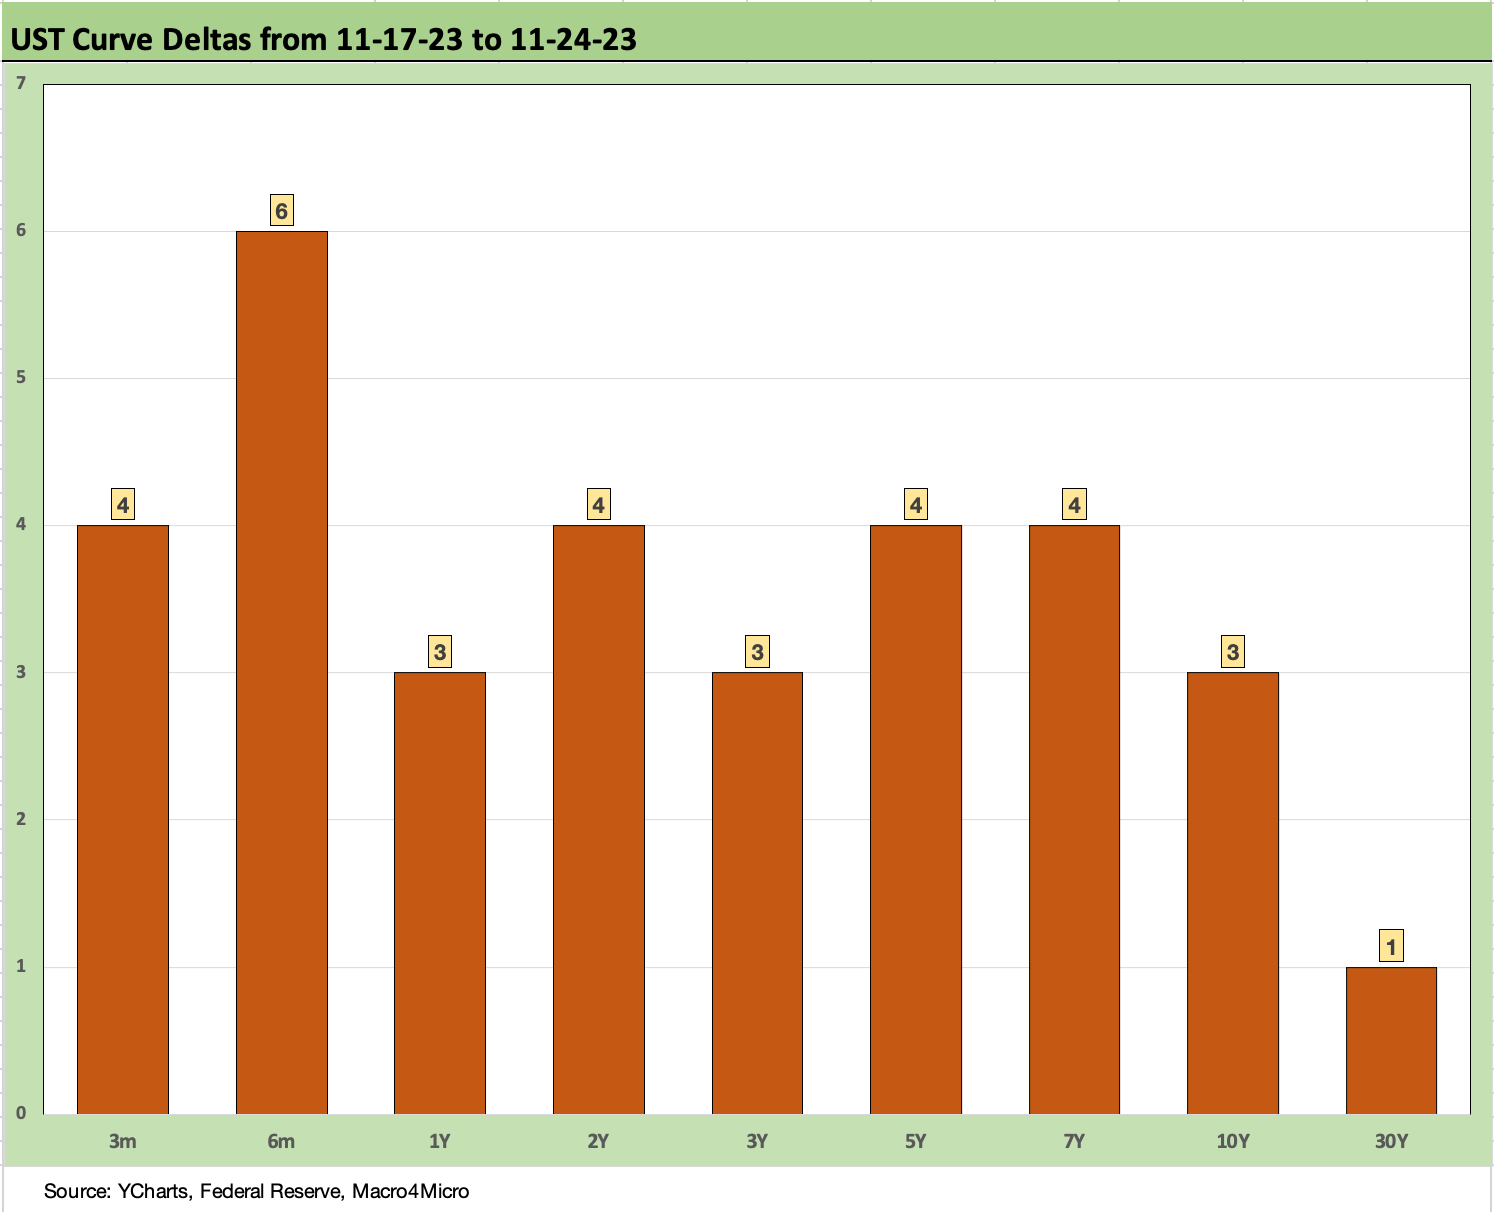
The above chart updates the 1-week UST deltas and shows mild moves by recent standards. These numbers are a small retracement from the recent action we covered in prior weeks.
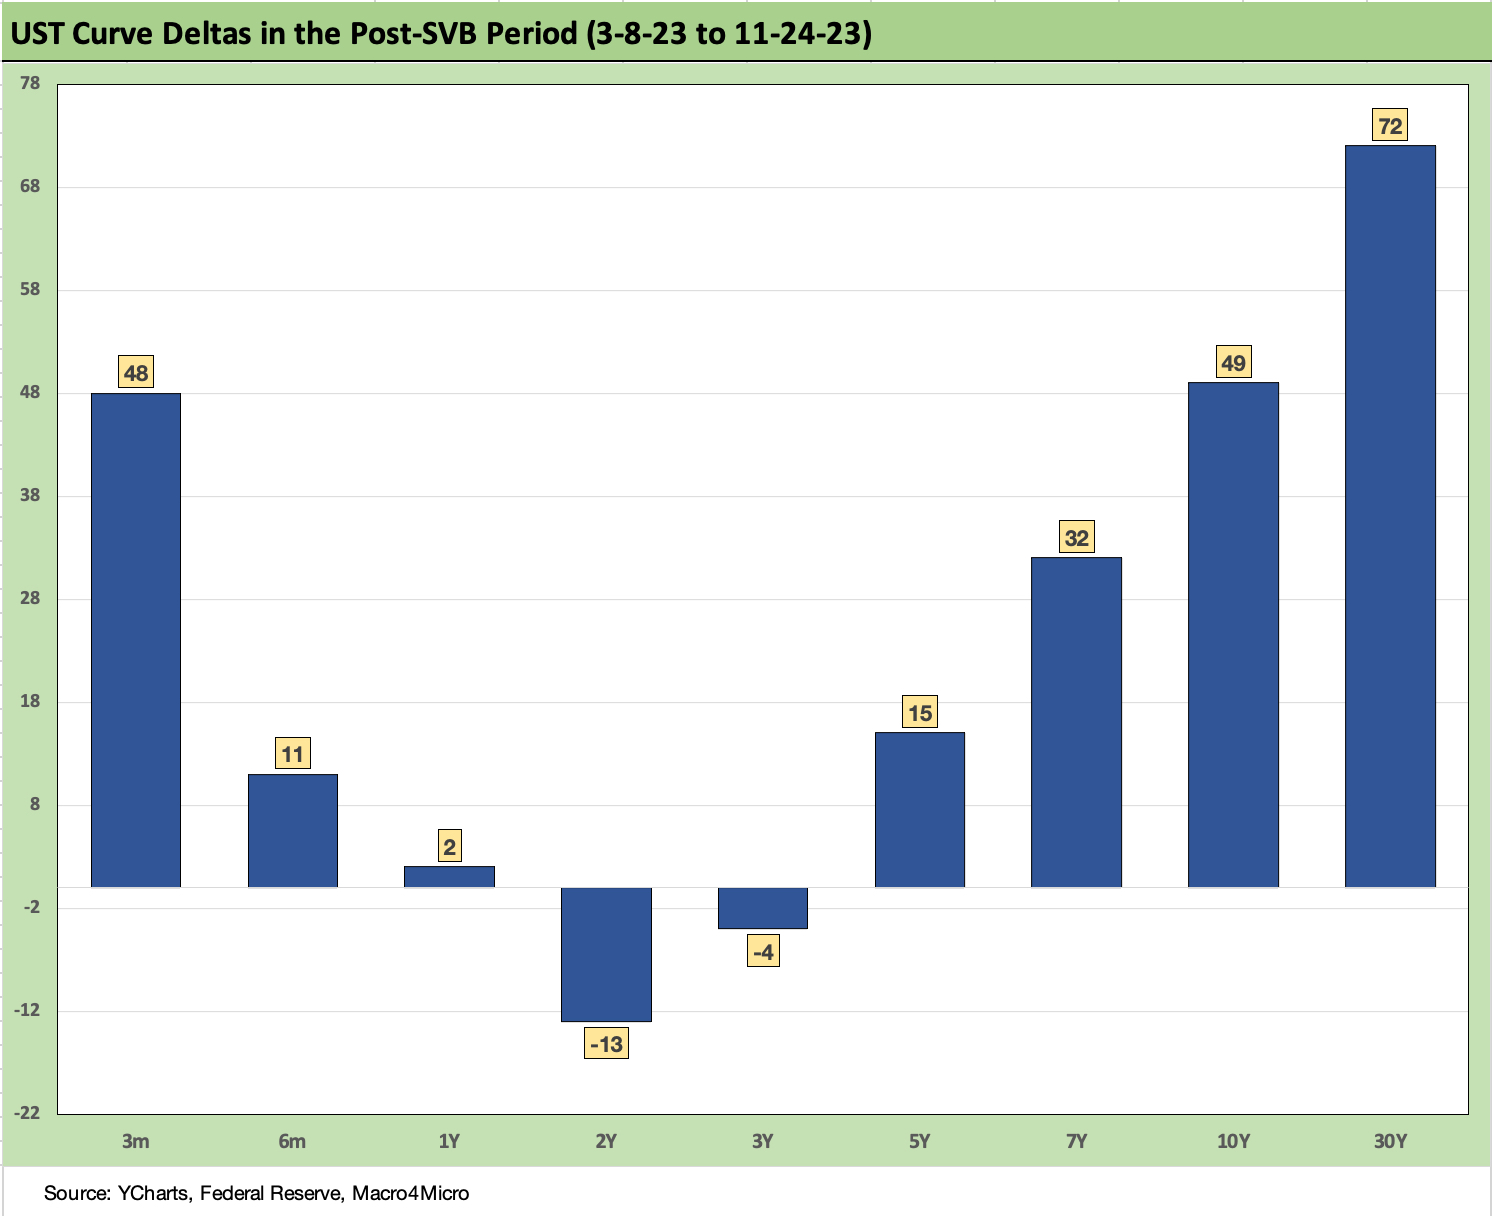
The above chart updates the UST deltas since the regional bank mini-crisis unfolded with Silicon Valley Bank in March. The 3-8-23 date marks the last clean trading day before SVB imploded and was seized on that Friday 3-10-23. The UST action is a bear steepener, but the magnitude is milder and waiting for more input. The 10Y UST delta has been a source of pain for some markets more than others and notably the trend in 30Y mortgage rates we address later in this piece.
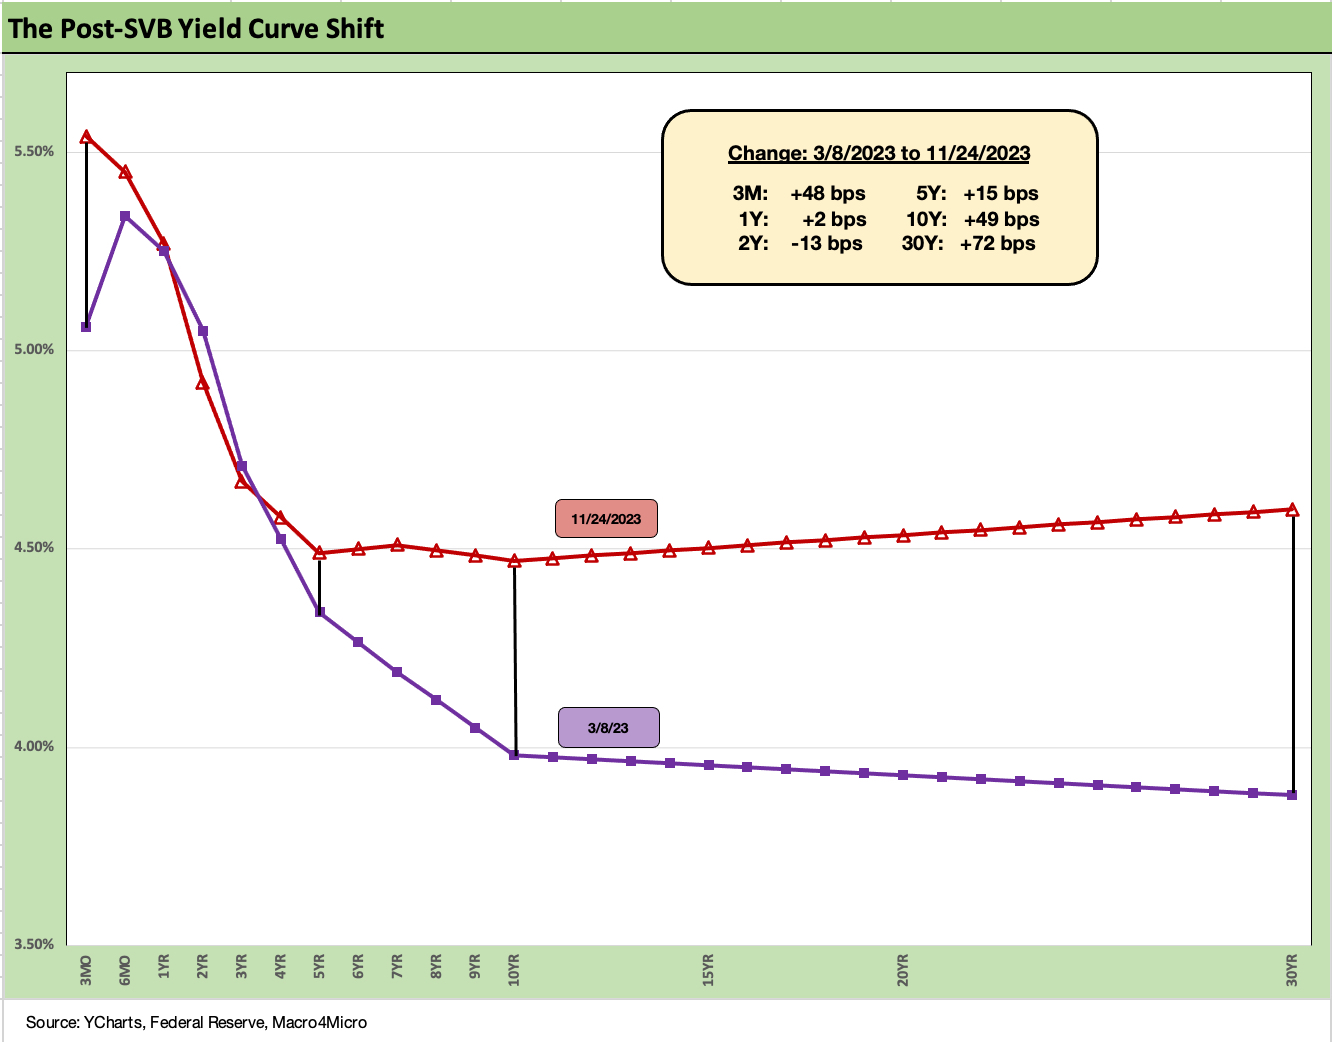
The above chart frames the post-SVB UST deltas in yield curve format, and we see the partial reversal of the steepening that we had before the recent rallies with the UST curve now flatter than it had been when duration was getting beaten up.
We looked at the slices of the UST segments and related slopes in last week’s Footnotes (see Footnotes & Flashbacks: State of Yields 11-19-23). We broke it up into 2Y to 5Y, 5Y to 10Y, and 10Y to 30Y.
The UST bear steepener is very much in place since early March, but the relationship of 5 Y to 10Y is again “flattish” even if history says it should be upward sloping. The long-term median of 5Y to 10Y is +42 bps. The median from early 2021 is flat.
The bubble lookback years…
This is a chart with some commentary we like to keep in the weekly since we get new readers each week. We try to update as appropriate and tweak/add commentary where needed.
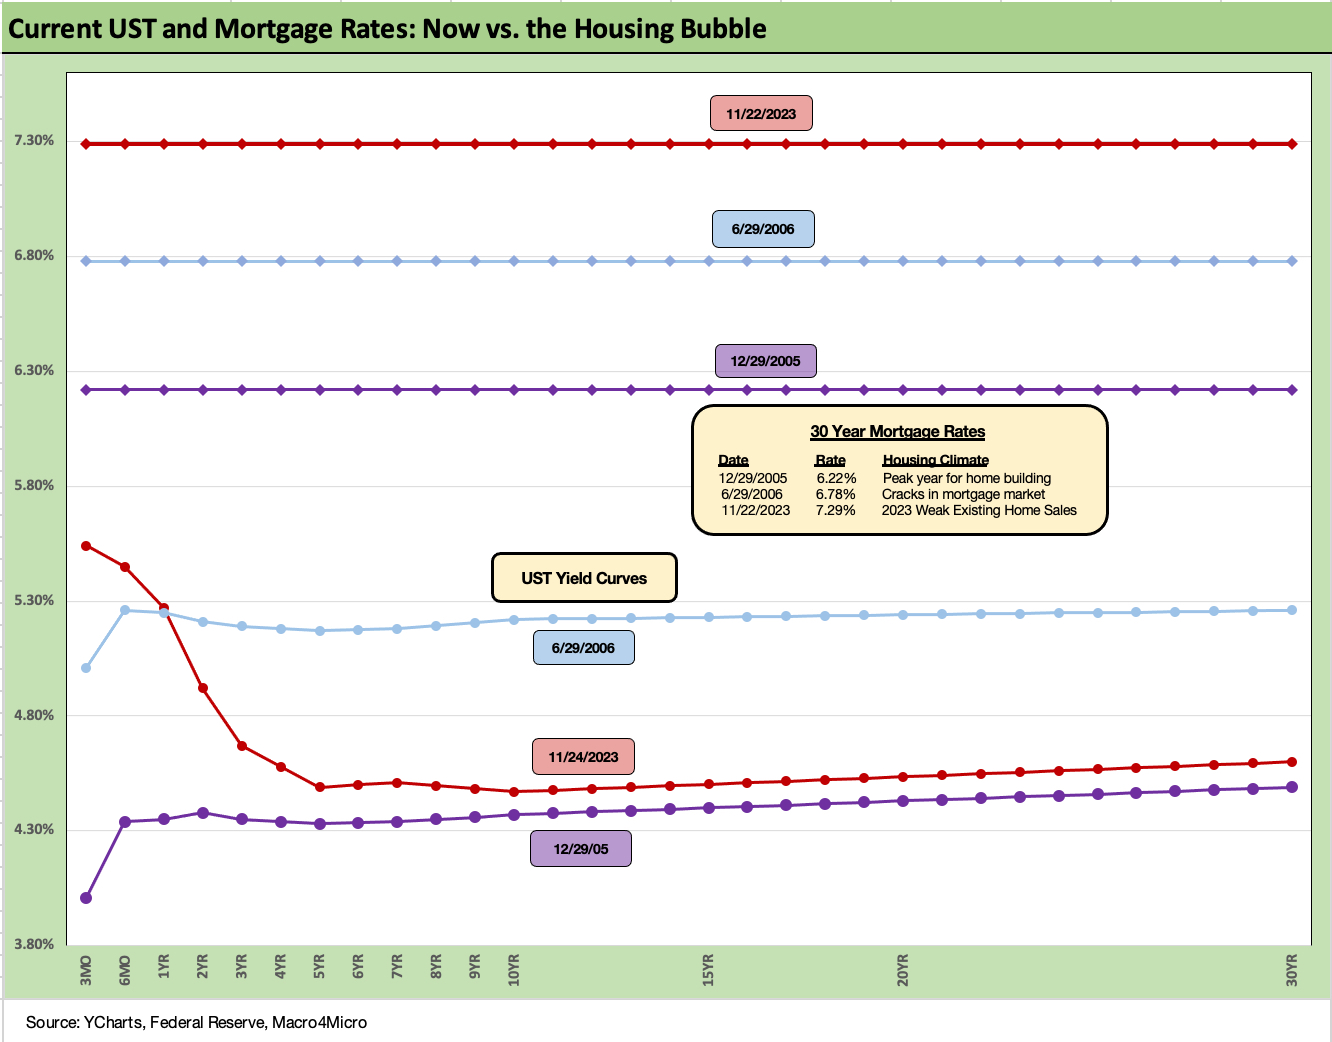
With this chart, we drop in the UST curves and the Freddie Mac 30Y mortgage benchmark for two periods from the housing bubble. The historical comparison gives context to how strong demand can be with 6% handle mortgage rates such as in 2005 and 2006. The problem this time around is how much home prices soared in 2020-2021 ahead of the Fed tightening cycle. We include the year end 2005 date as the peak homebuilding year and the middle of 2006 when the “liar loan” phenomenon and subprime excess was cresting.
In 2006, subprime was starting to show some cracks but was not yet sending the credit markets into a case of nerves. That would take more quarters to go by. Even then, equities only folded later in the fall of 2007 before the onset of a recession in Dec 2007 (that “official” date for recession was set by NBER much later).
It is notable that the current UST curve is now above the end of 2005 in 10Y UST but well below the intermediate and long end of the UST curve seen in mid-2006. Despite that UST configuration, the 30Y mortgage levels of 2023 are well above 2006 and were pulling away before this latest curve rally. The mortgage vs. UST relationship is a reminder of how mortgage spreads have trended in this cycle vs. the years of overconfidence in the pre-crisis period.
The latest move on mortgages helps, but 7% is a long way from a housing catalyst…
The 30Y mortgage market as benchmarked by Freddie Mac ticked down to just under 7.3% this past week. Any downward moves make it easier for homebuilders to do even more attractive buydowns and keep their run rates on housing starts solid enough to push back on recession theories. That said, even a flat 7% mortgage delivers an enormous amount of monthly payment pain to homebuyers. With so many potential sellers sitting on 3% handle mortgages (and even lower), the inventory is going to stay tight (see October Existing Home Sales: Searching for Lows 11-21-23 ).
The signal from the homebuilders on what rate level works for many buyers in their mortgage rate buydown incentive programs appears to be the high 5% handles. That does not imply that low 7% will move enough potential sellers in the existing home sales market, but it gives the builders more to work with as a starting point.
Basically, the homebuilders will keep on winning in this market even if we see the pace topping off right now as we move into the offseason. We looked at a range of homebuilder rankings (Revenues, ASPs, market caps) and stock performance data in a report we recently posted (see Pulte: Relative Value Meets Old School Coupons 11-15-23). This past week, we also updated the state of affairs at the #2 US homebuilder with a look at Lennar (see Credit Crib Note: Lennar 11-22-23).
LEN showed some weakening volume and prices in the most recent quarter, but the ability of the builders to generate massive amounts of free cash flow and pick up share of total home sales from existing home sales was a trend line in recent builder earnings reports. This coming week we see the Oct 2023 new home sales release that includes the total of Existing Home Sales (see October Existing Home Sales: Searching for Lows 11-21-23 ) and Starts (see Housing Starts Oct 2023: Back in the Game Coach? 11-17-23). Builders keep picking up share and the ability to tailor the home to the buyer with the right package of mortgage offerings is how builders have performed so well in the 2023 market.
Even though mortgage rates are the prime driver of monthly payments, the supply-demand imbalances (favoring demand) are not helping prices equilibrate to the monthly payment that works for many homebuyers and especially the first-time buyers and many move-up buyers. In other words, home prices did not tank and are unlikely to do so. That is dictated by demand and lack of inventory.
Existing home sales are back at crisis period levels and the inventory swing factor that supported prices has also combined with mortgage rates to stretch affordability beyond many potential buyers (see Sept New Home Sales: The Need to Live Somewhere 10-25-23). That has been good news on the home equity value front for many households with their home as their main household asset. Many depend on a home and social security for their golden years.
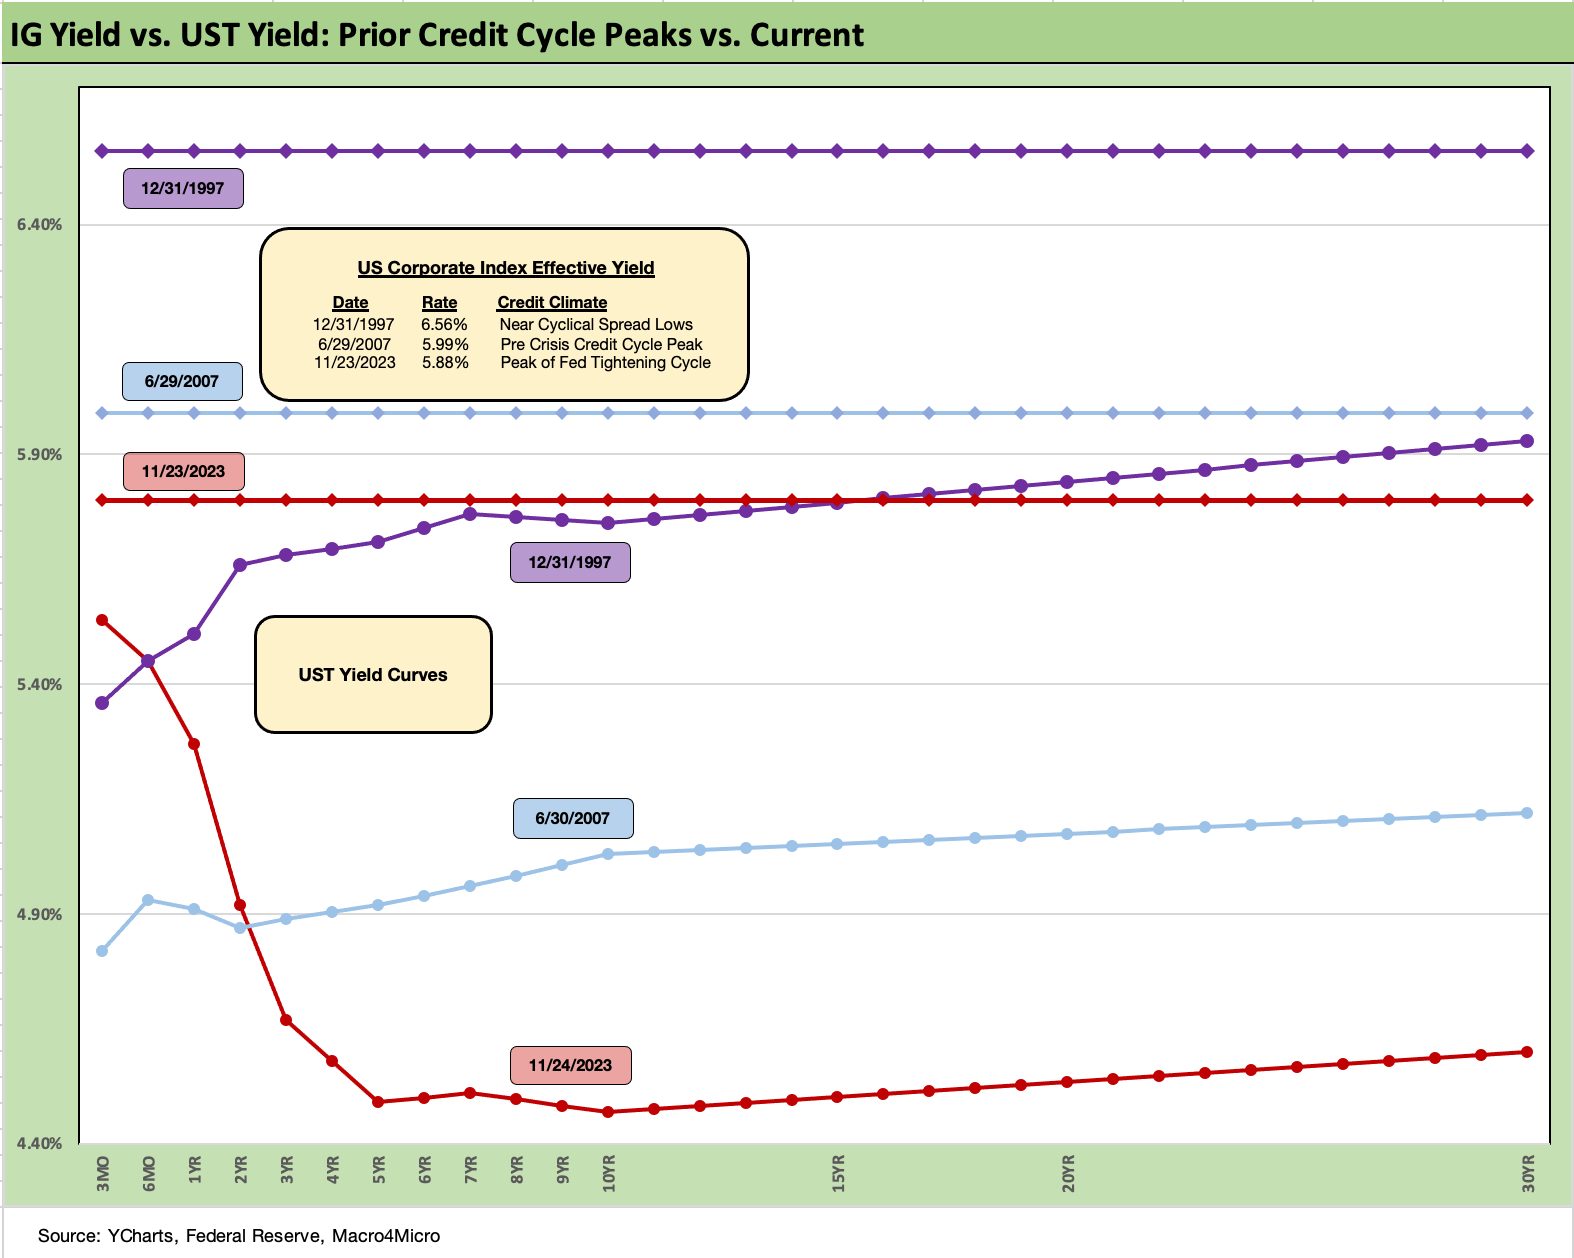
The above chart goes through a similar exercise for the current UST curve and IG index yield for current days vs. two periods (1997, 2007) when the IG corporate bond market was at or near credit spread lows.
Spreads were much tighter in those peak periods relative to the +114 bps to close last week in the ICE IG index (11-24-23). For the past week, IG spreads tightened by another -6 bps with quality spreads compressing slightly withing IG. That makes -16 bps tighter on the month, which is a very strong performance by IG standards.
The ICE IG index OAS is around 20 bps through the long-term median, so spreads are still not signaling trouble or fears around a material spread wave along the speculative grade divide (see HY Credit Spreads: Migration, Medians, and Misdirection 11-6-23).
As we look back across periods of spread compression near credit cycle peaks, the +70 bps for the IG index at the end of 1997 was much lower (the low was in Oct 1997 at +53 bps) than today. The same is true at +100 bps at 6-30-07 at the credit bubble peak when IG spreads were tight. The takeaways from the 1997 and 2007 periods were that those risk premiums were in stages of the credit cycles that were on shaky ground given the direction of credit quality.
As we now know, the market events got very noisy after those 1997 and 2007 periods and dramatically so after June 2007. The 1998-1999 period was a protracted period of global credit volatility (Asia, EM, etc.) ahead of the launch of the eurozone credit markets to start 1999.
For TMT, it ended badly, but the resilience in the risky asset markets (HY and equity alike) was remarkable in retrospect given the ability of the US credit markets to decouple from Asia and then the broader EM turmoil that helped send LTCM into a soft bailout crisis.
The ability to turn away from risky Yankee deals in late 1997 and into 1998 was clear enough, but the tech enthusiasm in the equity markets was hard to shake with the NASDAQ at +86% return in 1999 even with the default rate materially higher by 4Q99.
BBB tier hangs tough in 2023…
It is notable that the BBB tier OAS has not been moving much across these recent rally weeks seen in the UST and equity markets. That changed last week with the -6 bps move tighter to bring the trailing month to -17 bps tighter. On a YTD basis, the BBB tier is -30 bps tighter. That means over $4 trillion of face value ($3.65 trillion of market value) in the medium grade tier is not showing a case of nerves at this point.
The BBB tier posts an all-in yield of over 6.1%, so we view that as investors looking at all-in yields more as the demand catalyst than the relative value of the risk premium in longer term context.
The BBB tier OAS of +142 bps to end last week has been a winner vs. 2022 when we saw periods with +200 bps handles in the late Sept/Oct period and earlier in July 2022. The same pattern was true for HY OAS. That +200 bps stretch was a period when a lot of “we are in a recession now!” commentary was loose in the market (see Unemployment, Recessions, and the Potter Stewart Rule 10-7-22).
Back in 2022, we did not see a recession in place even if just on the employment numbers and steady positive PCE. Expecting interest rates and oil pain to take a toll was easy enough to speculate on for a recession to roll in at some point even if later in 2023. Even just a 2001 style recession-lite period was a reasonable assumption (note: 2001 was the mildest postwar contraction despite the ugly credit cycle). In 2023, that recession never came.
We did not see recession signs by any stretch during 2022 but assumed the burden of interest rates, oil, and consumer pressure would eventually show up. Contraction has been slow to arrive despite the consumer credit quality signals on consumer delinquencies and some slowing of job growth so far.
Since then, inflation came under control faster than we could have hoped for (CPI “All Items Less Shelter” at 1.5%). The economic reality is that fixed investment has been nothing short of impressive across 2023 and especially relative to expectations. That PCE and fixed asset performance will get drowned in a sea of political bile and the whirlpools of election year invective that will be flowing, but there is still no recession on the ground (see GDP 3Q23: Old News or Reset? 10-26-23) apart from forecasts and assumptions.
The markets are even trying to handicap inventory and trade flow deltas to see if the Biden team can squeak out a 5% line this coming week on “GDP take 2.” That would be great political PR, but that will get reeled back to earth soon enough in what has been a slow growth economy since 2000 (see 1Q23 GDP: Facts Matter 6-29-23).
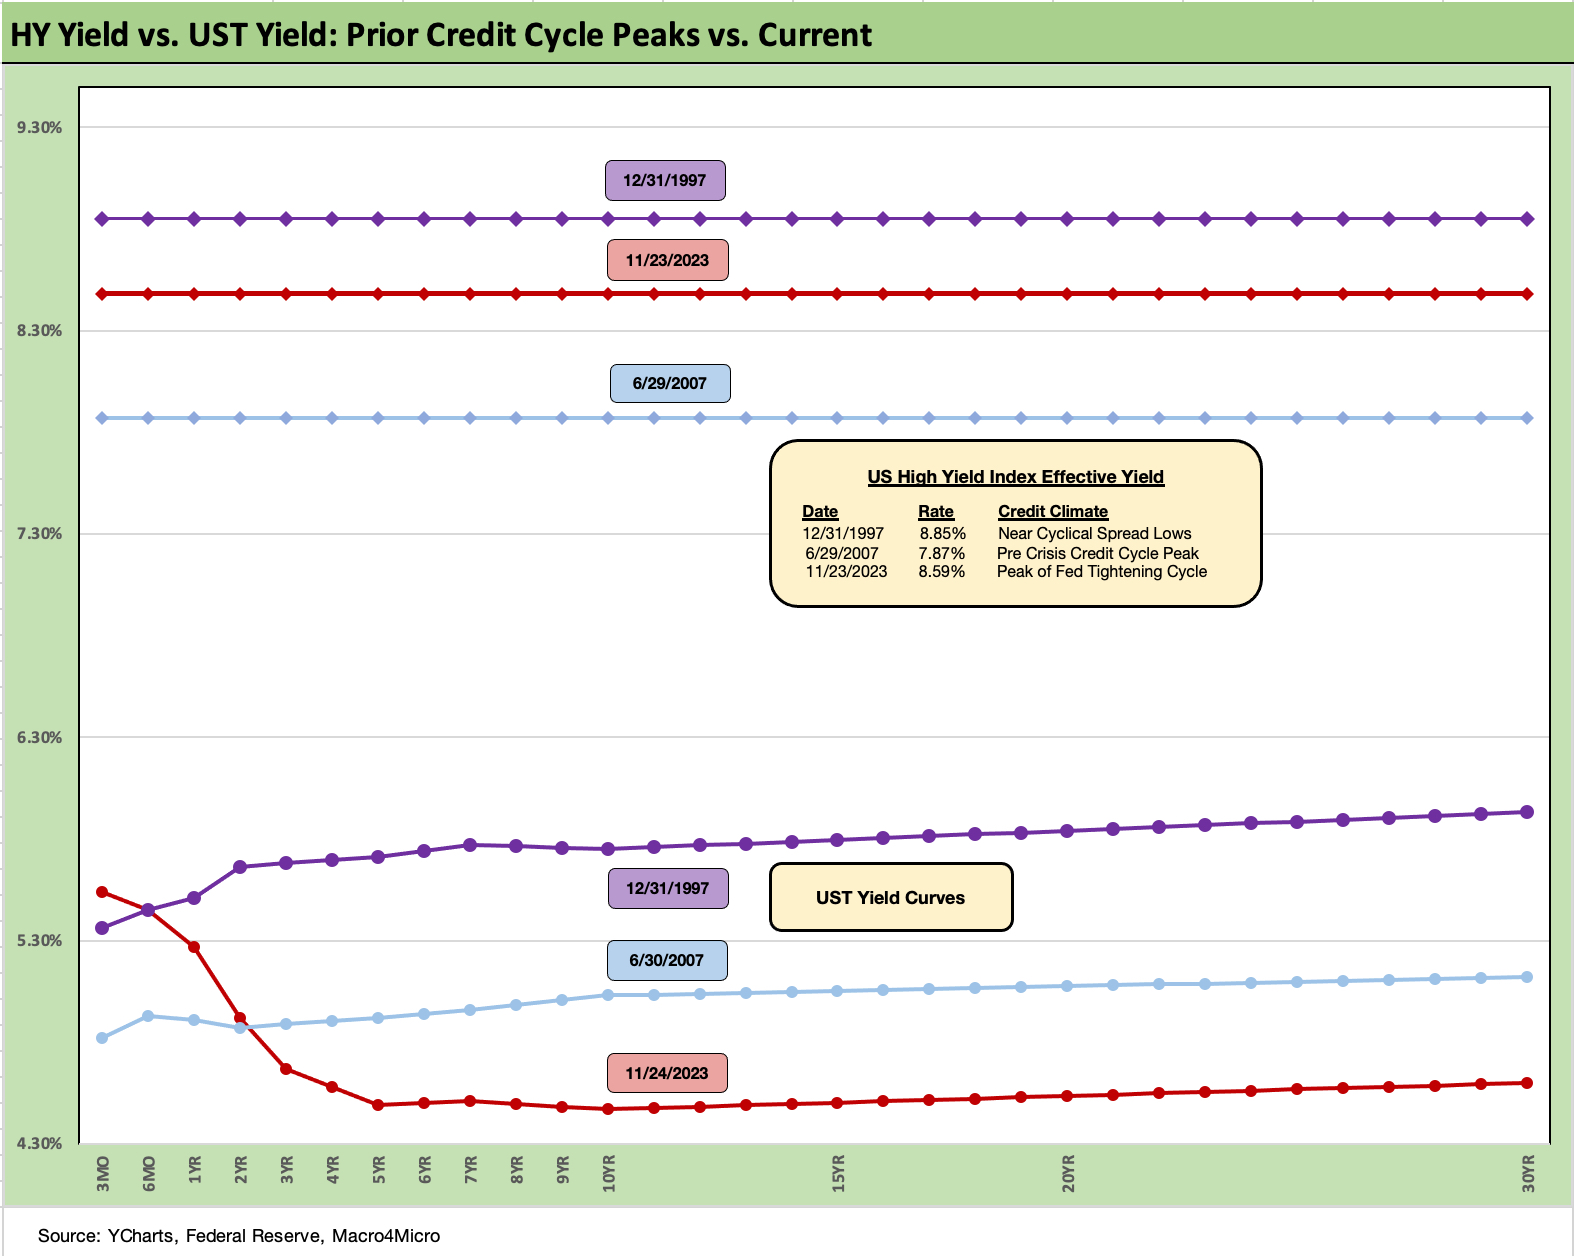
The above chart does the same drill for the US HY market as we did for the IG markets. We use the same dates to frame the symmetry of risks today. We saw HY OAS at +296 bps (12-31-97) although HY OAS had been inside +250 bps in Oct 1997 (+244 bps 10-17-97).
During the crazy period of June 2007 as the market fuse was burning down, we saw HY OAS of +298 bps on 6-30-07 (as tight as +244 on 6-1-07) vs. the +385 bps to close last week (11-24-23). HY OAS was a dazzling -49 bps tighter the week of 11-3-23. For the current week (11-24-23), the move was -14 bps tighter after only -4 bps tighter the prior week. The BB tier was -52 bps tighter during the big rally week of 11-3-23, the B tier -47 bps tighter, and the CCC tier -24 bps tighter. The CCC tier is now back to tighter by -24 bps for the trailing month with the BB tier -53 bps tighter and B tier -54 bps tighter.
The absolute OAS in historical context and relative to the risk free and lower risk alternatives do not stack up well vs. history and medians (see HY Credit Spreads: Migration, Medians, and Misdirection 11-6-23). They have tightened materially across the year from year end 2022 (+481 bps ICE) to the current +385 bps. We had expected HY OAS to get shaken by now from such tights, but this has not happened.
These levels are well below the long-term HY median of around +472 bps, so the risk-reward symmetry is getting shaky. For reference points, we can even start talking about the June 2014 lows (+335 bps on 6-23-14) and Oct 2018 lows (+316 bps on 10-3-18). Those 2014 lows and 2018 lows are 2 or 3 good months away. Those lows were not like 2007 or 1997, but low 300 handle are rare.
The all-in yields are hard to resist for many. On 6-23-14, the HY YTW was 4.85% while 10-3-18 posted YTW 6.24%. Both of those yield backdrops are substantially below the 8.7% HY index YTW to close on Friday (11-24-23). An asset allocation strategist can be forgiven for chasing yields that high even if the risk premium is too low in historical context vs. lower risk alternatives.
The 5.9% yield in IG corporates leaves ample room for debate on the relative asset class value of IG vs. HY in expected returns. If you are thinking soft landing or mild recession and easing, the old trade-off of duration and interest rate risk vs. credit risk comes into play. If you are thinking hard landing, then IG is the safer play vs. HY. That is a topic for another day in planning for 2024.
Fundamentals have been in aggregate solid, and the 3Q23 earnings season did not signal trouble in the immediate context of spreads. For the HY energy sector names, oil has been well behaved so far in all the Mideast turmoil and even dropped into $70 handles and $75 WTI to end the recent week. OPEC differences on supply and production quotas captured some airtime this past week.
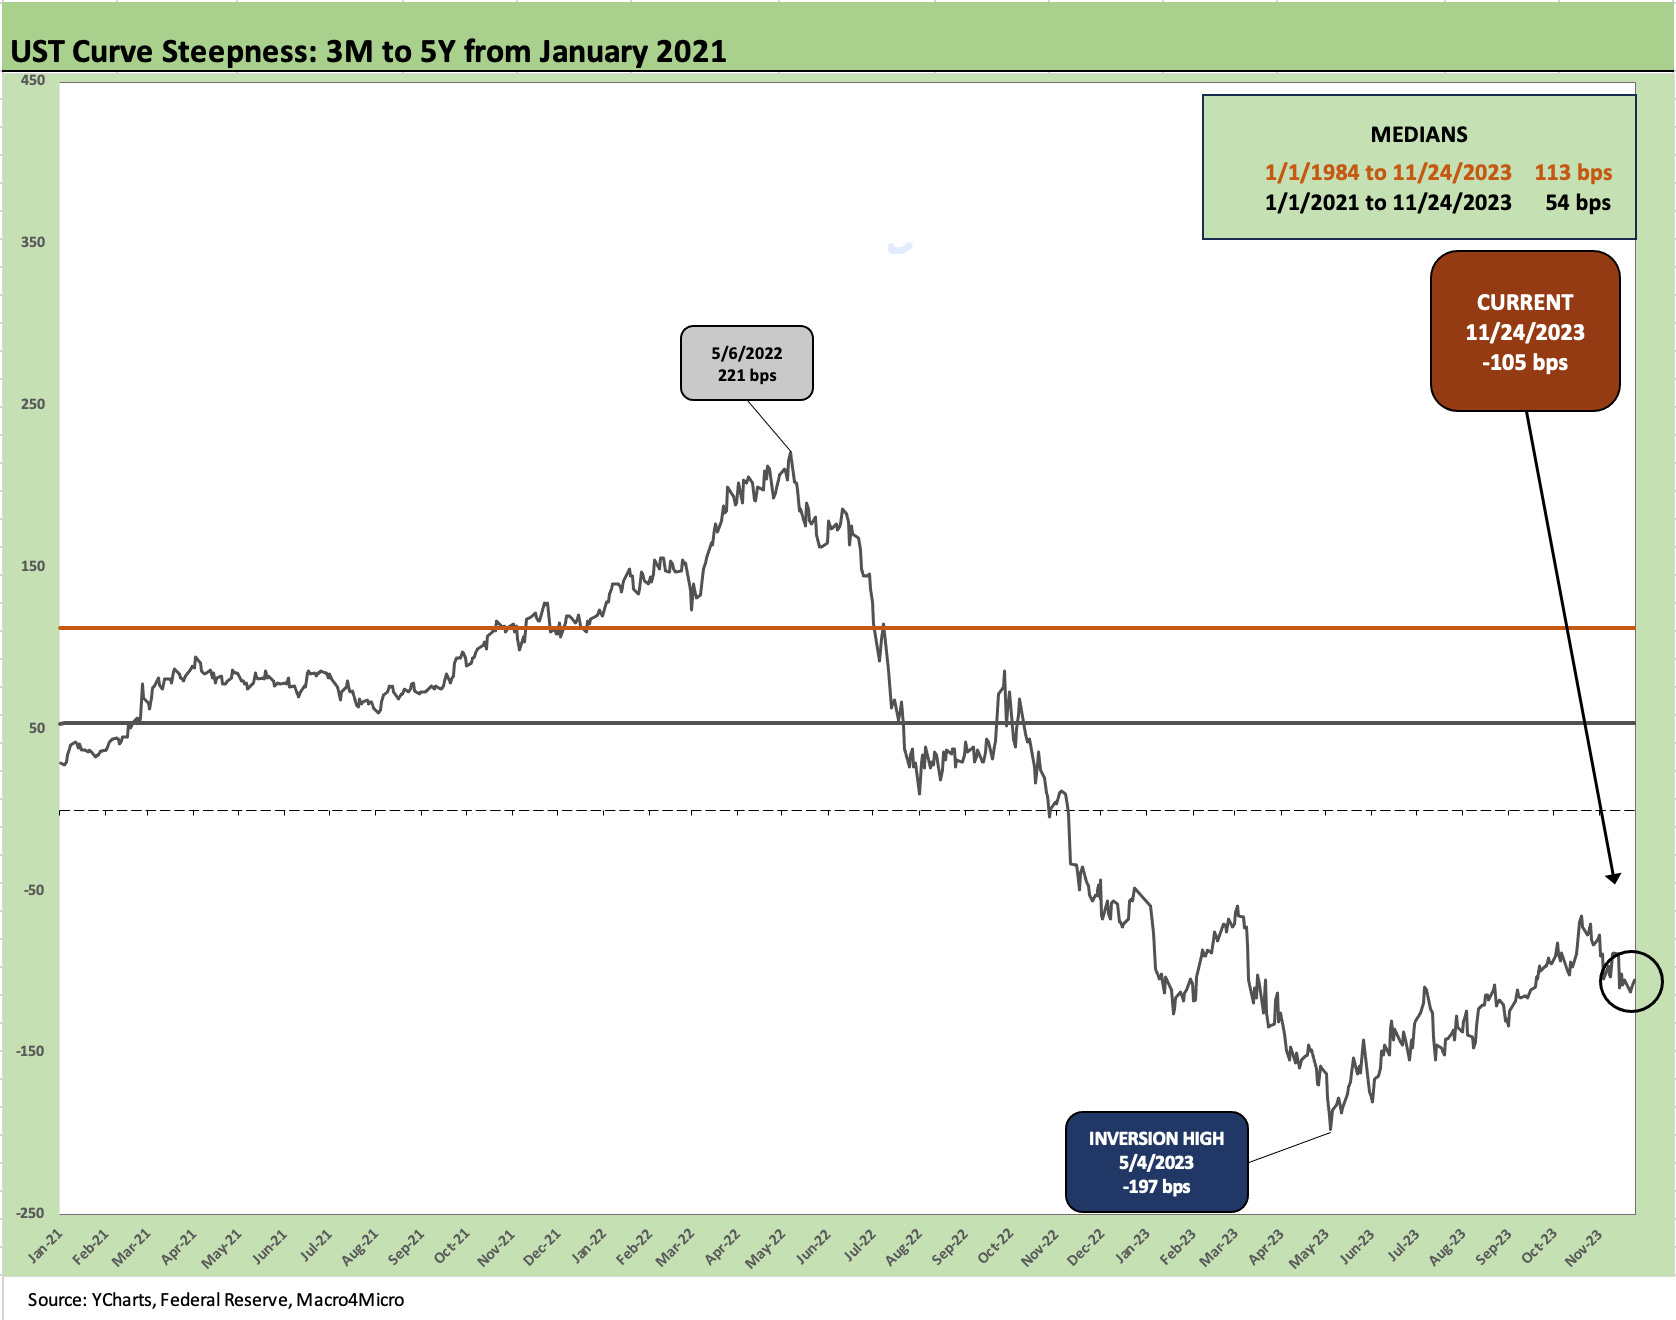
The above chart updates the 3M to 5Y UST as a reminder of where we stand for those who need an option to still sort out their choice of risk across rates/duration vs. fundamental risk in equities and credit. Those decision points on cash have been in recurring debates since we started posting last fall (see The Cash Question: 3M-5Y Yield and Slope 10-19-22). The current inversion of -105 bps is a long way from the post-1984 median of +113 bps and post-2021 median of +54 bps even if well inside the -197 bps of May 2023.
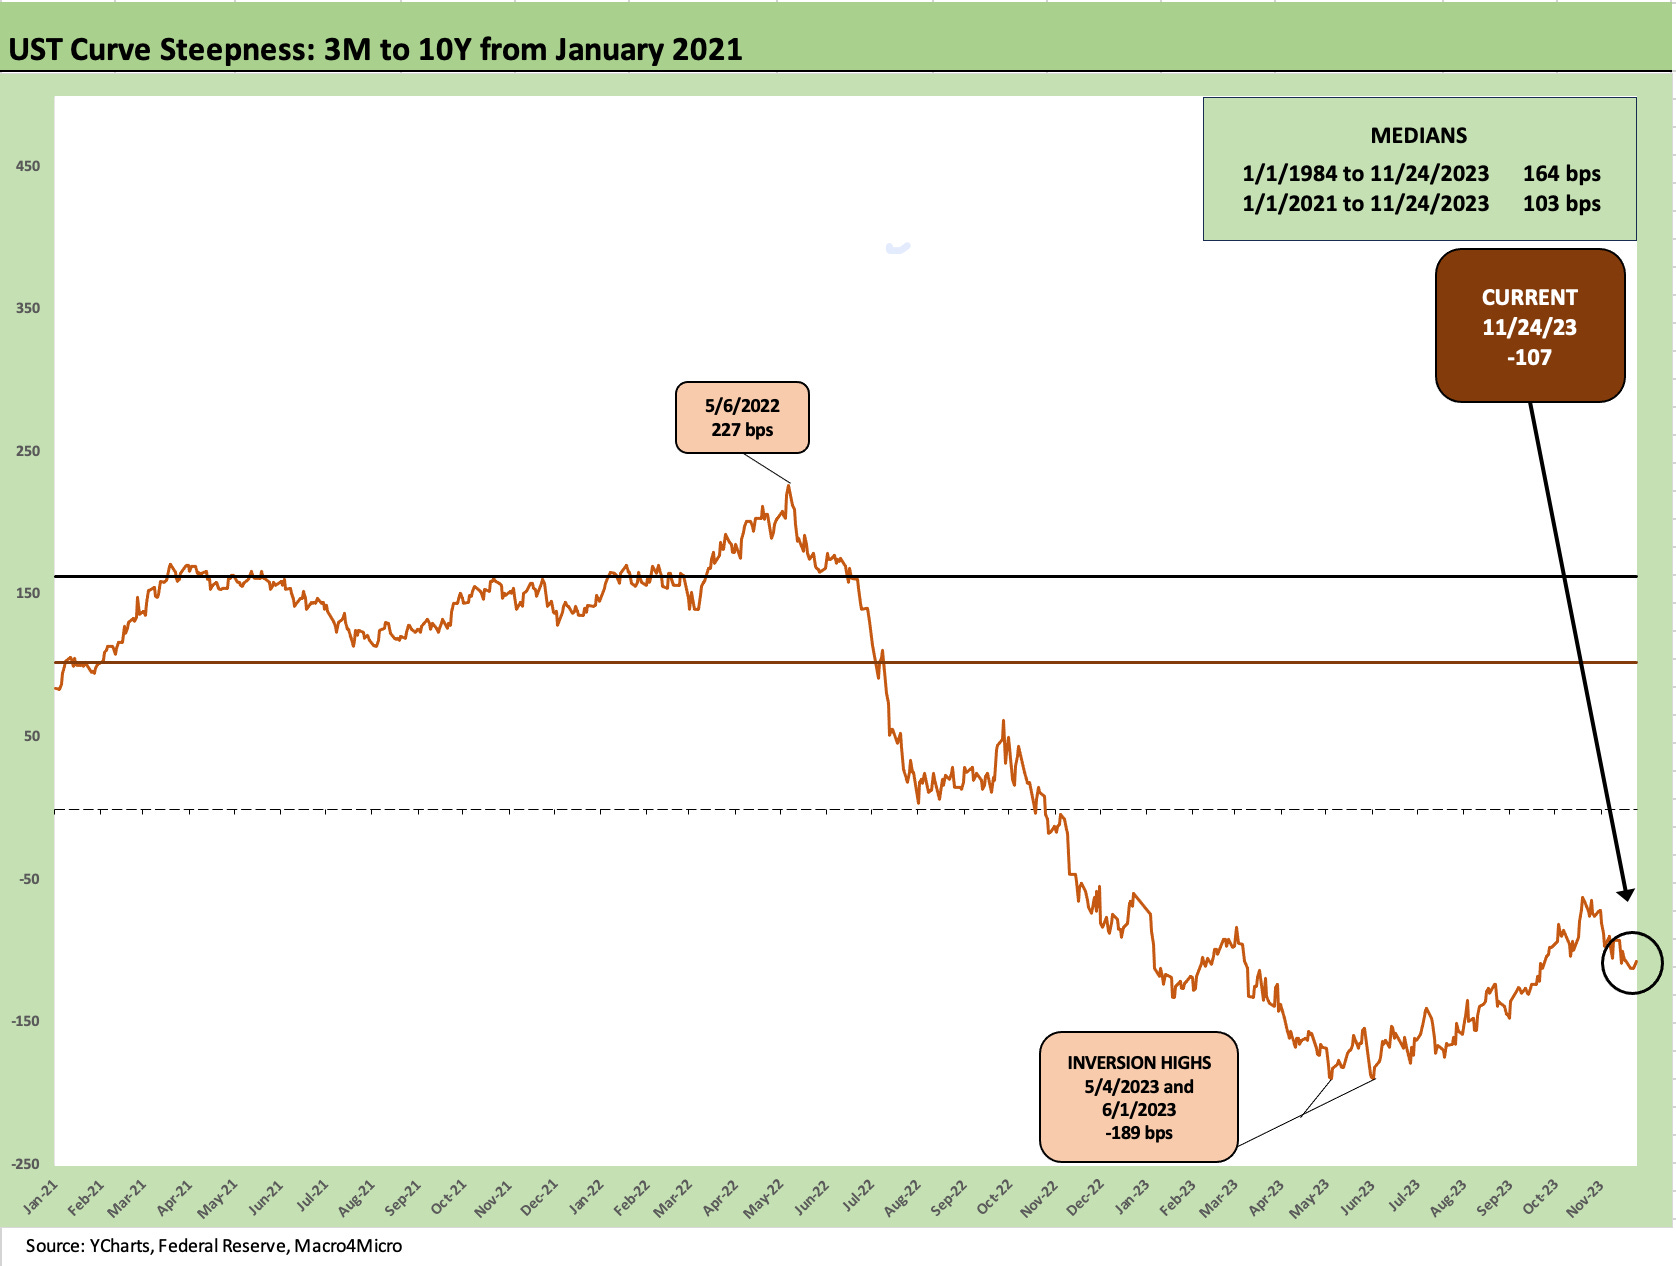
The above chart extends out the inversion frame of reference to the 3M to 10Y UST. The -189 bps peak inversion is now back to the current -107 bps. That is when the cash risk at 5.4% area handles and duration risk for sub-5% levels make for a very different risk-reward profile.
One dilemma in the asset allocation drill for the patient and uncertain goes like this:
Question: If you think recession risk is coming and Fed easing will drive the intermediate to long end even lower, why not sit in cash and then quickly redeploy into risky assets? After all, the catalysts for lower rates and Fed easing would typically hit credit spreads and equities.
Question: If you think that 2024 holds great domestic risks (the whole “rise of fascism” thing), even worse geopolitical risks (collapse of Ukraine driven by the House pro-Putin crowd despite the need for winter aid, Iran steps into it in the Israel-Hamas war, China gets more strident on Taiwan, etc.), then those types of reverberating effects would flow into markets. That is, take the 5+% cash and wait.
Those issues are among the usual “what can go wrong” scenarios, but for now risk and the curve both are outperforming in recent weeks. We still vote defensive in our own portfolio.
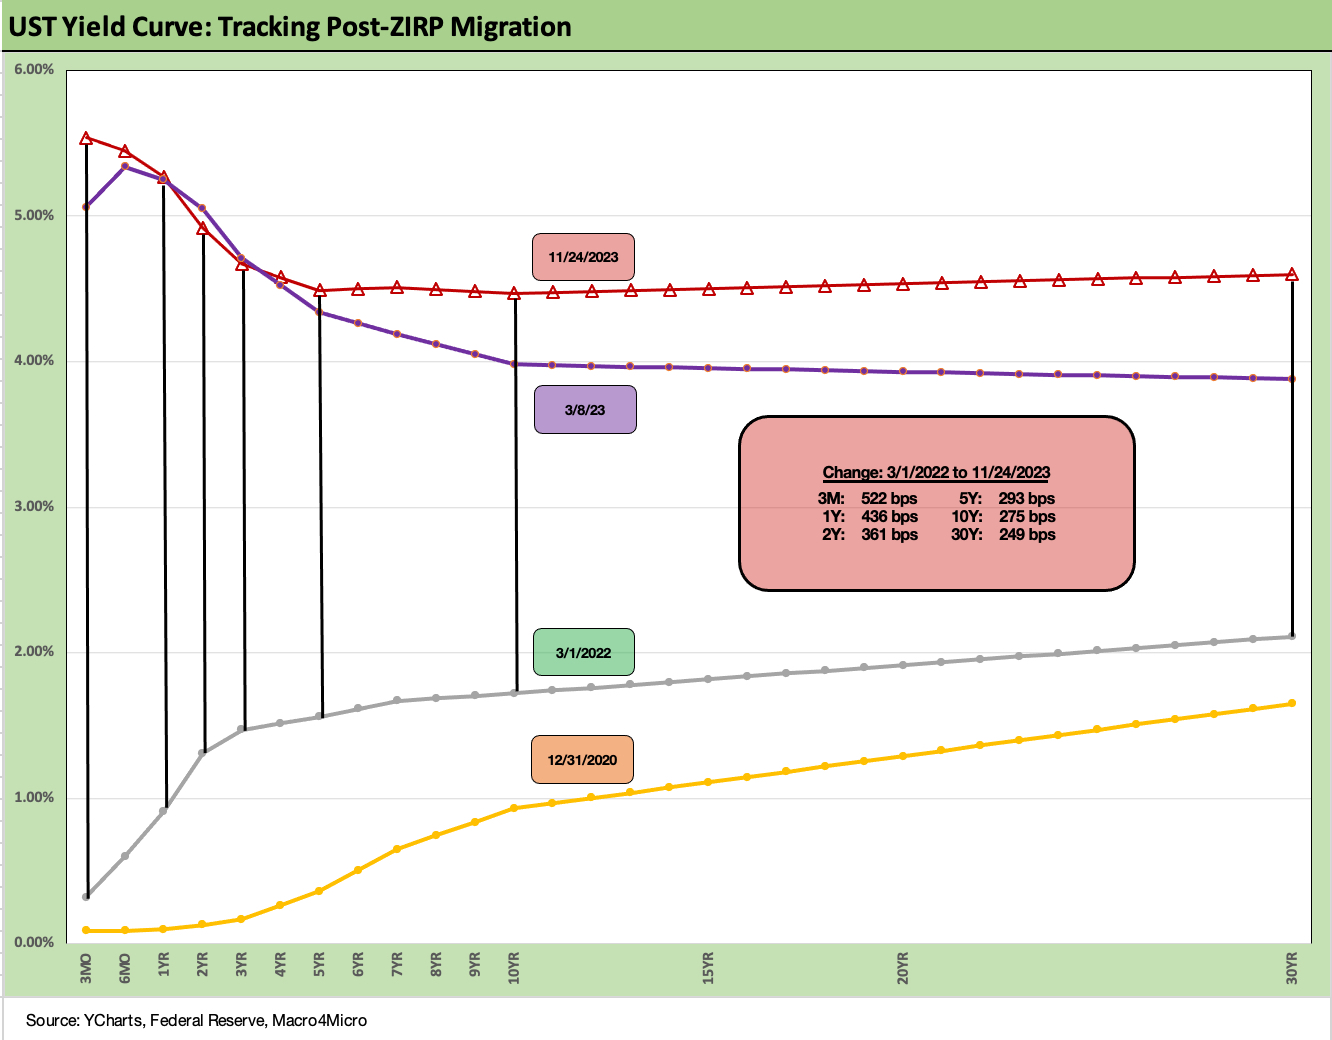
We wrap with our usual final chart that details the post-March 2022 UST curve shift with the deltas broken out in the box. We also include a 12-31-20 UST curve as a frame of reference.
Our view on the UST curve is mostly rooted in the major progress made on inflation but see the recurring worry that the variables in service inflation and payroll trends still leave the UST vulnerable. The risk of steepening toward flattening is not gone as a risk if fundamentals remain balanced. That gets back to one’s frame of reference on flattening (2Y? 5Y?). Many still see the flattening coming from the short end on Fed easing.
Corporate sector fundamentals have been solid enough and guidance out of 3Q23 earning season and the latest set of macro indicators were not overly troubling for the demand side or for jobs despite some pockets of weakness. Betting against US consumers has always been second only to “fighting the Fed” as a bad idea, so we have a hard time getting to a PCE contraction. Meanwhile, the supply pressure to clear the UST market will remain enormous.
In the end, we prefer IG to HY and see defensiveness in the HY mix as the best approach in risk-return for the speculative grade mix. The credit cycle will keep turning, but we also fully respect the historical reality that defaults are a lagging indicator.