Sept New Home Sales: The Need to Live Somewhere
We look at a strong bounce in new home sales in a challenging market.
Strong new home sales stats reflect the favorable demographics and supply-demand profile of the housing sector with builders better positioned to keep picking up market share of total home sales (New + Existing) in a headwind-heavy market facing very strained affordability.
The new home sales numbers were especially strong in the South and West with plenty of homes under construction nationally even if down sharply YoY as builders prudently manage their working capital.
Homes for sale at the end of the month were down by -6.4% YoY (not seasonally adjusted) for Sept with a lower mix in the “under construction” category, a higher relative mix “not started,” and a higher mix of “completed” homes YoY.
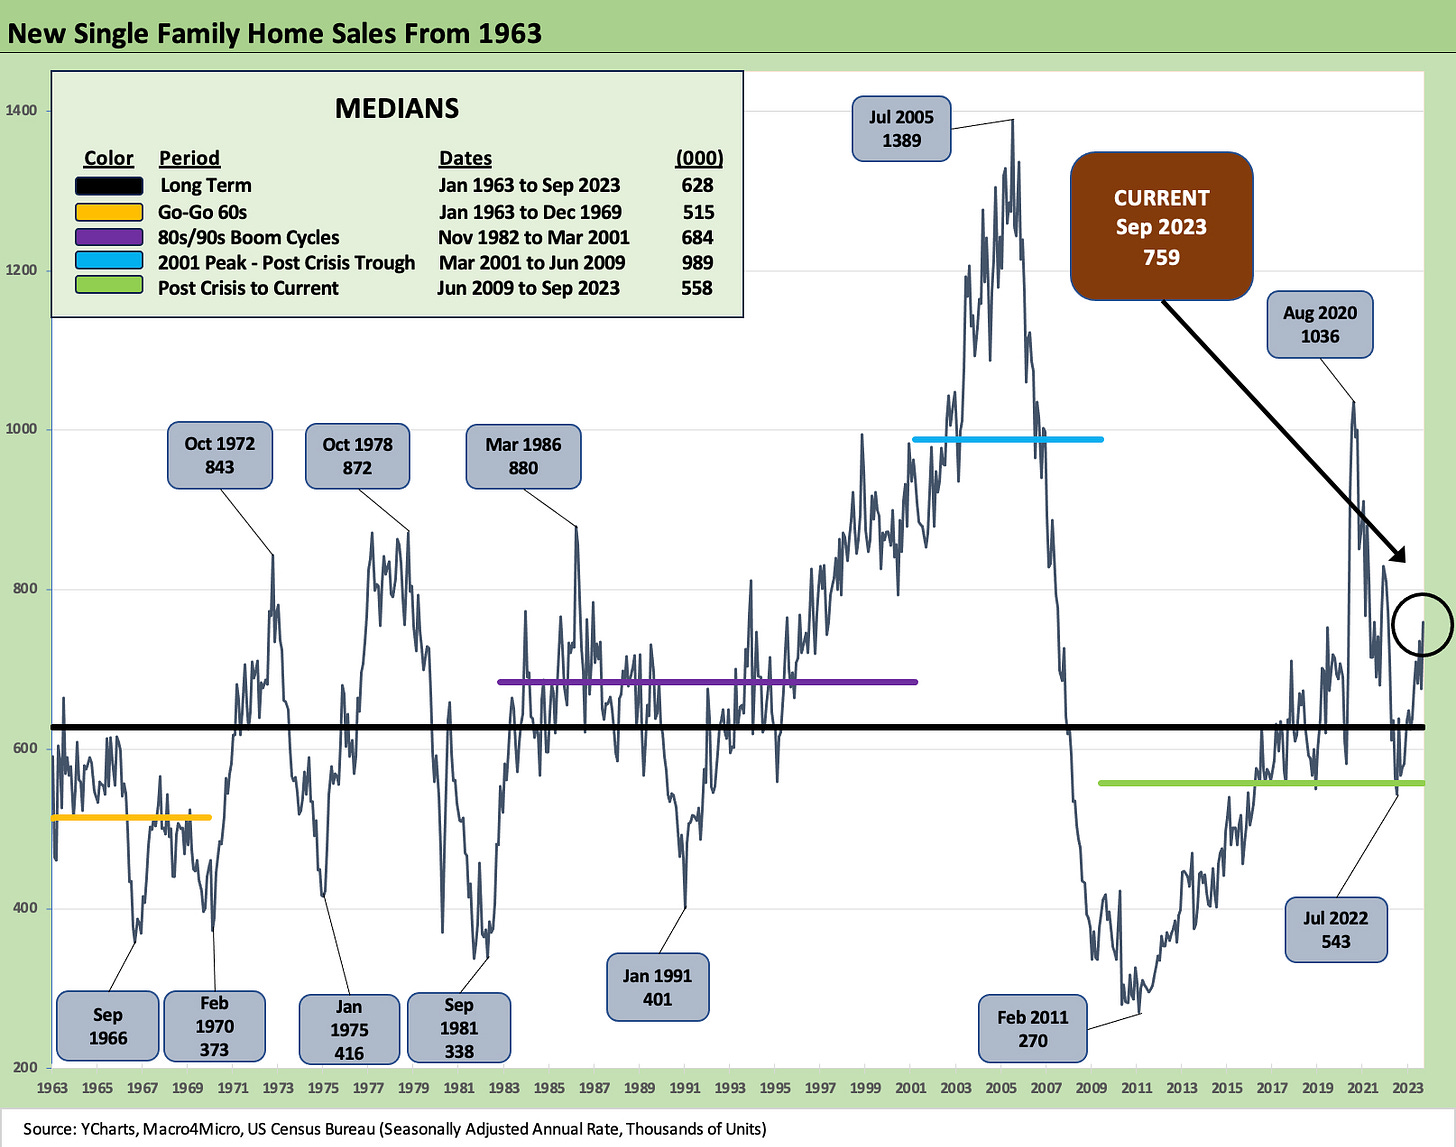
The above chart updates the single family time series from the 1960s. At 759K new home sold, the market is running well above the median as one would expect based on population and the echo boom demand. Volumes are below the “crazy days” median of 2001-2009 when the housing bubble drove the housing sector off the cliff and mortgage credit was available to anyone who had not been dead over 3 hours or was able to fill out a liar loan application. Resale of existing homes for a high price and a new home move-up trade was not a challenge in those days. That rate backdrop was brought to you compliments of Greenspan and his 1% fed funds over 2 years into the expansion.
The September new home sales stats remind everyone that there is a crying needs for housing and, as we see each month, not enough to buy from the existing home stock (see Sept Existing Home Sales: The 7% Solution Running Low 10-19-23). The headline sales increase was +34% YoY in Sept while the median prices declined over -12% to $418.8K from $477.7K. Sequentially, sales were up +12% while median prices were down over -3%. Volumes up, pricing down, YoY inventory down sharply and essentially flat sequentially is the simple summary.
We admit to doing a triple take on the scale of the increase in sales volume for the month. With some major builders entering the earnings reporting stretch this week, we will need to dig in to see more about the price, incentive, and spec strategies across their communities and how those are playing out.
We run through our new home sales chart collection below.
The above chart details the rising share of new home sales as a % of total home sales with the builder share now up to over 19% vs. the long term median of over 12% as noted in the chart. We had seen a spike in June 2020 as broker activity was reeled in by the pandemic and homebuilders often had waivers by state to continue construction.
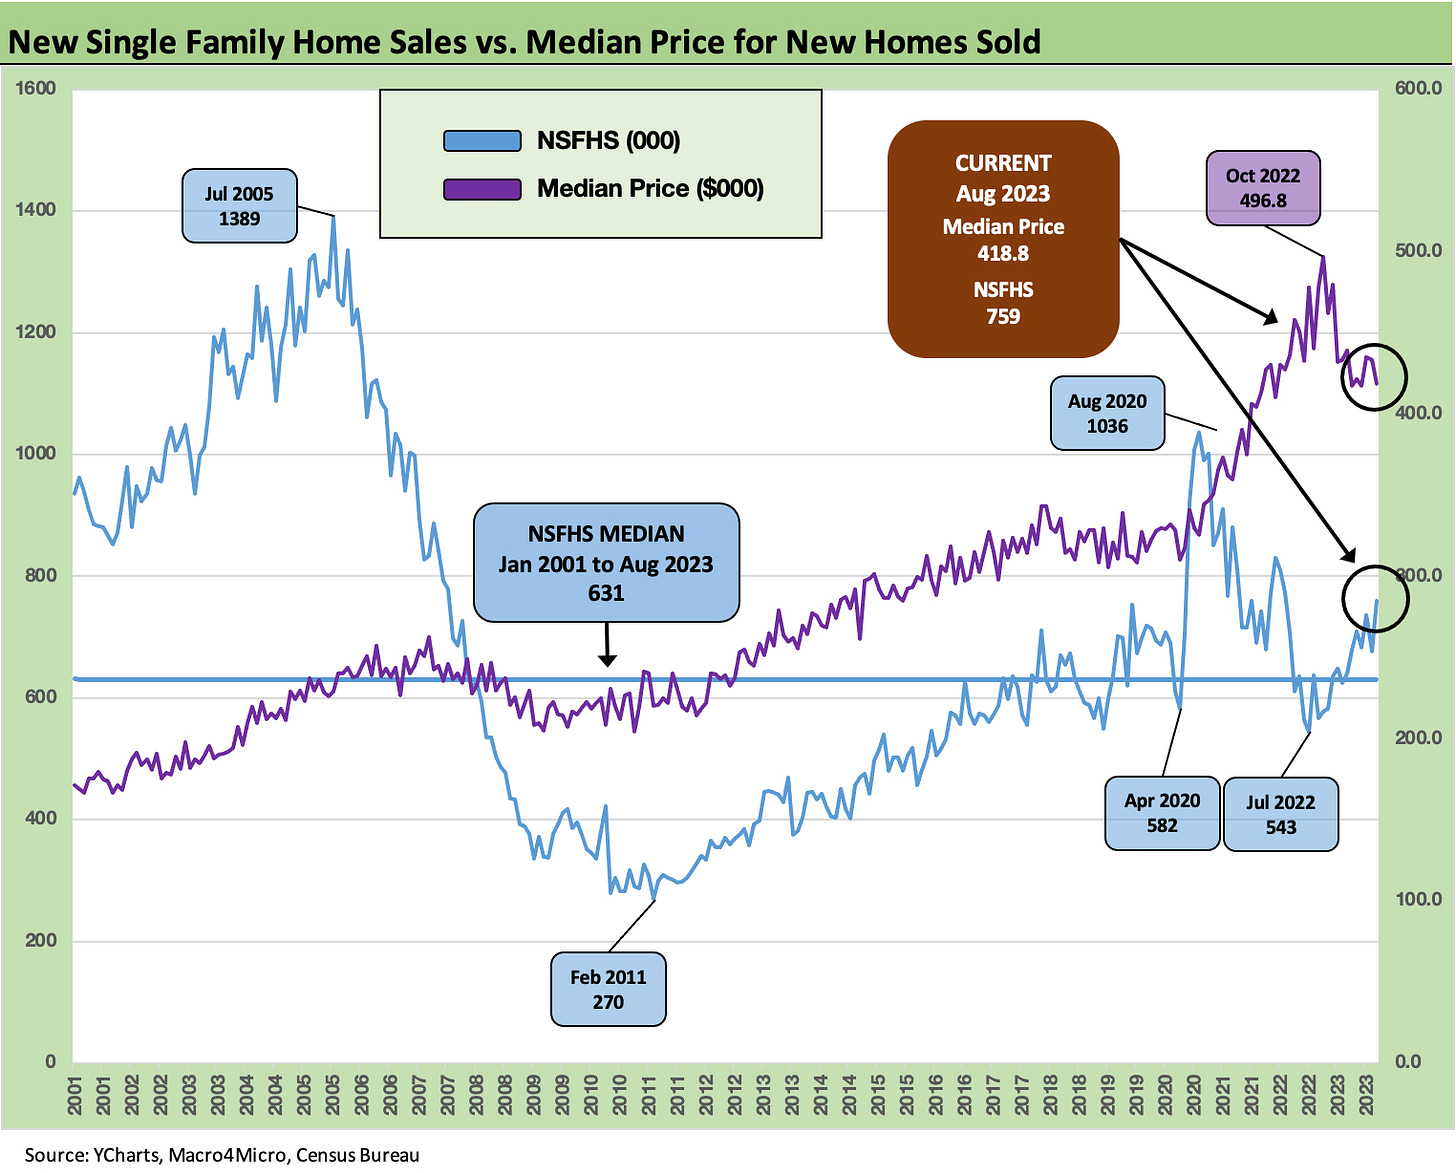
The above chart plots the long-term median sales price trend against total new sales volume. We see the volume lows of Feb 2011 as the housing sector came to a catatonic low for new homes after the earlier collapse in lending activity and home price-plunge also crushed existing home sales in 2008 to 2010.
We also see the post-COVID spike and associated flight to the suburbs. The supplier chain problems and soaring prices brought a mix of effects on the way to the mortgage rate spike. Homebuilder earnings have shown resilience in the face of such wild swings and underscored their ability to navigate challenging conditions and adapt across peak selling seasons and seasonal slowdowns. Prices just kept rising into the tightening cycle until some recent softness that still yield strong builder earnings.
We are now heading into the offseason and the early reports are showing margins and earnings remaining quite healthy. We looked at two of the big names that reported already this week with both Pulte and NVR (2 of the Top 5 in market caps) showing solid earnings and margins. Even where building segment earnings slowed slightly (NVR), there was an offsetting impact in financial services operations as the mortgage banking side of the business showed strong earnings growth. We will be looking at builder earnings separately, but the builders of 2023 are not the builders of 2005-2006 in how they operate.
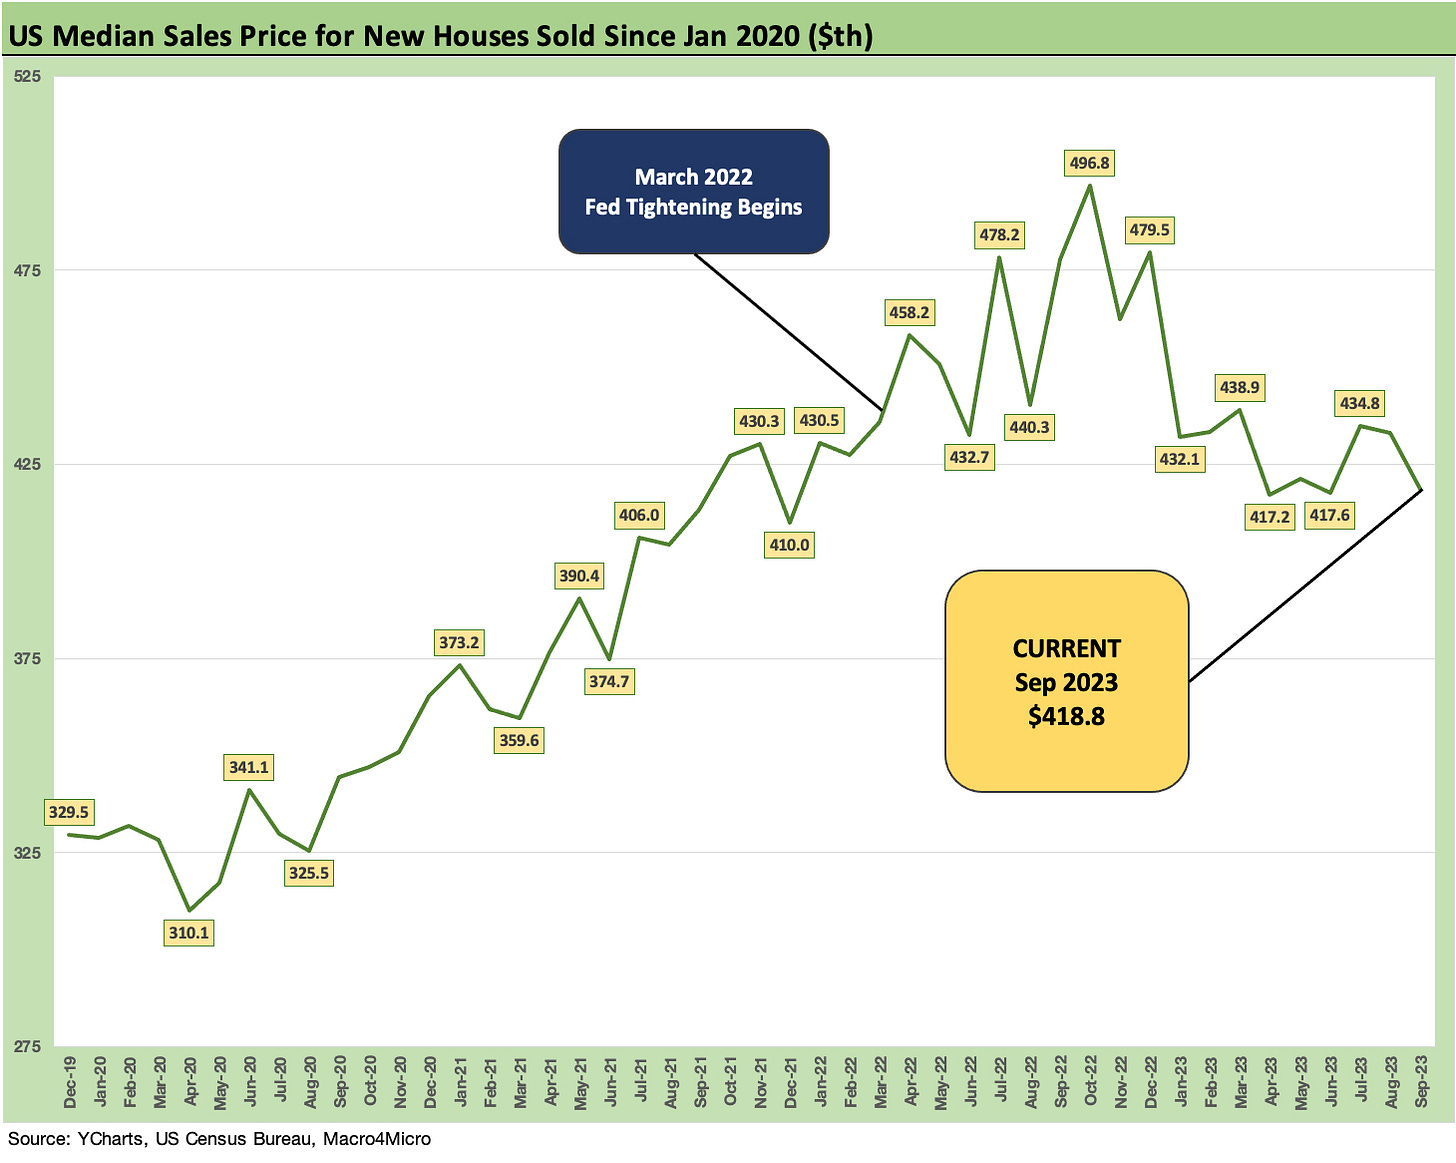
The above chart updates the timeline of median income. We discuss pricing in the next chart, but this one just drives home the upward slope from 2019 and early 2020 more than the bar chart that follows.
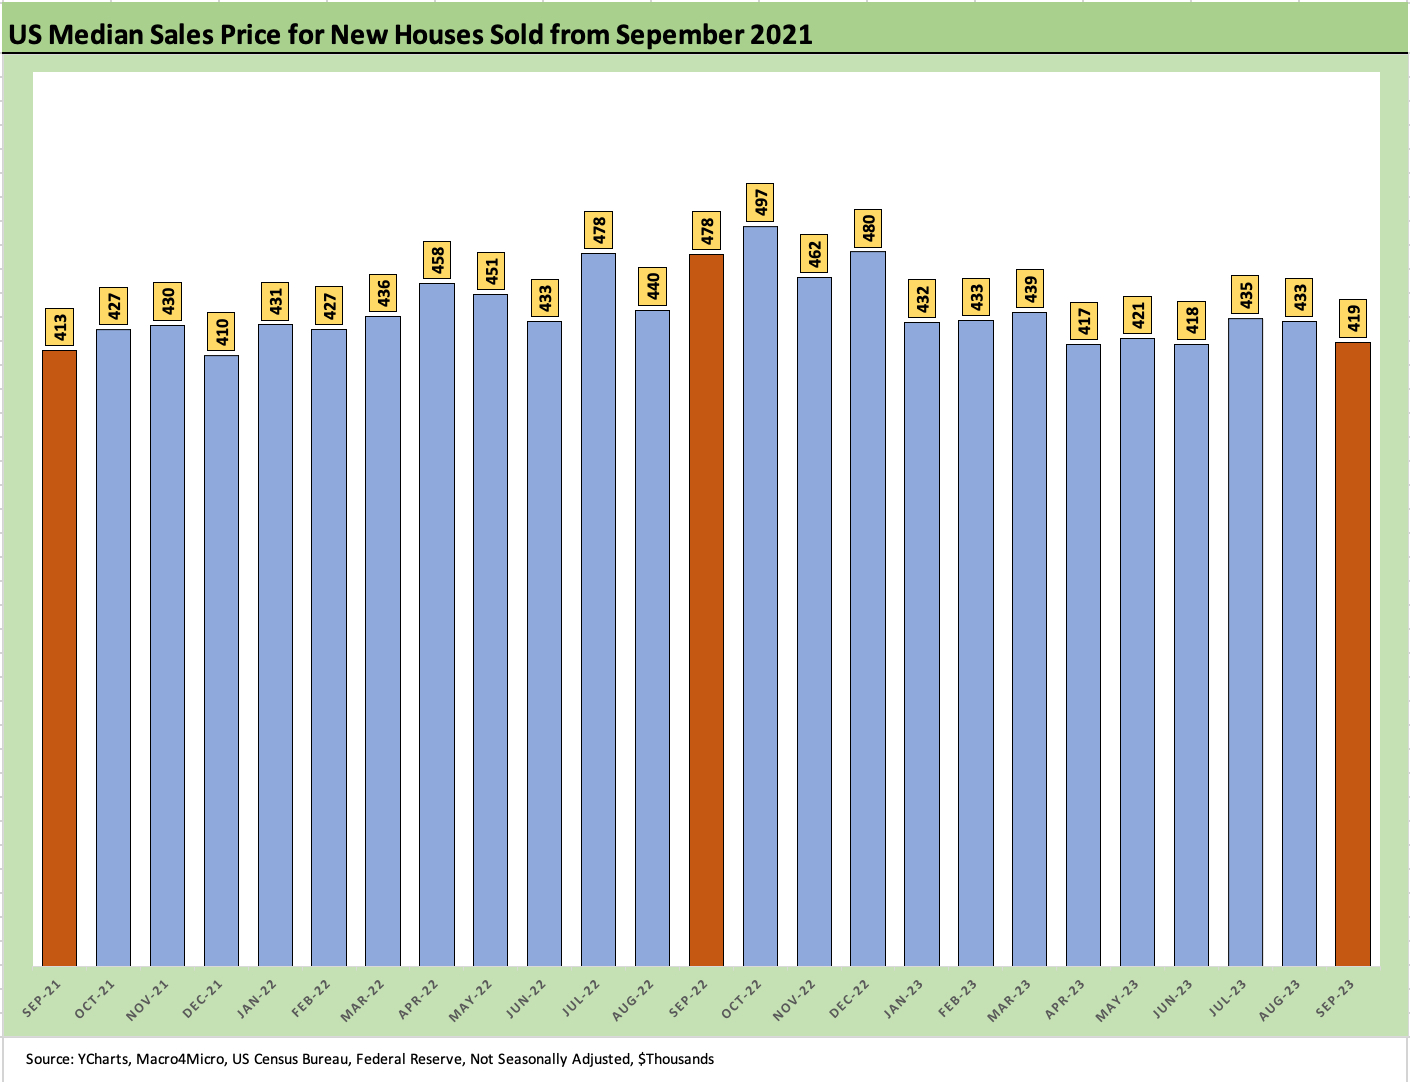
The above chart plots the timeline of median new home sales prices from Sept 2021 to Sept 2023. “Mix” is the recurring asterisk we don’t have to repeat again.
The $419K median price is down sharply YoY from $478K in Sept 2022 and $497K in Oct 2022. The median price in Sept 2023 was also down sequentially from Aug 2023 but slightly above June 2023. Both the South and West were up materially YoY and sequentially, and that can make for a wide range in prices on both sides of the median.
The age-old question in housing is something like portfolio management. How much risk do you want to take? At what price? What are your decision-making priorities?
For housing, the location punchline is an old one (location, location, location), but what that includes is school system, commute, safety, possible threats to home equity value, and the gut emotional feel (note the solitude and the view in the picture at the top).
The reality of financial risk and how much you can afford dovetails with the decision of “How much house can your dollar buy?” and the sub-topics that go with that including downpayment decisions, the ability to refinance over the intermediate term, and sometimes the ability to pay cash and make a decision later on a mortgage in a friendlier interest rate backdrop.
The much-discussed “golden handcuffs” problem (60% of mortgage holders with less than 4% rates, etc.) can be addressed with the same discussion around downpayments and refinancing. The rise of single-family rentals and changes in zoning rules (more multifamily options) has expanded the geographic range of the “lease vs. buy” decision and has changed the rules of the game in many metro areas as the many cranes and building projects in places like Seattle will attest.
See also:
Footnotes & Flashbacks: The State of Yields 10-21-23
Sept Existing Home Sales: The 7% Solution Running Low 10-19-23
Housing: Starts, Completions Firm Sequentially, Permits Down 10-18-23


