
Industrial Production: Pit Stop or Tapping Brakes?
We look at Oct 2023 Capacity Utilization across industry and manufacturing.


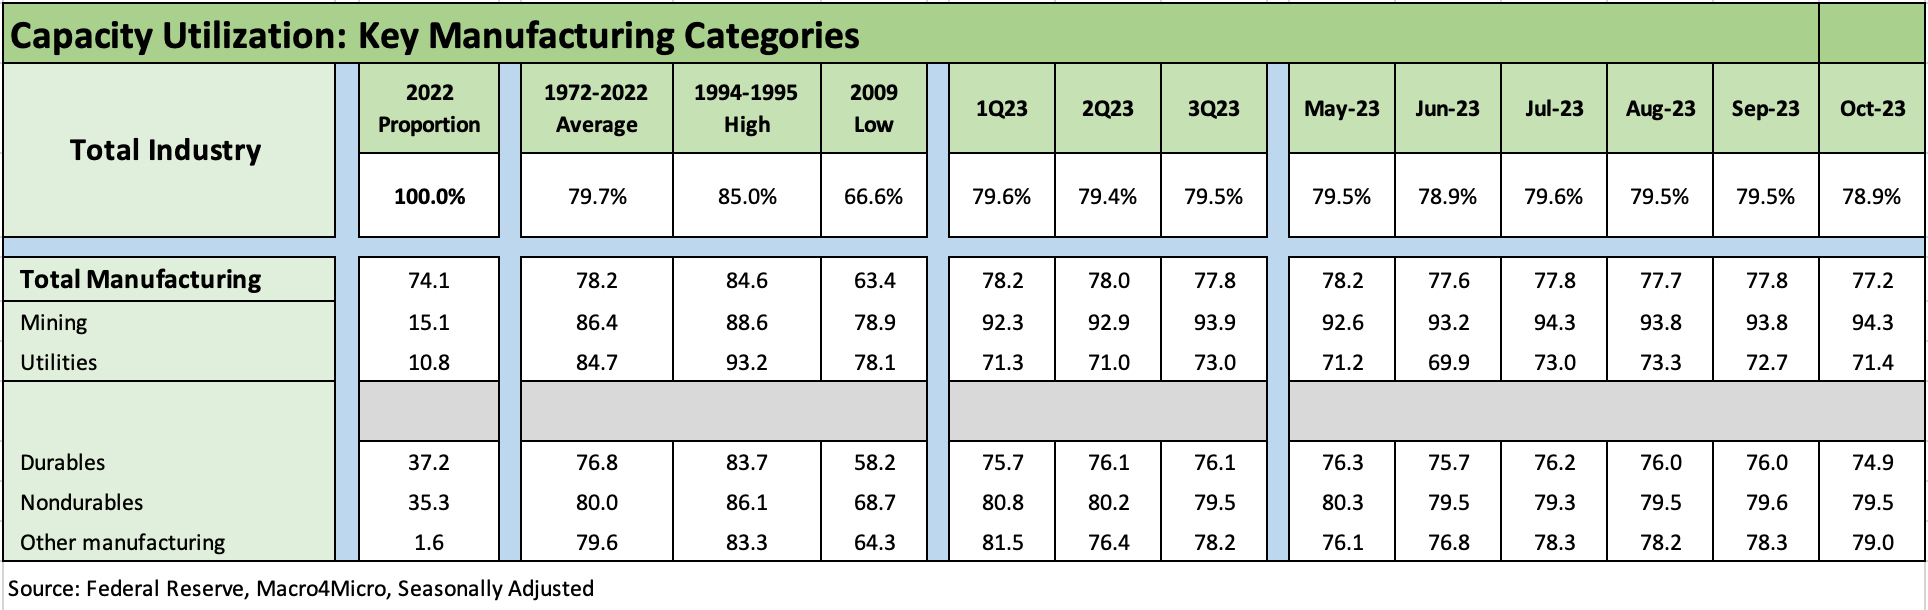
Manufacturing capacity utilization is telling a tale of diminished pricing power at recent lows and still running modestly below long-term averages as capacity utilization for Total Manufacturing hit the lowest level since Dec 2022 when it hit 77.1% vs. the current 77.2%.
Some October softening in manufacturing can be tied in part to the automotive supplier-to-OEM chain with a manageable and limited decline ahead of the UAW deal.
Capacity utilization declines exceeded increases with Aerospace, Computer and Electronics Products, and Mining higher but overall Durables and Nondurables lower.
In the charts herein, we tick off the trend line in capacity utilization from the industrial production data released this morning by the Fed in its monthly G.17 release.
We see softening numbers but at still very manageable run rates given the lower break-even volumes we have seen across so many industries in the post-crisis years after all the restructuring and efficiency actions taken from rationalization of capacity to enhanced automation and productivity measures.
The mix of headline categories above shows most lines declined including Total Industry, Total Manufacturing, Durables, Nondurables, and Utilities. Mining was higher as was the small category of “Other Manufacturing.”
How the inflationary forces and heightened capex in many industries will flow into theoretical breakeven volumes in critical industries such as the auto sector will be something hashed out and hopefully clarified by manufacturers with fiscal year end disclosure and commentary. As an example, autos now have the combination of higher capex to go along with much higher wages and more full time employees and pension benefits.
As a reminder, we like to assemble the capacity utilization data (“cap ute”) rather than the industrial production statistics in these two charts since cap ute is a more intuitive leap to where pricing power is strong or might be fading as we move into the cyclical crossroads ahead.
With tariffs still the new reality and more likely to go higher (or broader in targeting) than lower in the future (regardless of the Xi visit), the onshoring and reshoring themes are not going away, and that will mean higher unit costs over time.
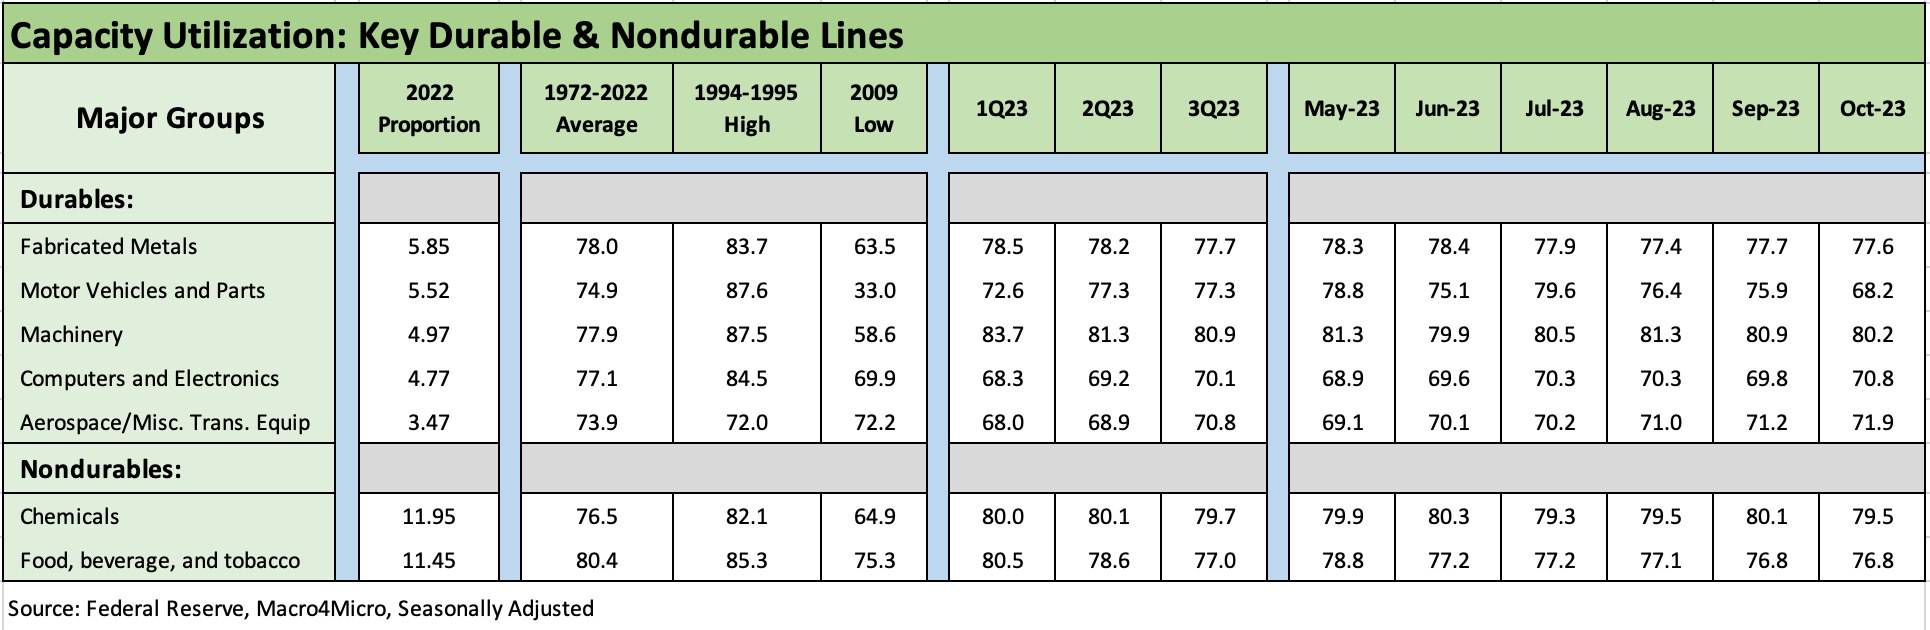
The above chart shows the leading industry groups with Durables and Nondurables with the related timeline on capacity utilization. We see 3 of 5 lower with Computers/Electronics higher and Aerospace higher. The Motor vehicle line averted disaster despite the strike given the partial, targeted strategy that both kept the Detroit 3 way off balance and minimized disruption to the rank-and-file members’ lives while mitigating strike fund drain. Ex-autos, Total Manufacturing ex-autos/parts saw the industrial production index rise very slightly.
The UAW combined a masterful strategy and hard-hitting social media campaign to win big. They used an effective mix of fairness themes without over-seasoning the red meat with too much reliance on class warfare attacks. They could give lessons in Washington to the Democrats. With only 6% of the private sector labor force unionized, small victories came in the form of a record UAW contract without blowing up this month’s Industrial Production stats.
On the flip side, the Detroit 3 now return to embedded unit cost disadvantage at the consolidated level and narrowly in the EV transition operations that have been seeing massive losses, flagging demand, and price battles across the OEMs for market share.
Unit costs, capacity utilization, inflation, and margin threats…
The unit cost question marks for US industry tie into a lot of factors from materials and energy to components purchased both onshore and offshore. Labor and benefits are major factors as the headlines have been blaring across 2023 with freight and logistics, airlines, and more recently the automotive chain and the UAW home run contract grabbing so much attention. Supply and demand still rule the roost in pricing power, and the capacity utilization stat is a sibling of supply and demand.
The ability and need to pass through the rising costs can be tied into the direct increases in costs and the volume trends as lower volumes translate into higher unit costs (volume as the denominator). Price and mix all get tossed into the chowder in the breakeven volume recipe. Where trends in the UST curve flow into the relative dollar strength/weakness is another variable in 2024 for unit costs across both domestic and global supplier chain sources.
Overall, the trend line in cap ute tells a modestly negative margin story but the commodities, energy, and raw materials line is always going to be a volatile piece of the puzzle as history has shown. Labor seems to be going one way – higher – while energy has cyclical demand and OPEC policies as wildcards. Metals has China as a major X-factor.
This week’s PPI provided more supportive data points that showed inflation getting reeled in, and that was a mitigating factor for those who are seeing some fade in cap ute. The picture remains mixed, but the combination of Retail Sales and Industrial Production was constructive overall for UST curve watchers and those suffering from FOMC neuroses.