
Housing Starts Oct 2023: Back in the Game Coach?
Housing starts data add a little more to the good news streak for builders, but rates have a long way to go for existing home sales.


A constructive starts trend for October, as builders enter the off season, will still beg the question around how much the recent UST curve could restart the game clock in coming periods.
We see starts and permits up slightly sequentially but both modestly down YoY as many builders closely manage their working capital with more builders using spec builds and inventory in process across this wild tightening cycle.
The goal for many builders has been to have houses move-in ready or in-process as builders pick up market share of total home sales in 2023.
Multifamily (5+ units) sees permits tick up slightly sequentially but down big YoY, starts also up modestly sequentially but down -32% YoY, and 5+ units under construction off the summer 2023 highs but still higher YoY.
The exercise in watching the macro trend line in the important homebuilder sector with its GDP multiplier effects is about framing how the industry approaches its working capital management (new home sales vs. starts, permits, and community count plans). The same is true when framing the operating and credit risks of a builder.
For now, the builders remain in the catbird seat with existing home sales in the tank but still hoping to climb out with mortgage rates declining. The challenge for the 3% handle mortgage holder is that mortgages will still need to decline a lot more (!) to unlock the golden handcuffs (see Sept Existing Home Sales: The 7% Solution Running Low 10-19-23). In contrast, builders have mortgage buydown tools at their disposal, and they can be competitive on the way down to offer the buyer attractive choices. In other words, inventory will remain tight.
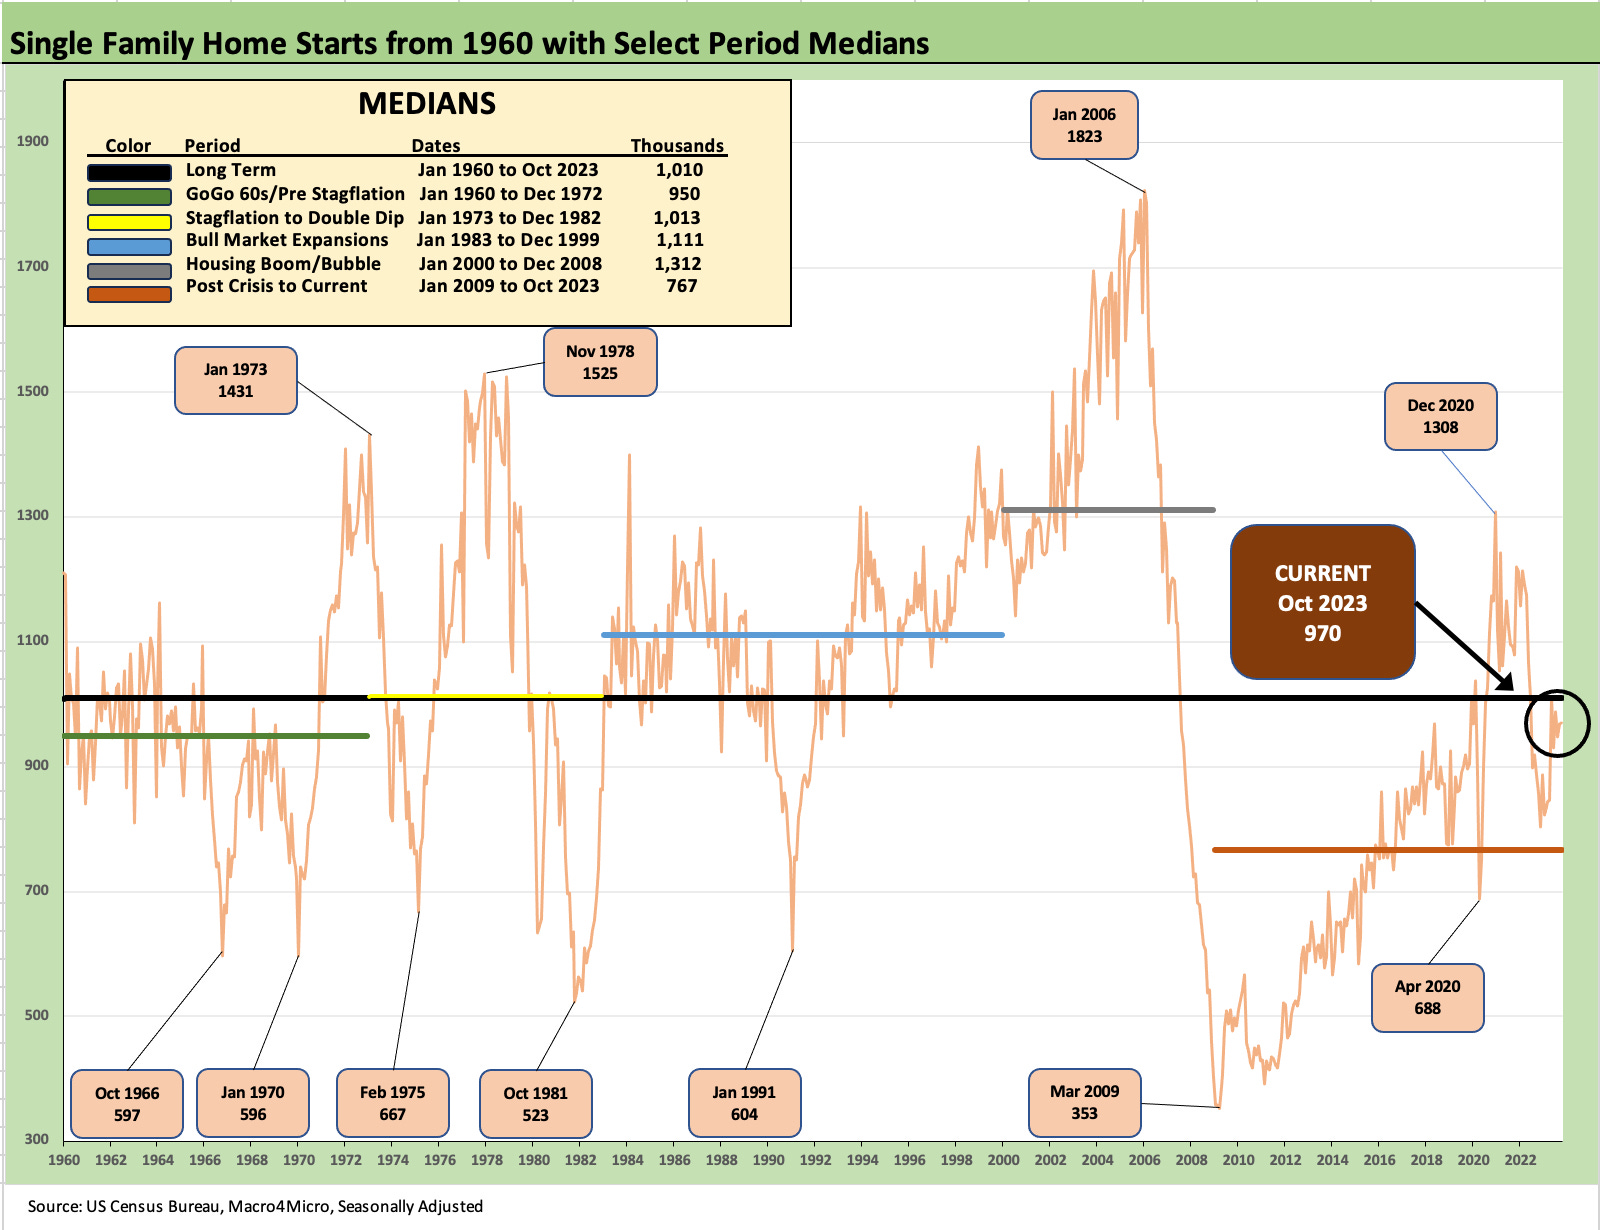
The chart shows starts not too far below the median in the time series, but the demographic differences of “now vs. then” call for start rates to be much higher to meet the needs. That supply-demand imbalance is keeping prices firm across the markets.
The ability of builders to profitably build and sell homes at the current price levels even net of buydowns/incentives with sub-6% rates offered tells of a very good story about the health of the new residential construction markets and the financial strength of the builders.
The balancing act of permits, starts, houses under construction, housing units completed and then sold is part of the monthly macro release drill across the Census data and the NAR on the existing home sales side.
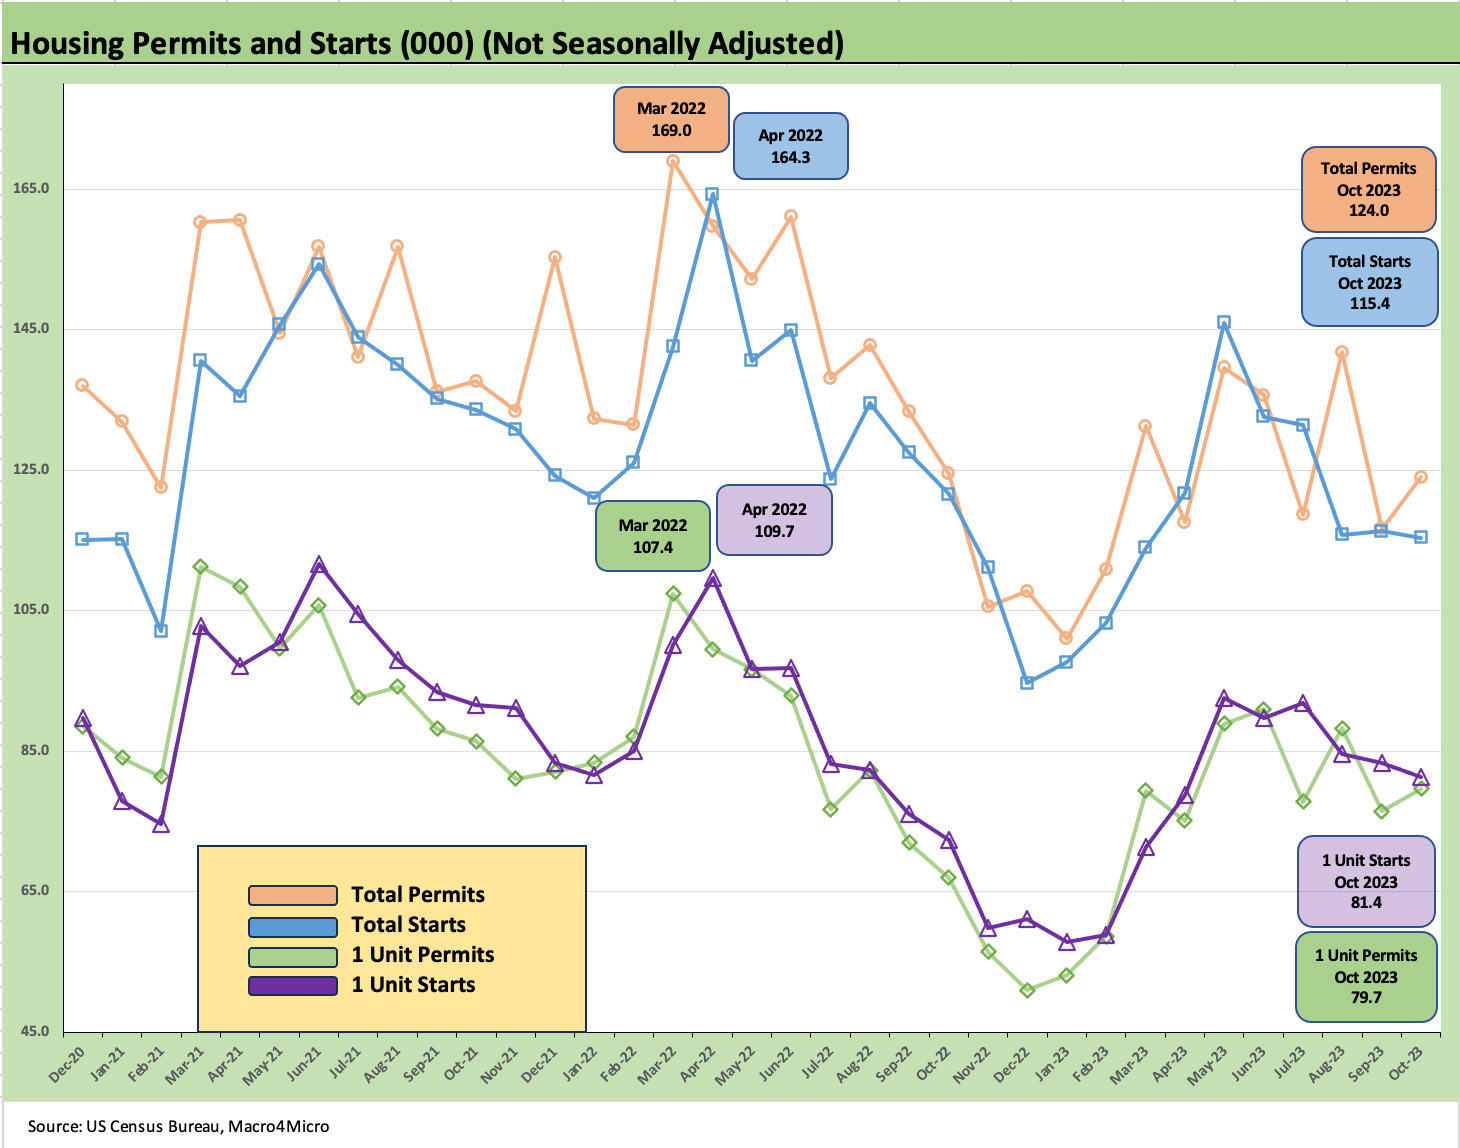
The chart above plots total permits vs total starts and the 1 unit starts and permits. The single family tracking is prudent and rational and does not show excess. The inventory metrics can be tracked during earnings and financial reporting season but also by watching completions and “under construction” data along with the monthly inventory data releases with new home sales. There is a reason the builder stocks are flying, and the UST shift lately fueled some more optimism.
The earnings release conference calls from management teams speak to how they plan the pace of starts and new community guidance vs. closings, orders, and backlogs they post each quarter. After listening/reading many of these discussions across the tightening cycle, the operating strategies are very reassuring that the management teams move deliberately and soundly. This is sure not 2005 whether by strategy or by lender behavior.
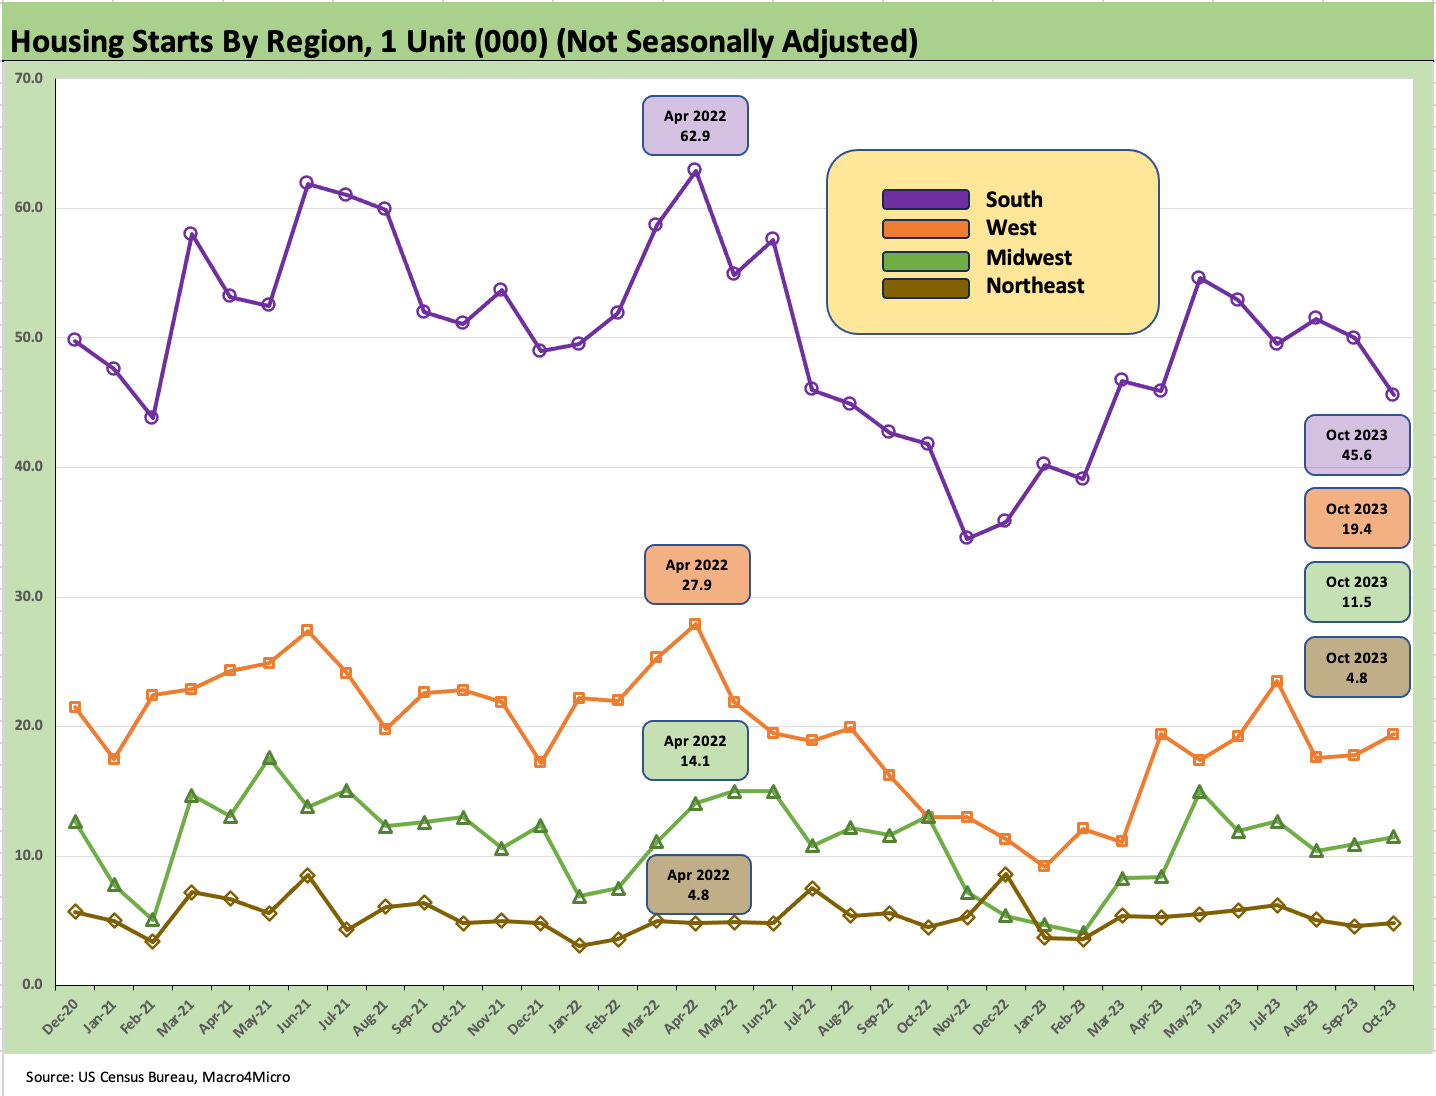
The above chart breaks out the start trend line by region. We use “not seasonally adjusted” data to better match the activity on the ground. Total 1-unit starts are running near the lowest levels since the early spring. The regions are mixed, but the critical South region was down on a sequential basis to the lowest level since early spring. The West, Midwest, and Northeast ticked higher.
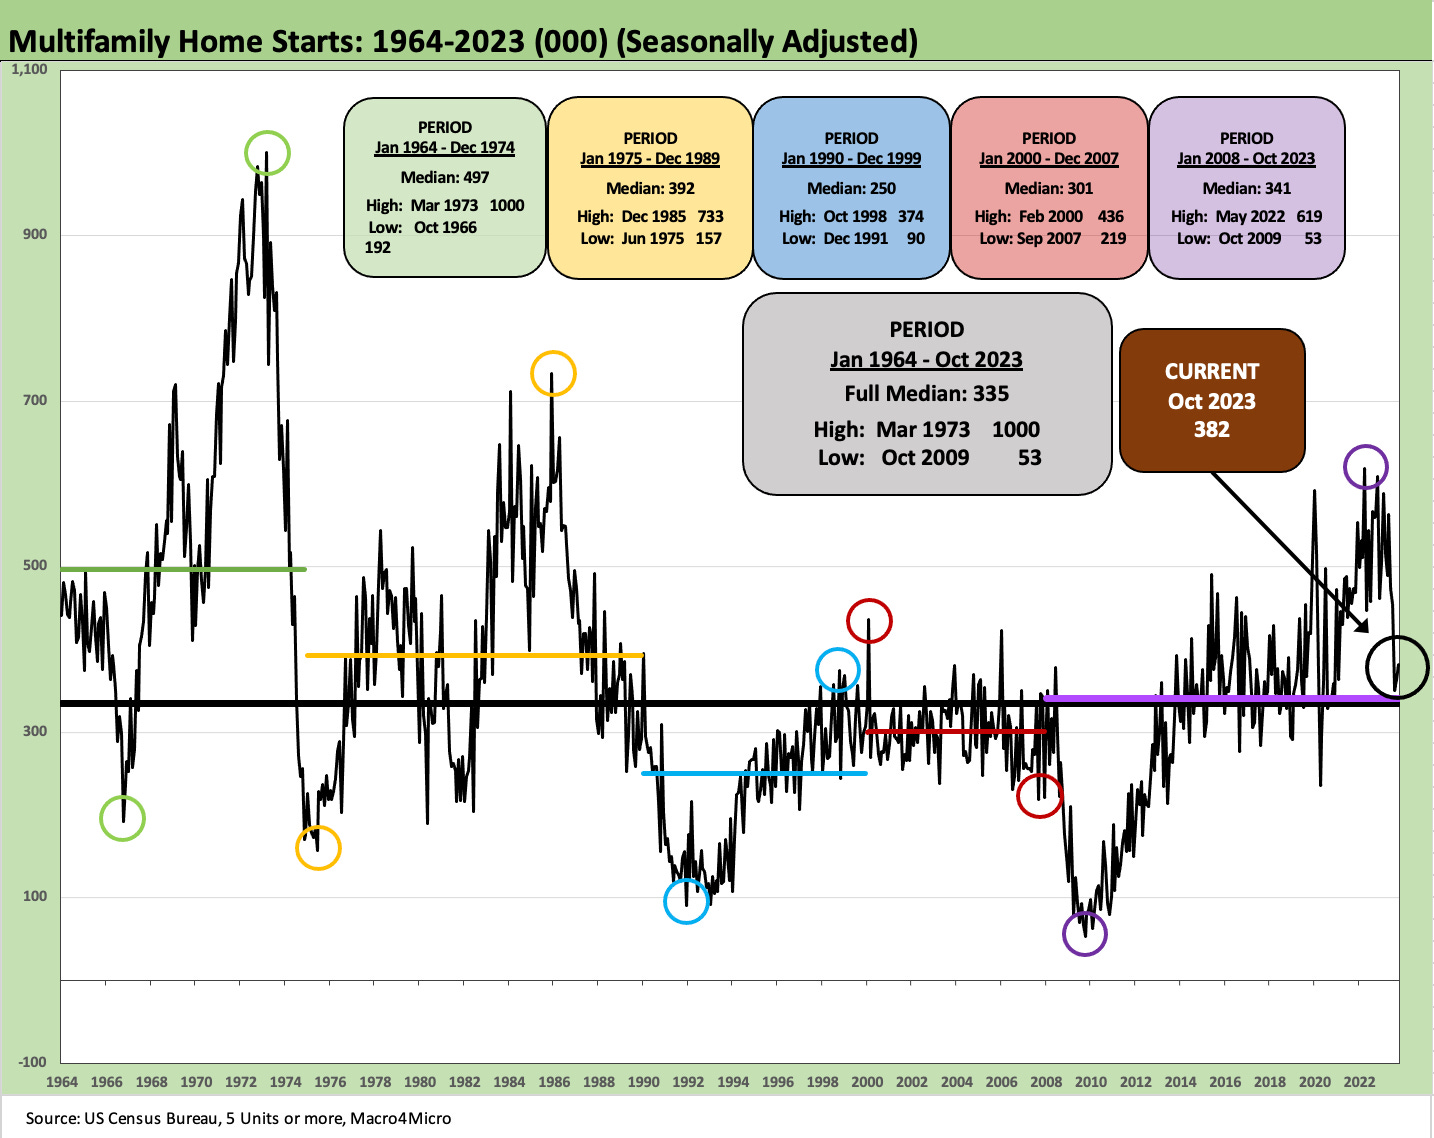
The above chart shows multifamily housing unit starts sharply lower YoY by -31.8% on a SAAR basis but up +4.9% sequentially. On a “not seasonally adjusted” basis, the numbers were also higher sequentially and “down big” YoY. That trend is consistent with recent patterns and the high volume of multifamily supply recently online or coming online.
The 5+ units numbers on a SAAR basis remain high even if below the July-Aug 2023 peaks. On a YoY basis, multifamily units “under construction” are +8.3% with so much activity stoked up across 2023. Multifamily units “completed” remain high in 2023 and are up +14.3% YoY Oct 2023 with “not seasonally adjusted” at +23.6% YTD Oct 2023 vs. YTD Oct 2022.

The above chart shows multifamily permits running much weaker YoY (-27.8%) but remaining resilient sequentially (+2.2%) even if well below the 500K handles mostly seen in 1H23. On a not seasonally adjusted basis, Oct 2023 was near the lower of the last 12 months with April 2023, July 2023, and Sept 2023 slightly lower.
The overall picture for housing calls for steady optimism around the builders of single family units. For those watching shelter inflation and how it rolls up into CPI, the supply of multifamily bodes well for the lagging shelter inflation numbers tied to rental rates and “Owners’ Equivalent Rent” to keep moving in a favorable direction for the economy (lower) even if not for the economics of multifamily projects.