
October Jobs: Market Ponders the Enigma in the Puzzle
A busy month of moving parts in jobs brings a market relief rally.


The record high in the absolute payroll numbers plus some downward revisions help rally a market looking for anything that is less frothy.
The 3.9% unemployment rate ticked up slightly from 3.8%, average hourly earnings rose by +4.1%, and payroll revisions for August saw a reduction of -62K (to +165K from +227K) and Sept saw a reduction of -39K (to +297+ vs. earlier +336K).
Record payroll with a rally in UST is a sign of how much the market wanted relief from above-consensus numbers, and this was something to grasp.
We run through our jobs chart collection and break out the deltas and jobs changes LTM and since Jan 2020 in a series of tables as payrolls climb across so many occupation buckets.
The employment numbers these days are used as a proxy for what Powell and the FOMC might be feeling and what the employment trends might mean for wage inflation and how that flows downstream to finished goods and the pricing of services.
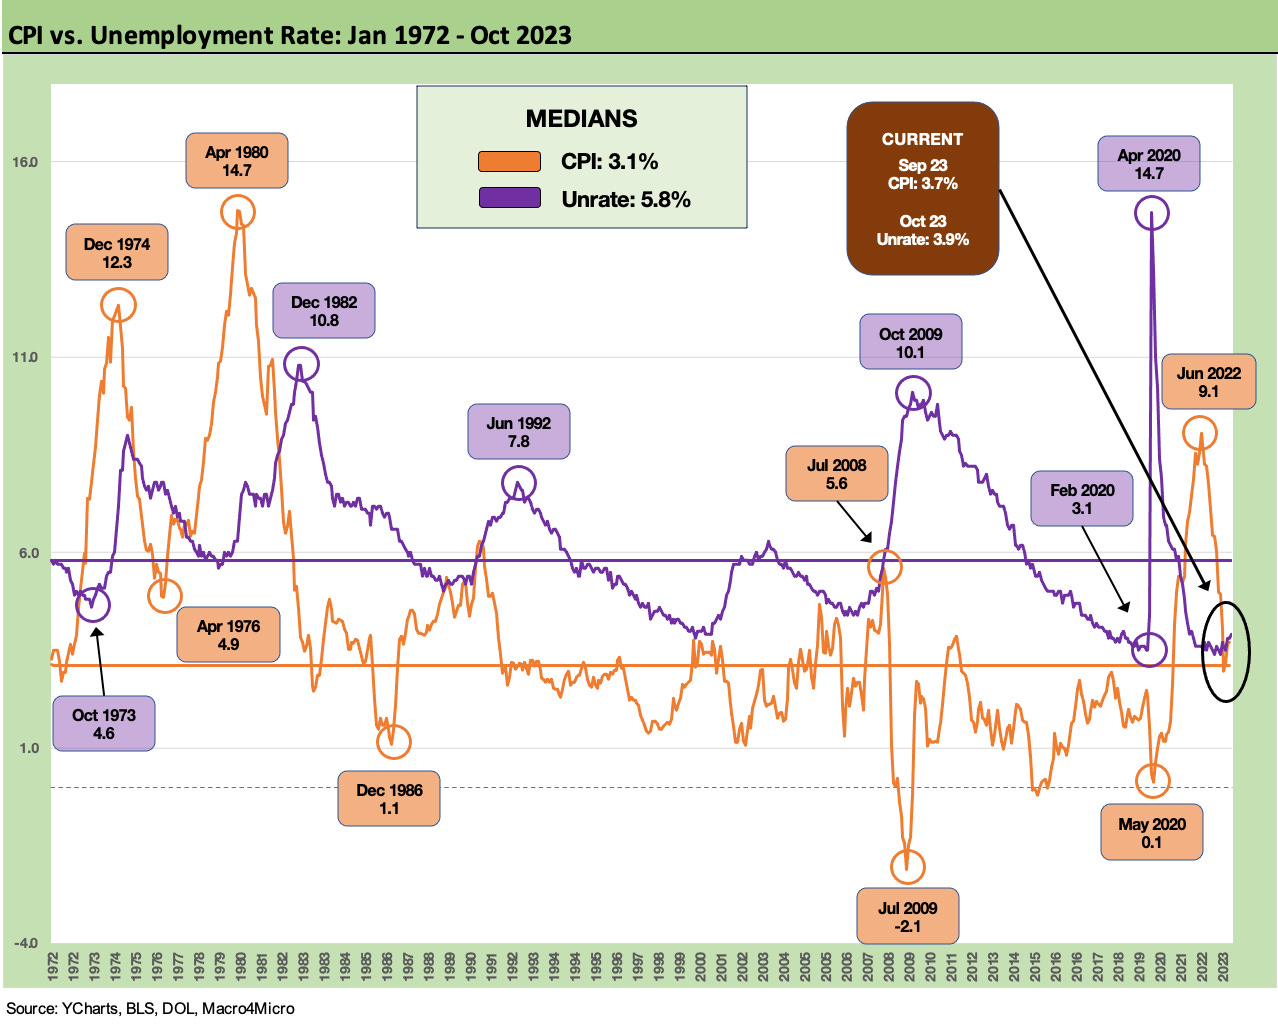
The pricing of labor and commodities and food all play into each other. Those connections gave rise to the phrase “wage price spiral” we heard so often in the 1970s and again in the early 1980s. When Volcker showed up with Thor’s hammer and Zeus’s bolt looking for things to smite, his initial aim was aggregate money supply control with the likely side effect of punitive rates (see UST Moves 1978-1982: The Inflation and Stagflation Years 10-18-23 ). It worked.
The above chart offers a reminder of what CPI and Unemployment look like across the cycles. While it is out of style now, the Misery Index is the sum of the two. We hit a peak of 22% in June 1980. The current 7.6% for Oct 2023 is not exactly a war story. The latest inflation and monetary policy cycle saw a peak Misery Index in June 2022 of 12.9% that went down quickly. The Energy CPI component of +41.6% in June 2022 was a bell ringer, but the US was in a very different position in energy in 2022 than 1974 and 1980.
We looked at Job Openings this week already (see Sept 2023 JOLTS: The World is Flat for Now 11-1-23), and the trends are steady and solid (reminder: JOLTS reports at a 1-month lag). After last month’s +336K jobs (revised down to +297K), the world started to get rattled about not making it out of 2023 without another hike. That optimism around a “pause with hawkish language” seems to prevail right now.
The FOMC gave the usual short-but-tall summary this past week, but the numbers have been balanced enough and the UST curve has rallied today in what seemed more relief than substance since a 4% wage handle was in the release and labor pricing power was proven in dramatic fashion by the UAW.
Overall, CPI has been constructive and especially if you put an asterisk on the quality of the CPI shelter numbers (see September CPI: Big 5 Buckets and Add-Ons 10-12-23). The PCE numbers have been mixed and consumption remains strong, which is supposed to keep the “no recession” school in the lead (see PCE Sept 2023: Consumption Strong, Inflation Steady 10-27-23).
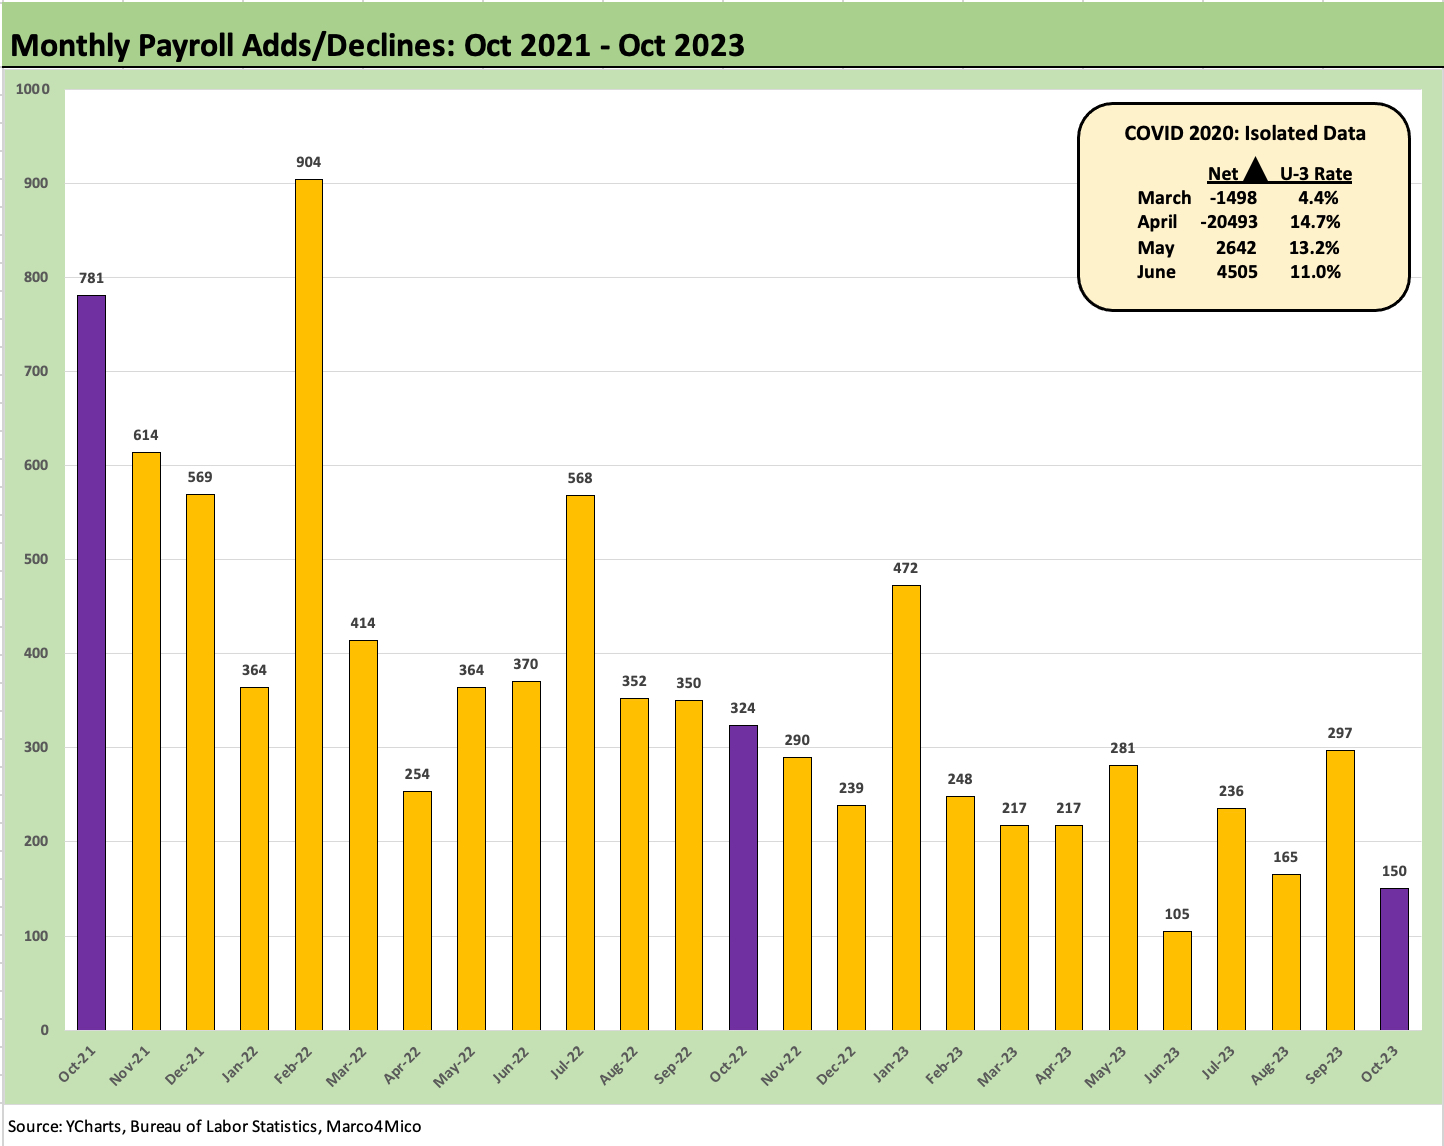
The payroll adds (including the Aug and Sept revisions) are posted above, and the +150K is on the low end of the 2023 numbers at second lowest and lower than all of 2022. That leaves Goldilocks somewhat less sullied but still subject to rumors.
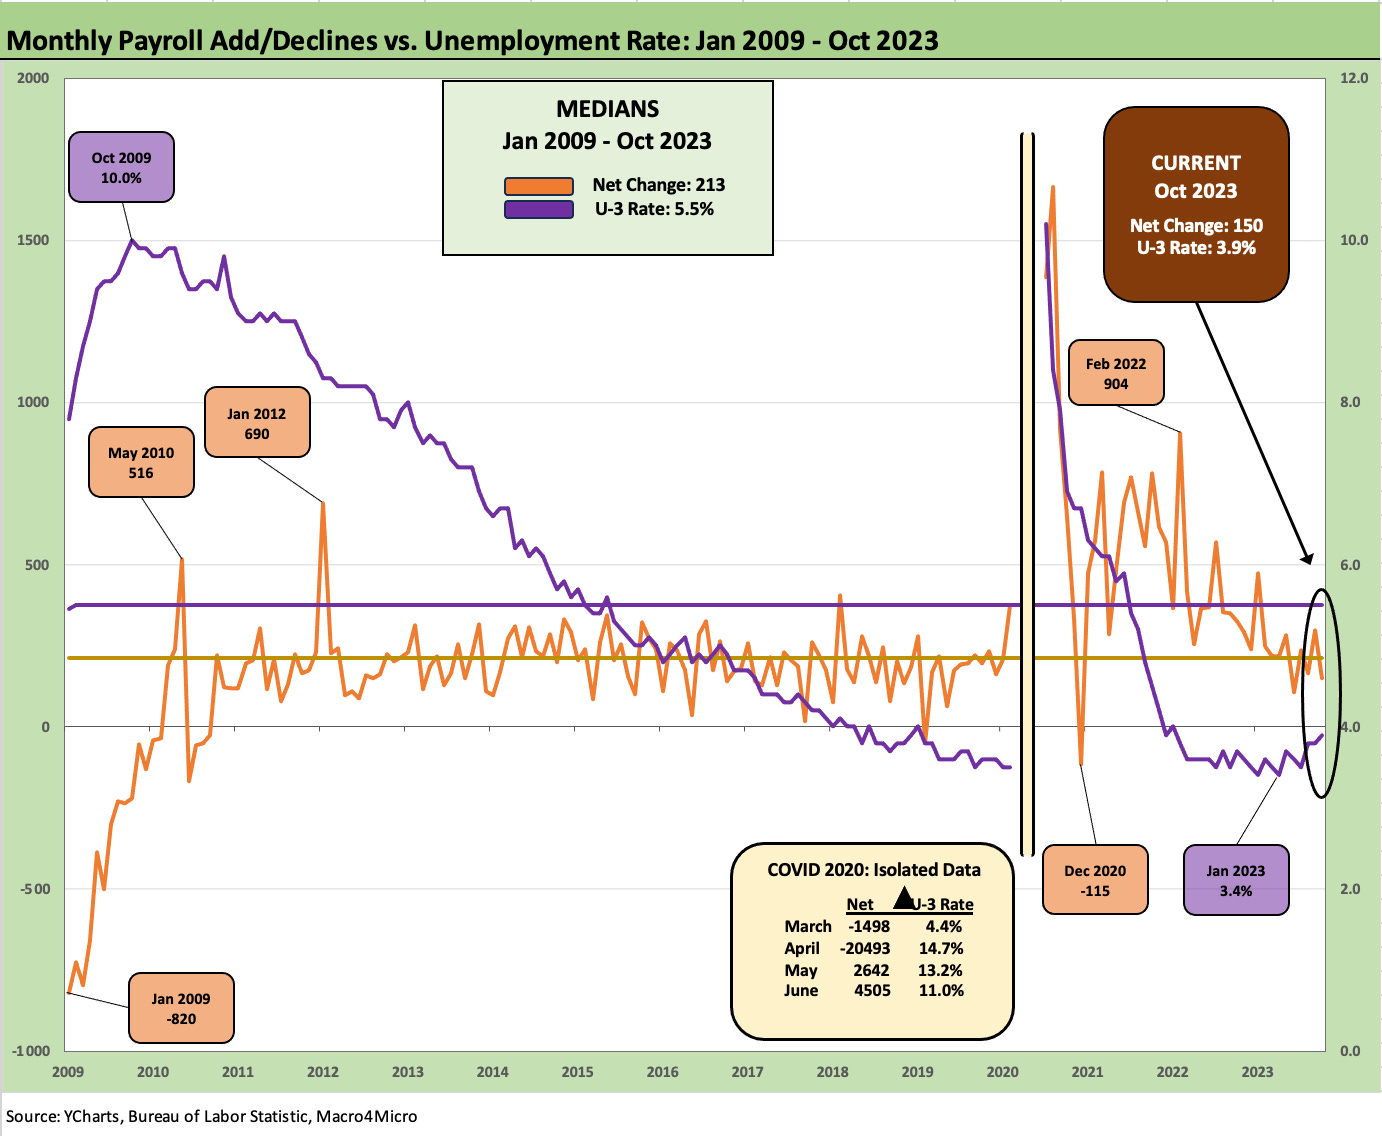
From a slightly different vantage point, this plots the adds/declines and unemployment rates from Jan 2009, when the world was on fire. We see a median unemployment rate of 5.5% and median job adds of +213K. That puts the current +150K below median but arguably enough to keep up with demographic demands. We detail the COVID craziness for March 2020 to June 2020 in the box to avoid blowing up the chart optics.
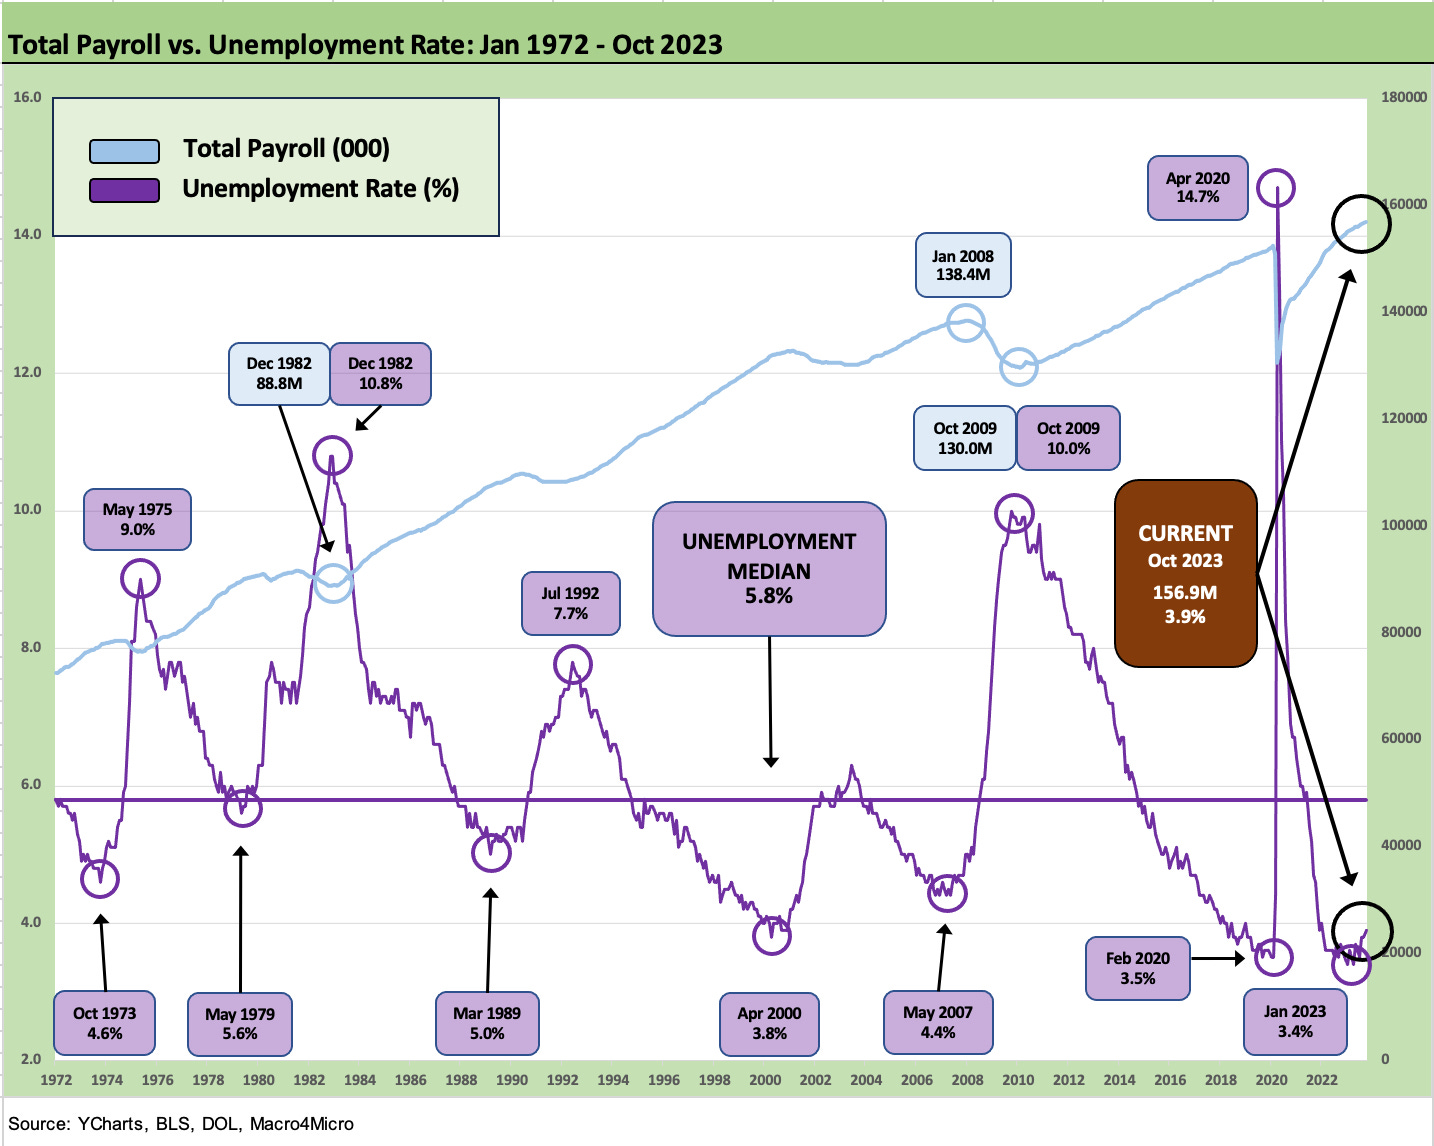
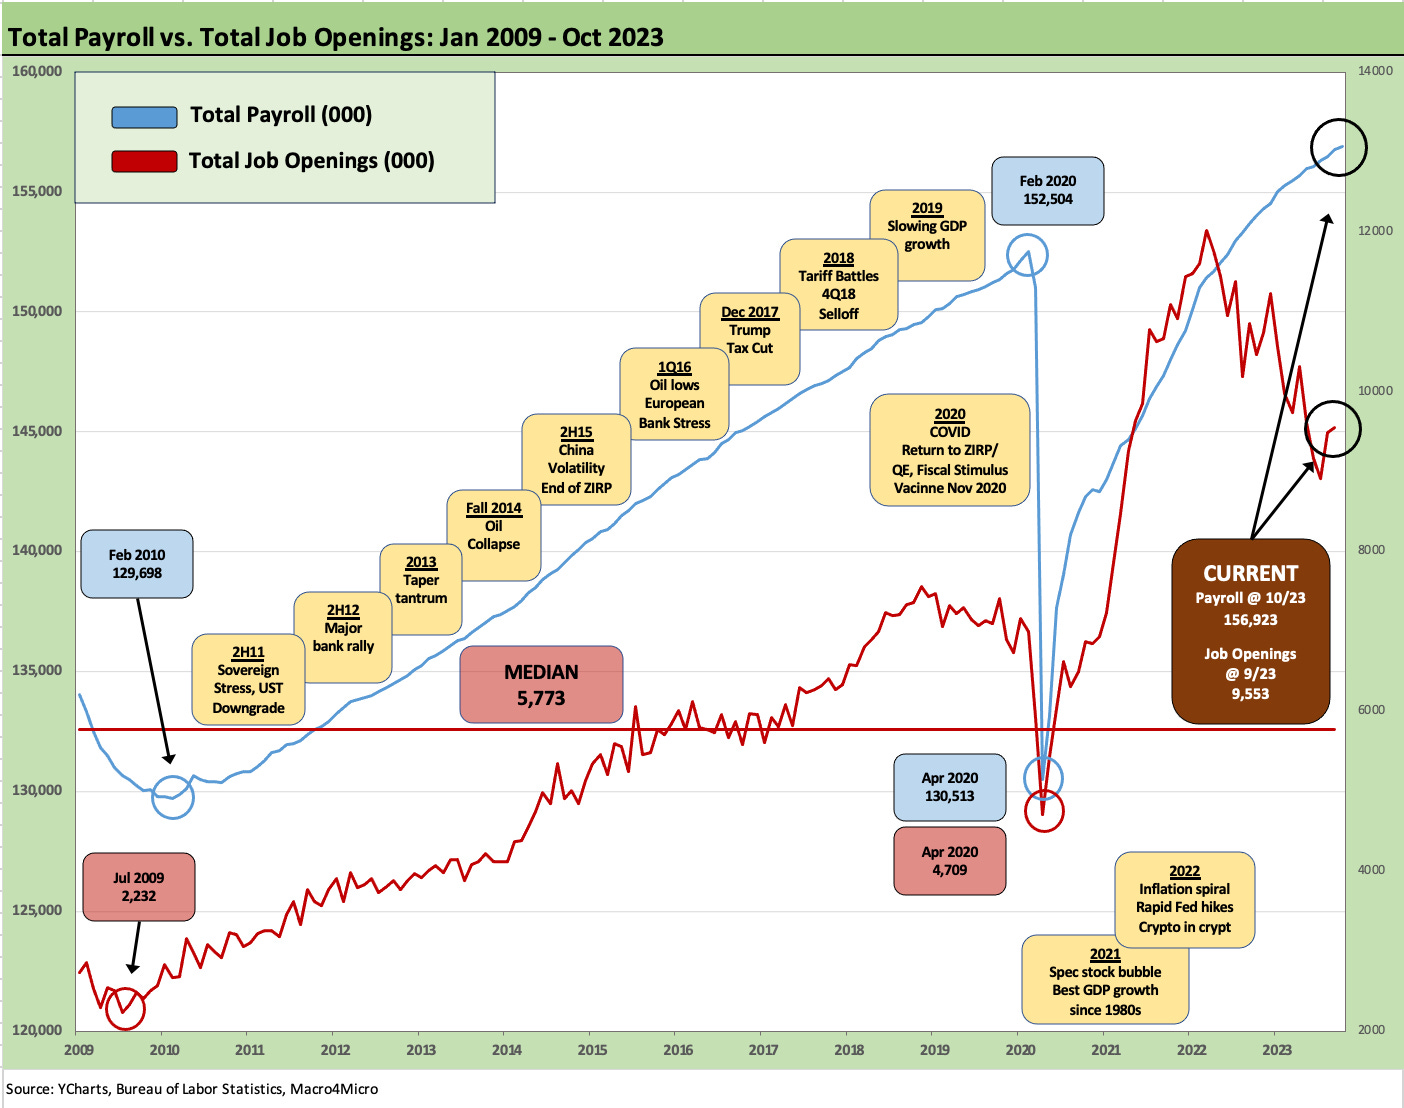
This one is self-explanatory and plots unemployment rates vs. total payroll. Record payroll counts and sub-4% unemployment would have given the entire FOMC a stroke in the 1990s. They were nervous in the mid to late 1990s about high capacity utilization and low unemployment, but inflation barely budged until later – and then it was 3% handles. They needed to shred their NAIRU models. We saw a heavy dose of 2% and 1% handles for CPI in 1997-1999 until 3% crept into the picture as the TMT bubble was deflating. We cover those years in other publications.

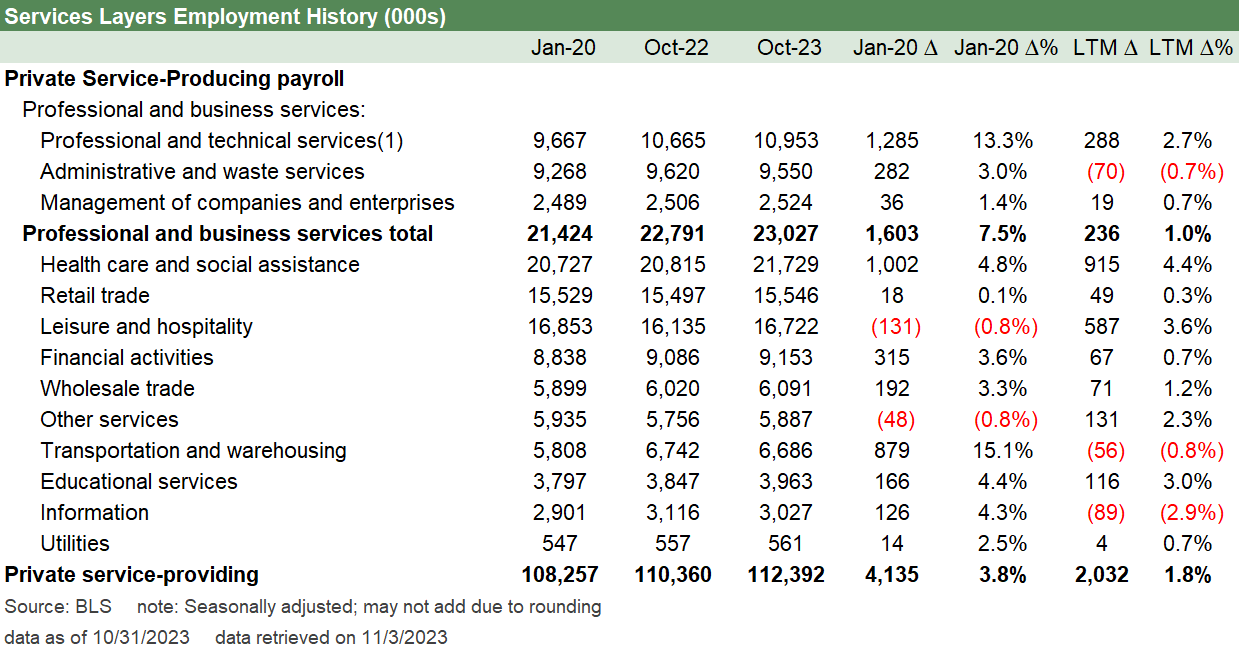
The above chart updates the broad sector view and totals of the payroll mix. We now update these charts monthly, but the stories on mix do not change materially month to month. We plot the deltas from Jan 2020 to mark the last clean pre-COVID month to start that year. We also plot the monthly numbers alongside the prior year month and detail the LTM job adds and % increase.
The job market has been quite strong and remains steady even if a lower “job adds” total for October was cause for some UST curve relief today. The main secular decline is in Nondurables as we have covered in past commentaries. Many of those jobs will never return. As we have said before, some have left the country, and some have left the planet (or are six feet under).

The above chart details the durables mix. Durables are up LTM and Transportation Equipment and Machinery have led the group. It is no boom, and there is a lot more to do to drive manufacturing jobs. That is why protectionism has a more bipartisan flavor now.

The above chart plots a multi-cycle timeline since mid-2007 that shows the expansion in employment in the transportation sector. While so much attention is drawn to the Detroit 3 and their chaos during 2008-2009 and the UAW battles over plant closings, the transplant belt and expansion of their supplier chain and distribution needs has been a steady growth story.
We also see the legacy Detroit 3 climbing up off the mat to grow in the EV transition that in turn influences investment along the supplier chain and supporting infrastructure-related businesses. The recent small notch down in the timeline was a function of the limited UAW strikes.
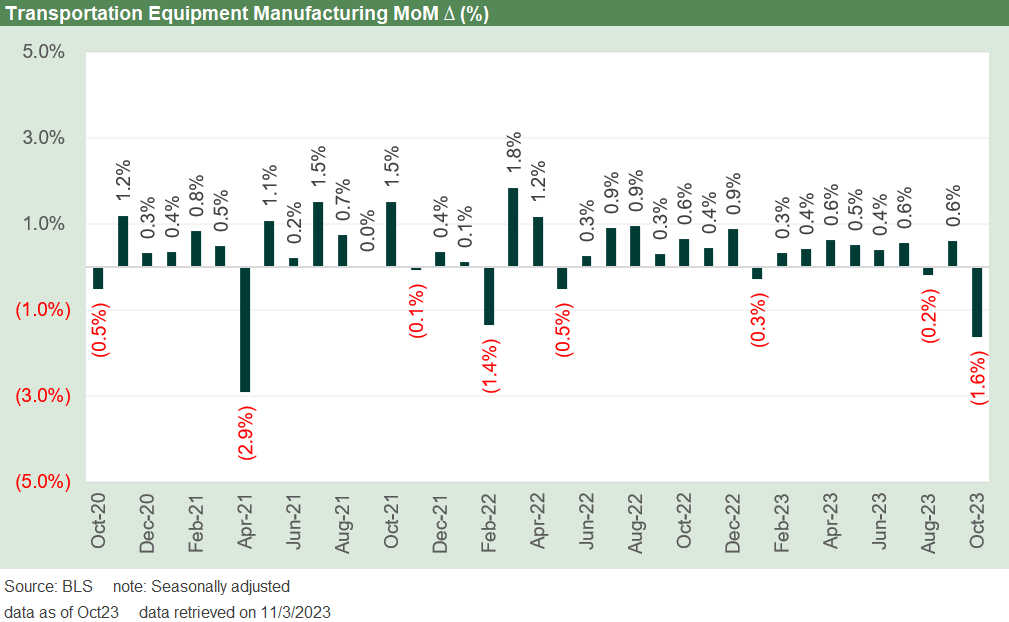
The above chart looks at MoM growth in Transportation Equipment, which is heavily about Autos. We see a decline this month on the UAW strikes and supplier chain effects. We saw an even bigger % decline back in April 2021 when temporary layoffs had to be implemented to deal with semiconductor shortages that were interrupting production schedules. There are some similar effects in early 2022.
For the auto sector, the reality is that there is increased demand for skilled technicians/diagnosticians with computer and software skills. That runs the gamut from the supplier chain to the OEMs to dealers and aftermarket parts and services operations.
The electronics and software intensive vehicles require that Mr. Goodwrench meets Mr. Goodgeek and becomes one. We had heard that especially from dealers over the years given the profitability and higher margins of parts and services operations. We note the dealers are over in Services numbers and not manufacturing.
The “skill needs” require higher compensation since there is no shortage of competition for those professionals. Similar demands are seen in the upstream E&P sector with some dealers mentioning that competition for talent back in the earlier years of the expansion wave of the shale sector. The core “skill needs” were drawing some of their candidates for very high pay at the time.

The above chart updates the typically weak and uneventful Nondurables line with an LTM decline in all categories except Food Manufacturing and “Misc.” The Nondurables mix has been in secular decline for decades in areas such as textiles, apparel, paper, and printing.
The fact that the US is a “services economy” is not a debate and has not been disputed in many years. The desire to grow manufacturing is also very much alive but requires protectionism to pull that off. That is just the reality for anything labor intensive but also for an increasing range of technology products.
In Services, we see 2.0 million jobs added LTM and 4.1 million since Jan 2020. Services comprise 88% of the payroll additions since Jan 2020. Professional and Business Services lead the increases with Health Care and Social Assistance next followed by Transportation and Warehousing.

The above chart updates the trend line in Construction, where we see solid LTM and post-COVID job adds on the back of nonresidential construction growth and favorable demographics supporting growth in residential construction (including multifamily) despite the setbacks of late with mortgages.
While the politics tend to cloud the objective numbers, the action driven by various initiatives (infrastructure, semiconductors, EV and supplier chain, etc.) have been a major GDP driver and job provider in 2022-2023 (see Construction: Project Economics Drive Nonresidential 10-2-23).