
Footnotes & Flashbacks: State of Yields 11-19-23
We look at another bull flattener rally week and frame some more UST curve slopes.


Another good week for duration and risk with rallies in bonds and equities as the two markets find the upside of correlation after the downside in 2022.
Supportive macro indicators (CPI, PPI, Retail Sales, Industrial Production, Housing Starts) managed to thread the needle for those seeking both lower inflation and cyclical resilience.
The debates at the margin do not change the reality of an anchored inversion on the front end and the challenges for Fed liability management in cleaning up a lot of funding needs ahead.
We update the curve segment slopes from 2Y to 5Y, 5Y to 10Y, and 10Y to 30Y.
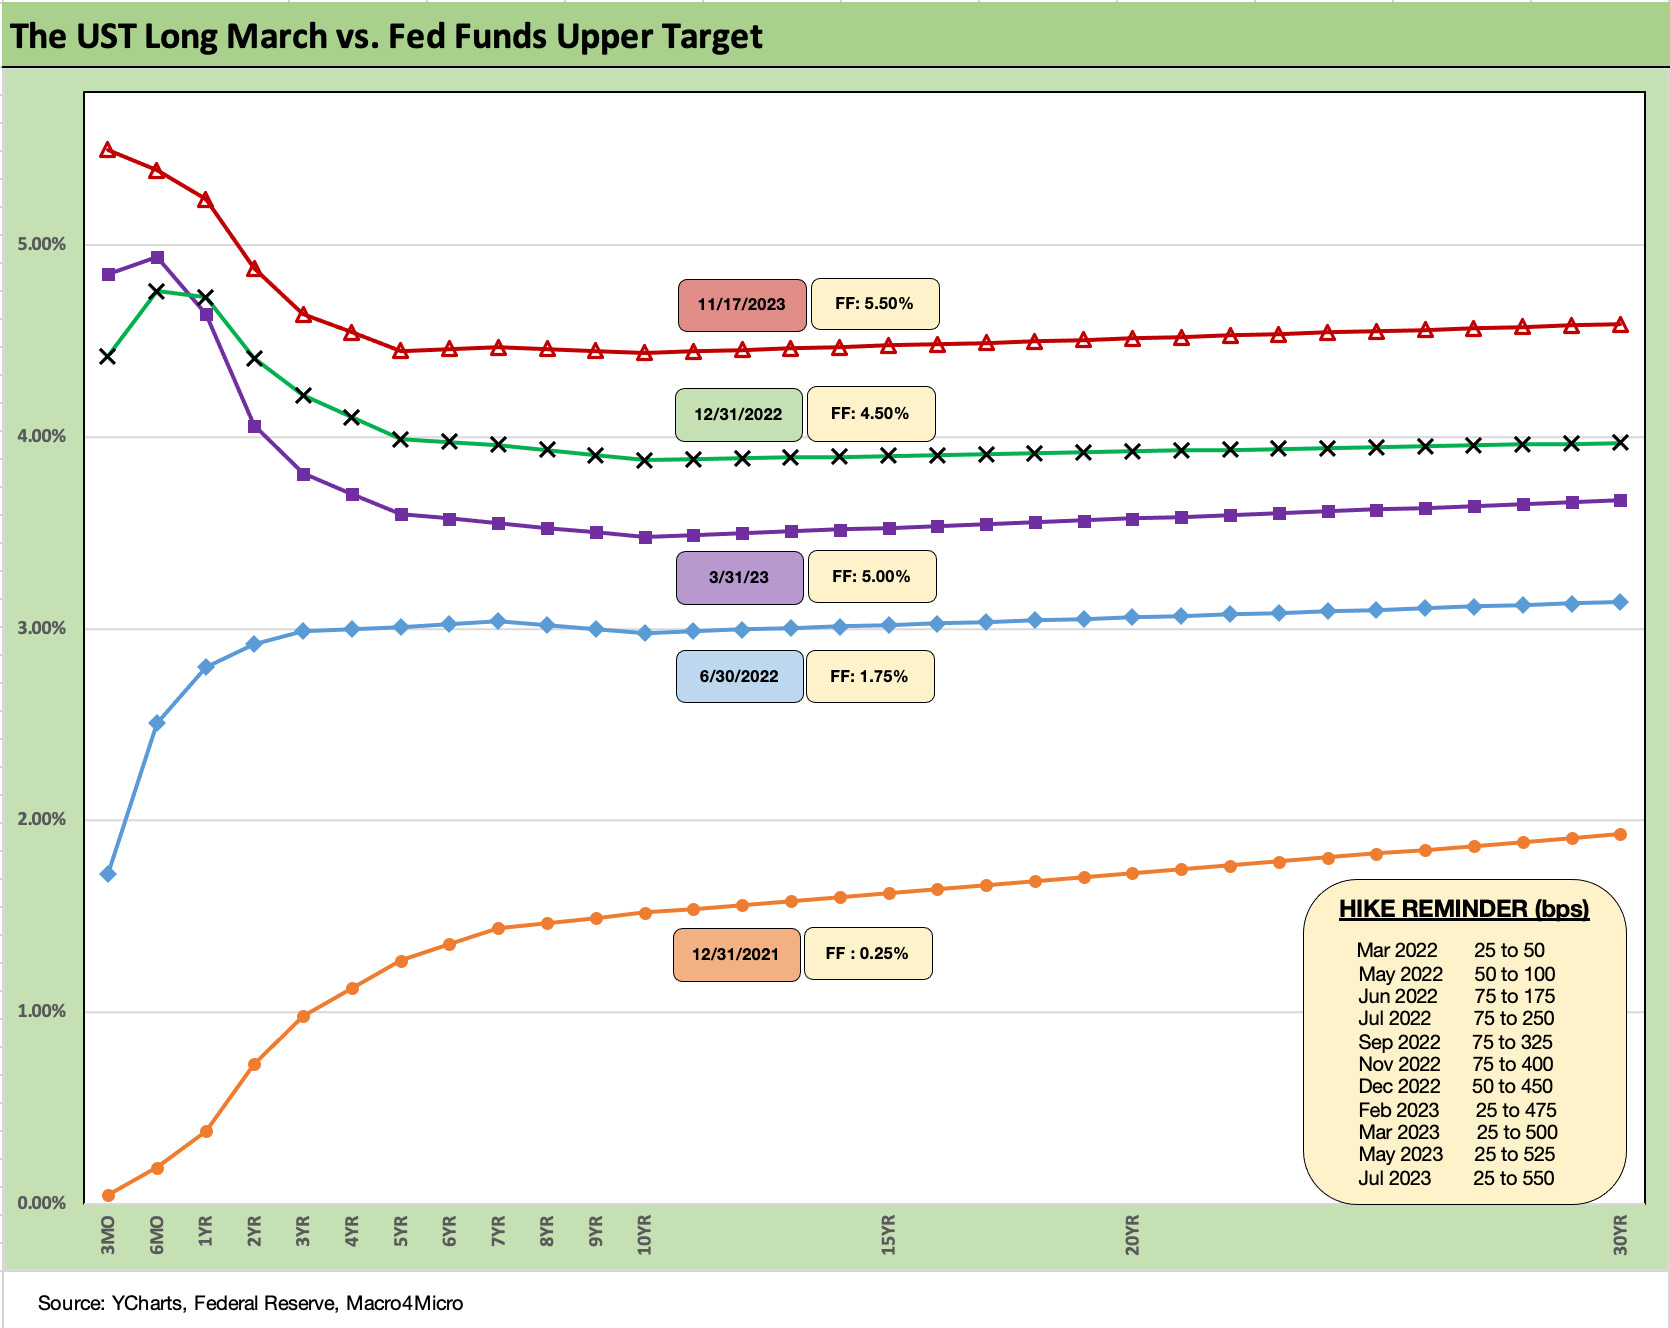
The market has shifted to asking the Fed and the UST curve “What have you done for me lately?” rather than dwelling on all the horrible things they did on the painful journey from the land of ZIRP in 2022 and into 2023. Bonus years and calendar performance start a new game clock soon, and the repricing of the UST curve and new issue coupons creates a more complex set of decision points for income investors and total return investors.
The same challenge is true for corporate treasurers and liability managers. The challenge of handicapping how the duration gambit looks to play out is still no easy exercise for those still clipping 5% handle short UST in the face of an inverted curve. M&A bankers are hoping everyone uses lower interest rate assumptions in their deal math and pick up activity.
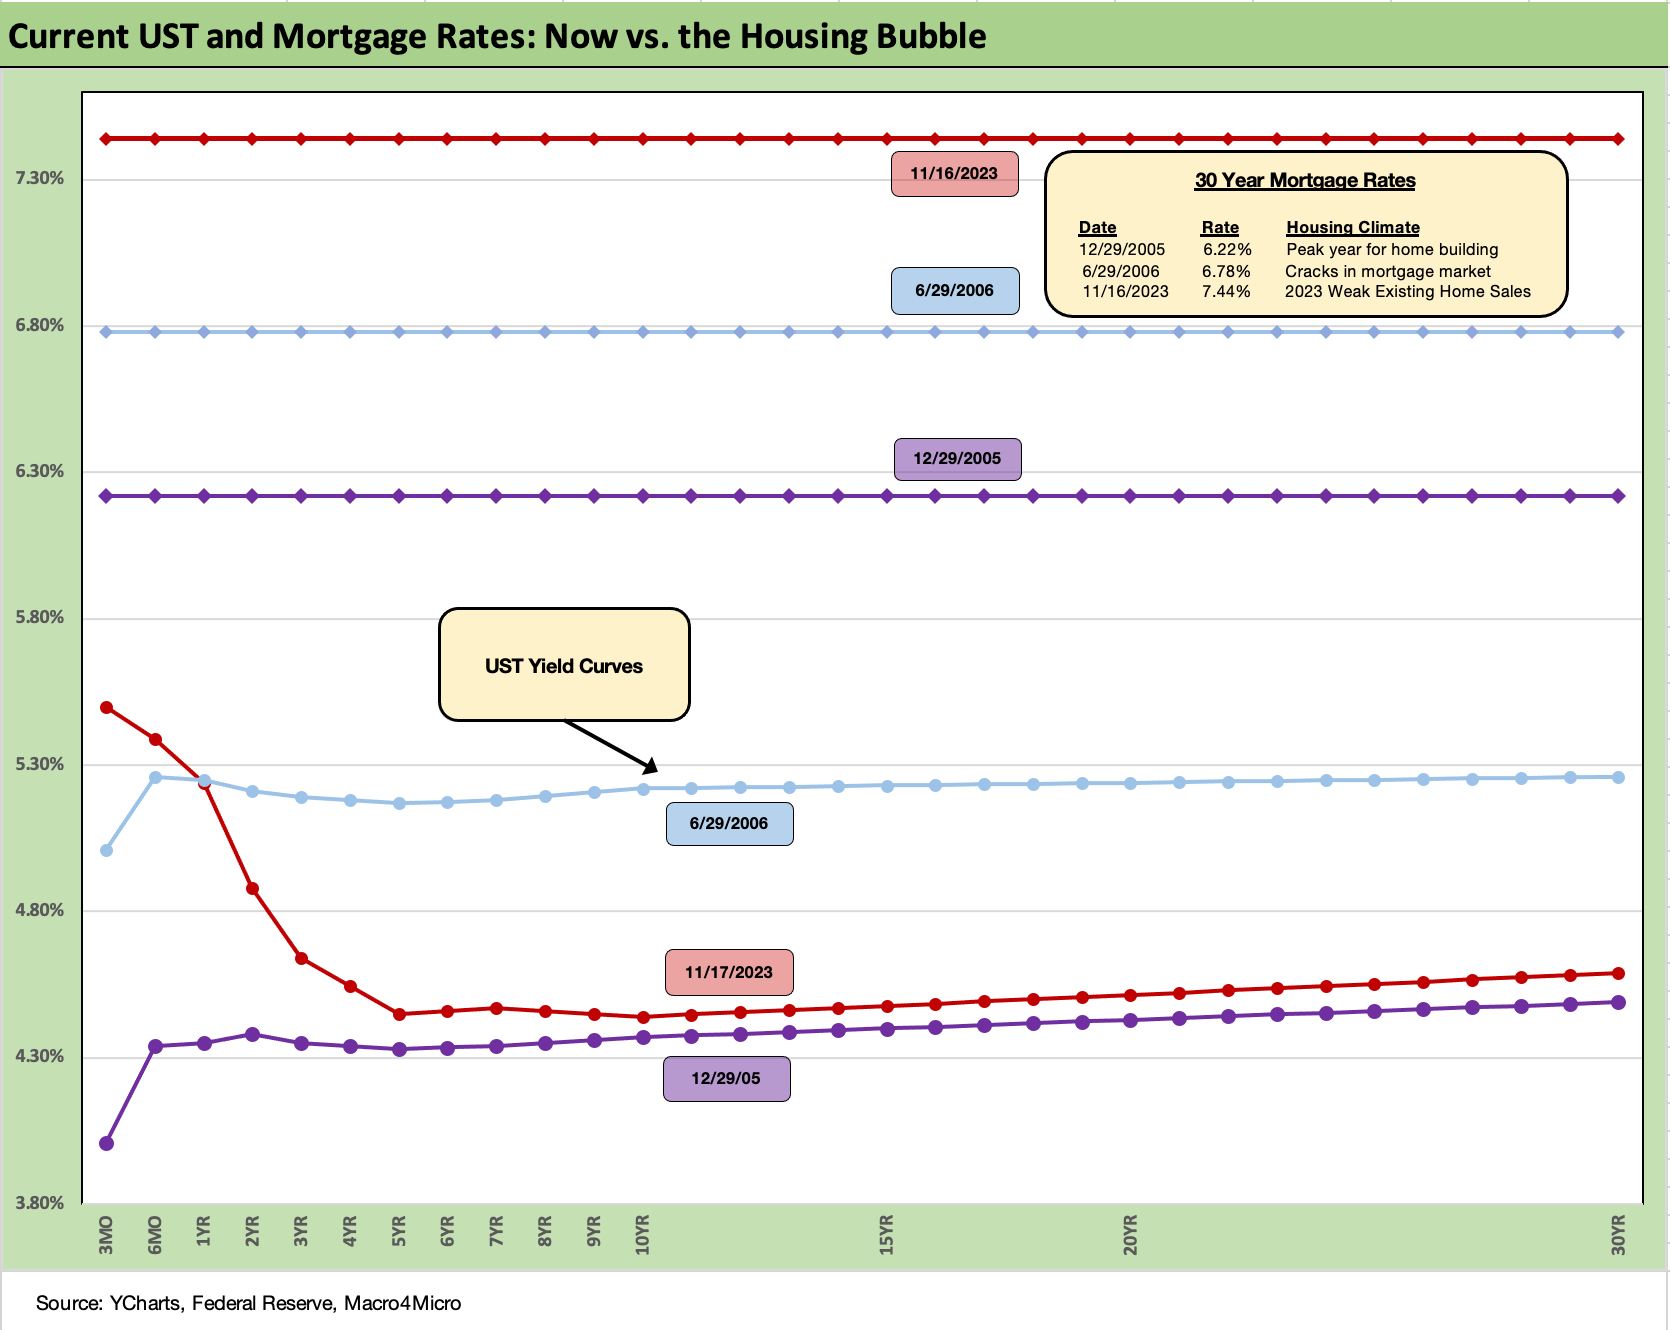
The chart above offers a reminder of the painful journey of the UST curve. We include a memory jogger box detailing the Fed tightening actions. Here we are with 2023 winding down and mortgage rates well above those seen in the housing bubble years of 2005-2006 but with LTVs favorable, home prices and house equity value strong, and underwriting standards actually requiring standards to be met.
In credit markets, we are now looking at all-in IG corporate yields almost even with the June 2007 peak with a lower UST market. The IG corporate index yield is only around 70 bps below the credit peak period of 1997 when the market saw OAS lows for IG. There is more similarity overall to the late 1990s today than to 2007, but that is a topic for another day. The inflation factor dwarfed all other variables for a while now into 2023, and we did not face that scale of challenge in 1997 or 2007.
Over in HY, we see all-in HY index yields higher than 2007 and slightly below 1997. The spreads today are materially wide to the lows of those earlier credit peaks, but we know what came after 1997 and 2007 was turmoil and eventual pain.
In the case of 2007, the worst of the fallout came from mortgages and the bank system to trigger a market implosion. The post-1997 dynamic includes a slow burn into a rising default backdrop by 1999 that ran alongside a rising UST curve into 2000. We update those period comparisons further below as a regular part of this weekly yield update.
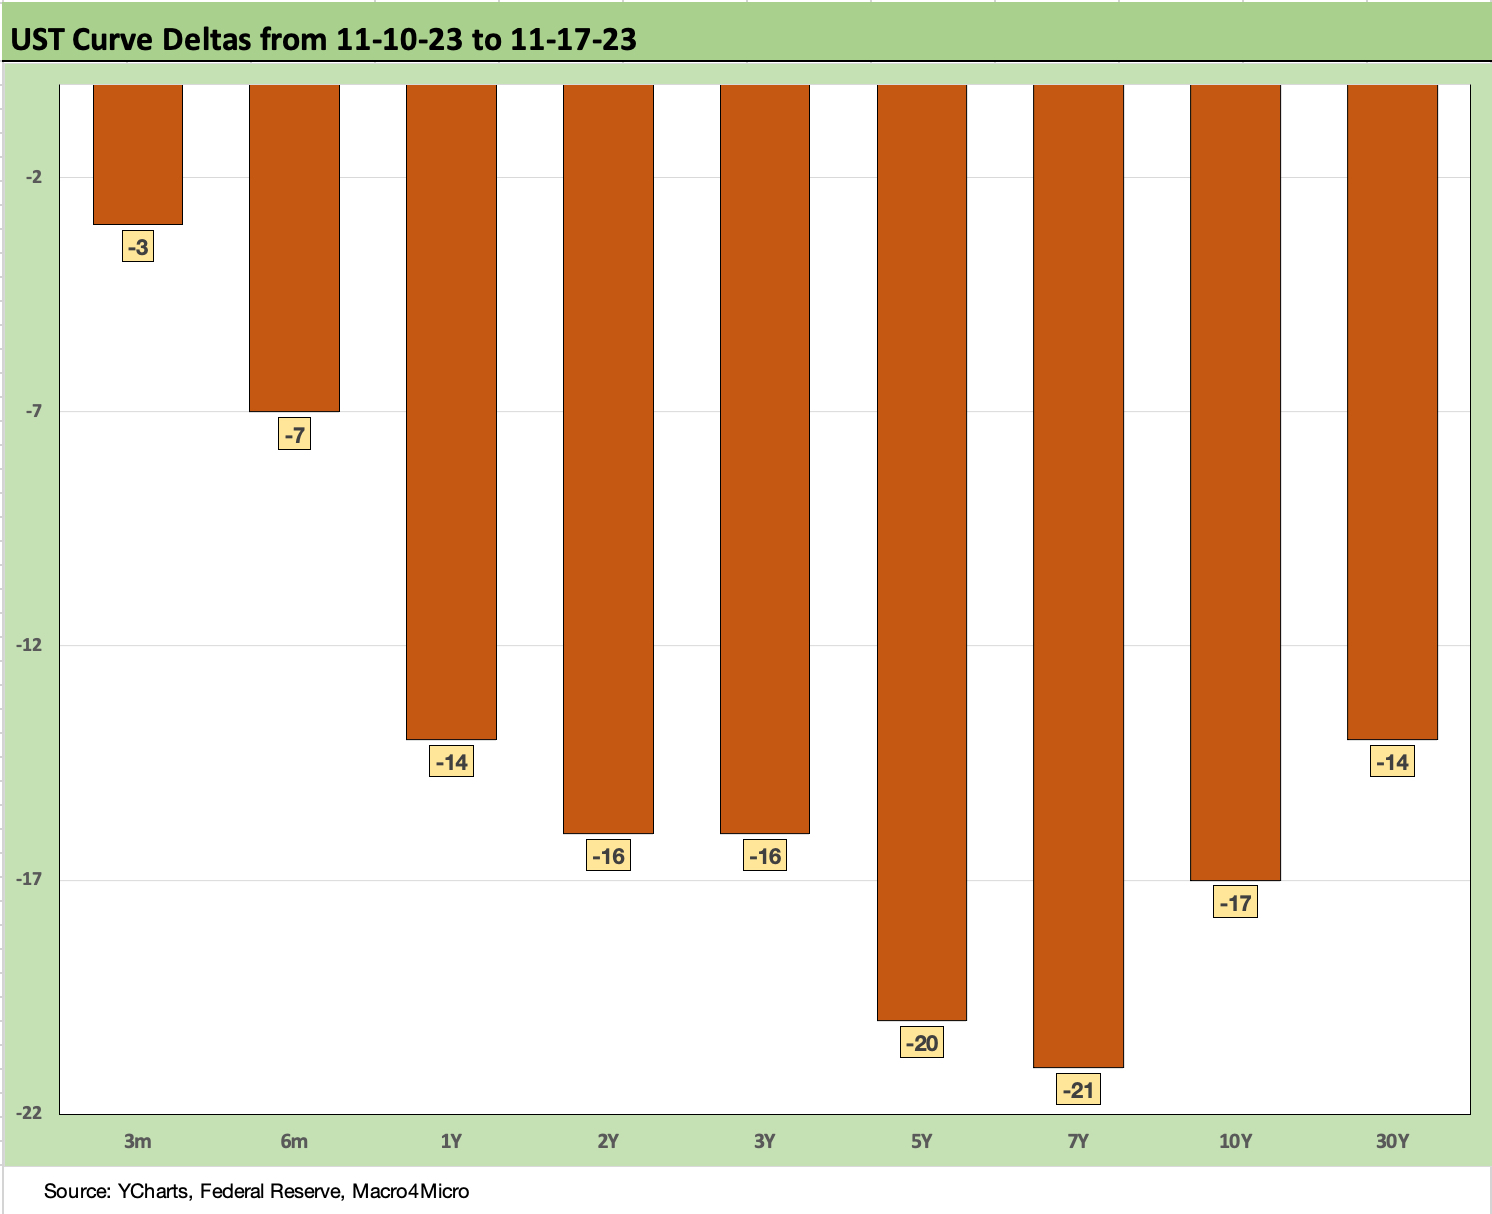
The above chart updates the yield curve deltas for this past week, and we see another material rally into a fresh round of a “bull inversion” trend as the Fed holds the line on the short end. Good news from CPI and PPI helped with CPI dominating the story line this week (see October CPI: The Big 5 Buckets and Add-Ons 11-14-23).
The constructive Retail Sales and Industrial Production stats also helped keep cyclical pressure fears lower while keeping the “no recession” scenarios alive and well (see Retail Sales: No Disturbance in Retail 11-15-23, Industrial Production: Pit Stop or Tapping Brakes 11-16-23). Housing starts were also supportive as a key sentiment driver with all of the homebuilding multiplier effects (see Housing Starts Oct 2023: Back in the Game Coach? 11-17-23).
We look at asset returns in a separate weekly “Footnotes” publication, and the fixed income ETF proxies rang up good numbers and were all positive for the week and did even better over the trailing 1-month period. The long duration 20+ year UST ETF (TLT) made it into the Top 5 performers across the 28 benchmarks and ETFs we track. That said, the duration sensitive TLT is still sitting in the negative zone over the trailing 3 months and ranks third from the bottom YTD (11-17-23) just ahead of the Utility ETF (XLU) and the brutalized regional bank ETF (KRE) at a distant last place with regional bank KRE at -21% return YTD.
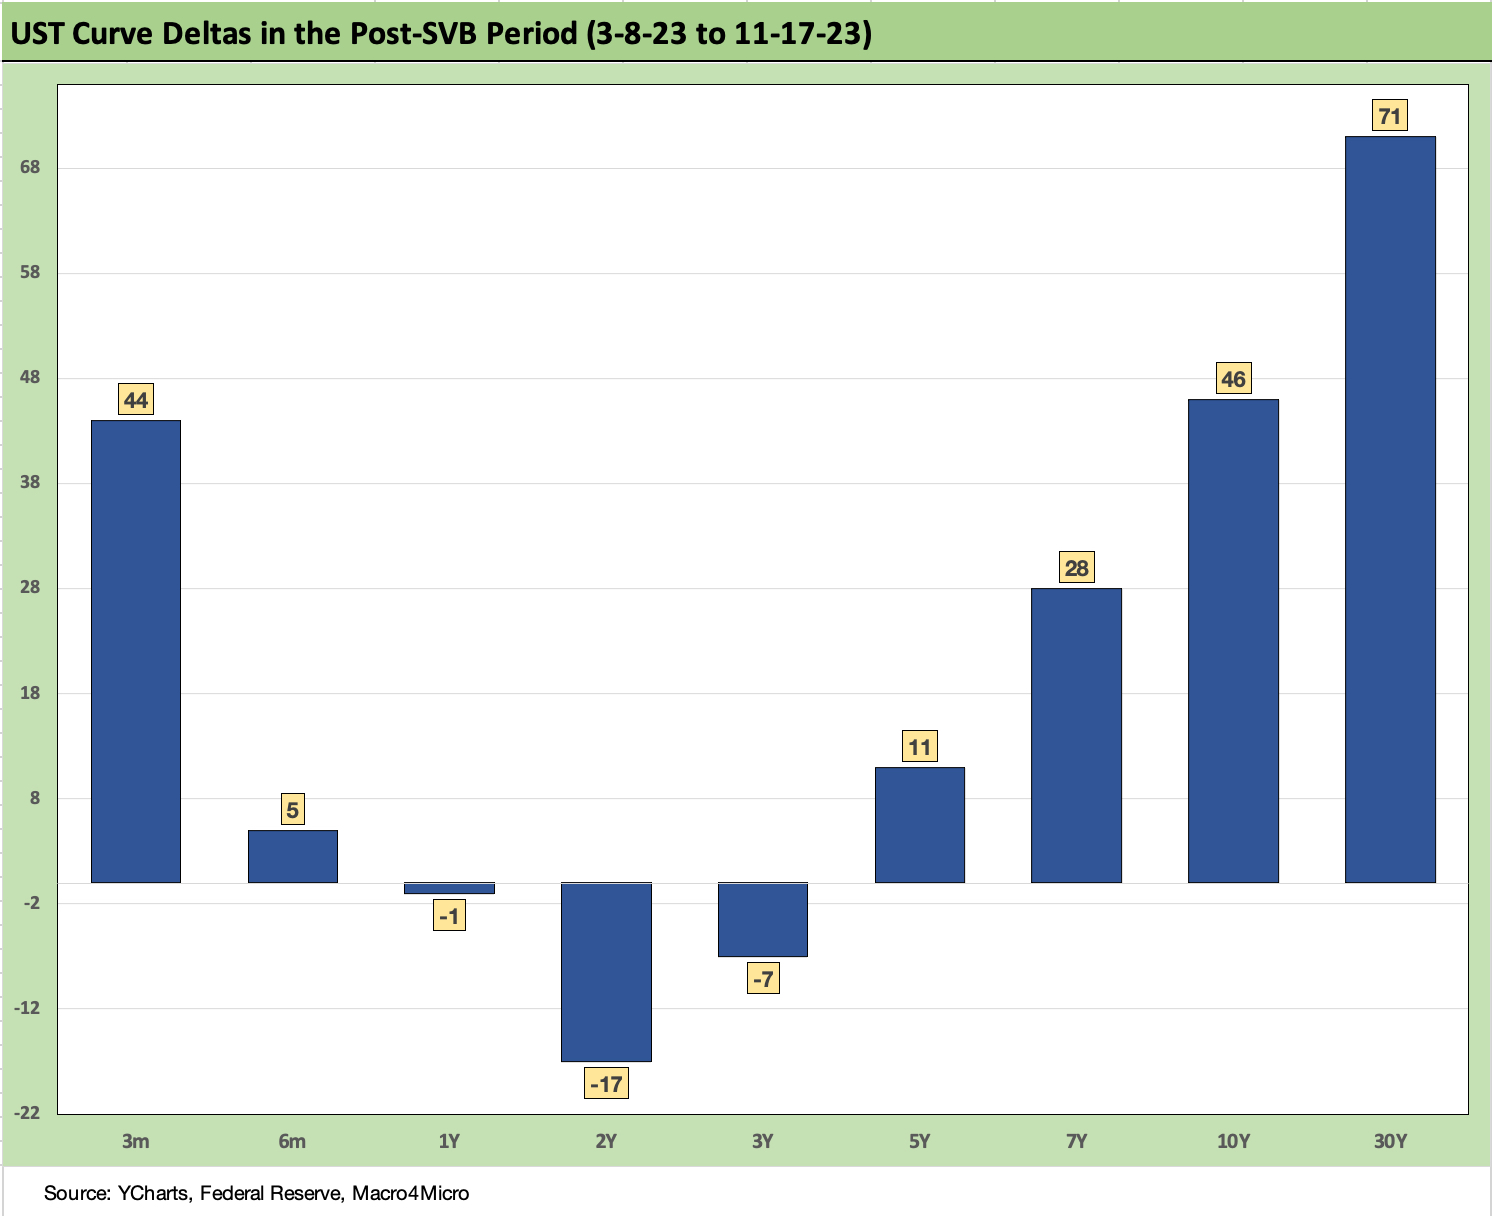
The above chart updates the UST curve deltas for the post-3-8-23 period to reflect the action since the regional bank blowup. As a reminder, 3-8-23 was the last clean trading day before Silicon Valley was torched (and seized by 3-10-23). The post-SVB period shows a steepening from the long end combined with a decline in 2Y UST over that timeline.
As is evident in the chart, the Fed stuck to its inflation fighting and fed funds tightening plan despite taking some days off to essentially backstop deposits with liquidity support to prevent more “push button bank runs.”
Tightening also served to put more heat on banks to compete for cash, but overall the plan worked (see SVB Reprieve: Hail Powell the Merciful 3-12-23, Silicon Valley Bank: How did the UST Curve React? 3-11-23). That March run on the broader range of banks remains shocking in retrospect and reminded everyone why the Fed is the ultimate sentiment shaper in a crisis.
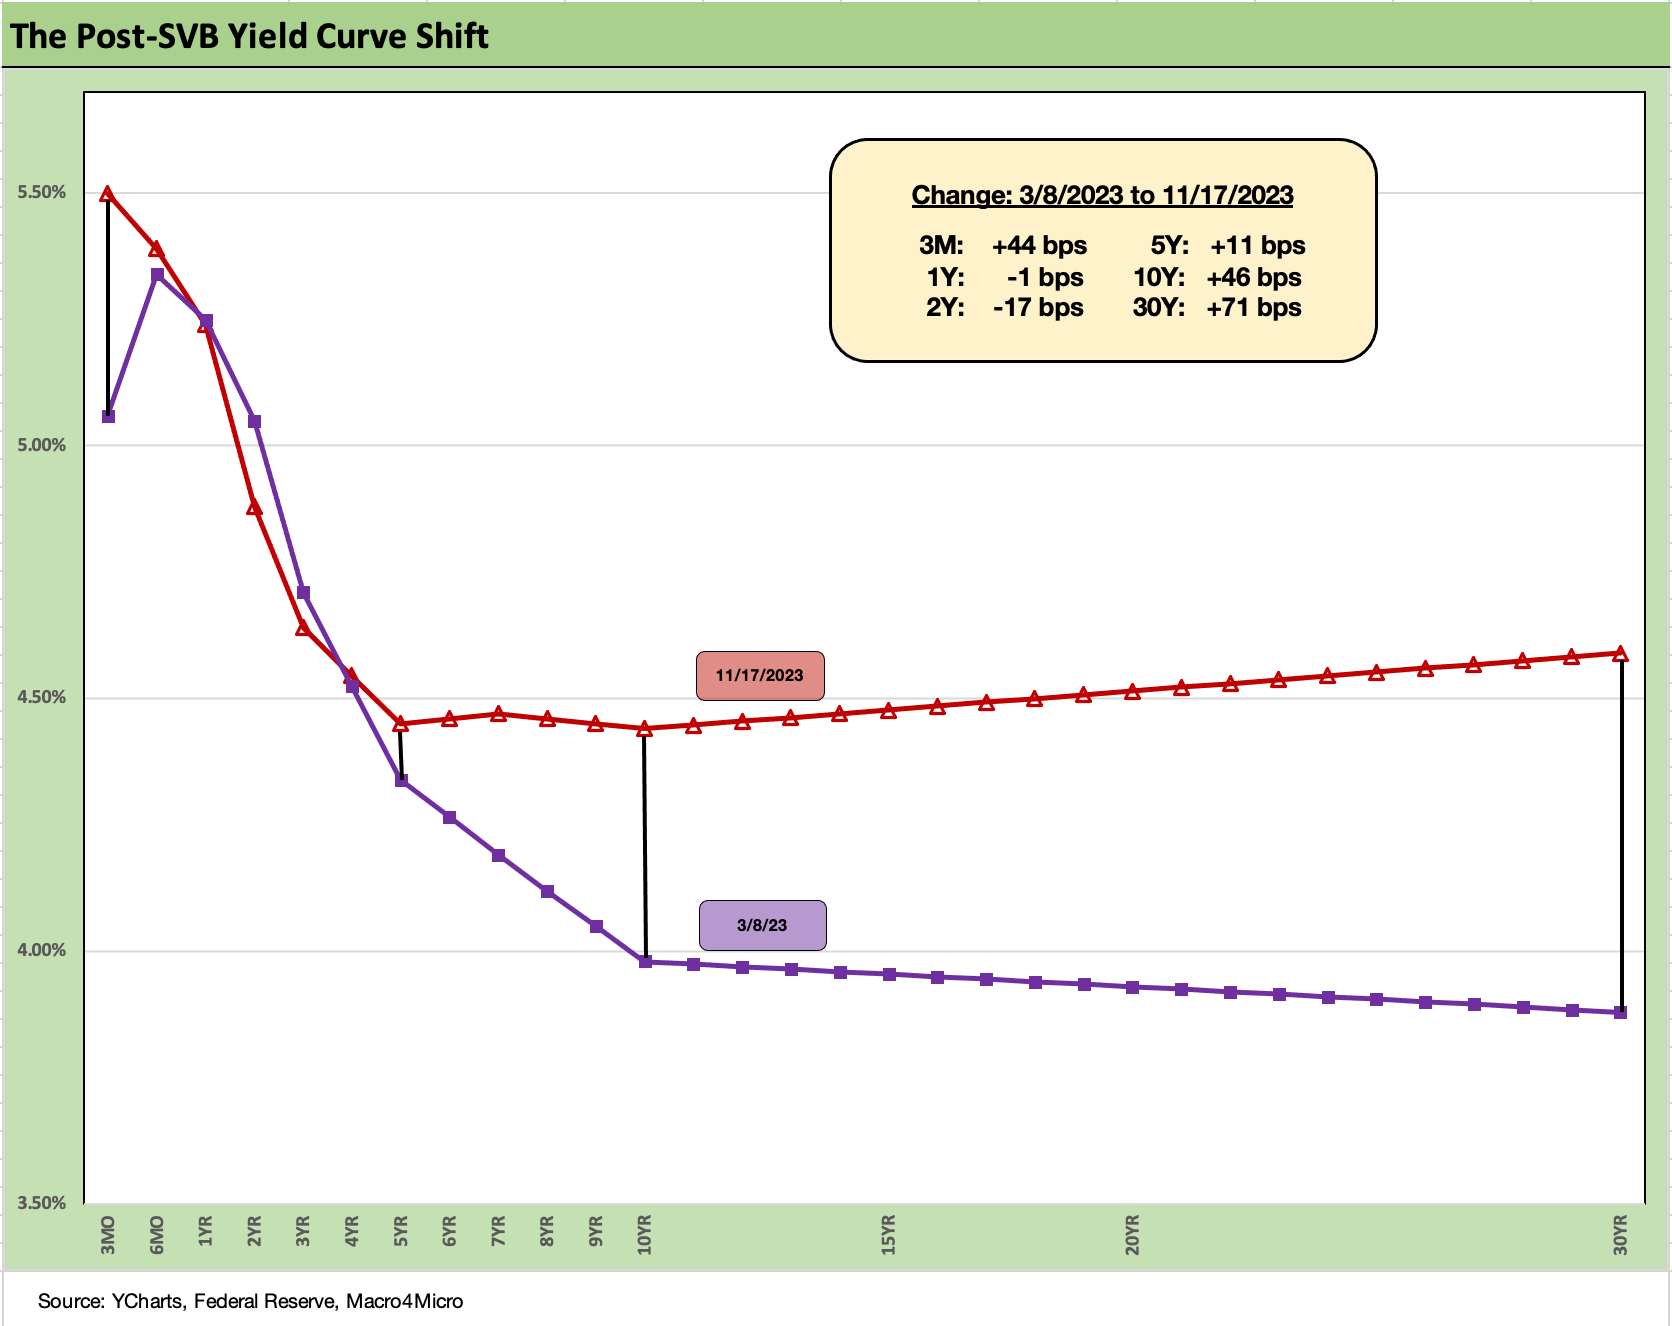
The above chart puts that post-SVB delta back in yield curve format, and after some steepening past 5 years we are seeing some moves back to flattening. The stretch of bear steepening was roiling the markets through the third week of October and that has sharply reversed course. In the box above, we post the running deltas from 3-8-23 to 11-17-23. These numbers still show a bear steepening from March.
If we look back to the Friday 10-20-23 running deltas (see Footnotes & Flashbacks: State of Yields 10-21-23), we get an idea of how much the steepening has reversed course. The delta on the 30Y was +121 bps or 50 bps higher by Oct 20, 2023. The 10Y was 49 bps higher, and the 5Y 41 bps higher. The 2Y UST was in positive territory at +2 bps or 19 bps higher. That retreat to flattening from steepening has pleased the market broadly, but that fight is hardly over on the supply and demand questions around where paper will get placed along the curve by the UST.
The bubble lookback years…
With this chart, we drop in the UST curves and the Freddie Mac 30Y mortgage benchmark for two periods from the housing bubble. The historical comparison gives context to how strong demand can be with 6% handle mortgage rates such as in 2005 and 2006. The problem this time around is how much prices soared in 2020-2021 (flight to the ‘burbs) ahead of the Fed tightening cycle. We include the year end 2005 date as the peak homebuilding year and the middle of 2006 when the “liar loan” phenomenon and subprime excess was cresting.
In 2006, subprime was starting to show some cracks but was not yet sending the credit markets into a case of nerves. That would take more quarters to go by. Even then, equities only folded later in the fall of 2007 before the onset of a recession in Dec 2007 (that “official” date for recession was set much later by NBER).
It is notable that the current UST curve is now above the end of 2005 in 10Y UST but well below the intermediate and long end of the UST curve seen in mid-2006. Despite that UST configuration, the 30Y mortgage levels of 2023 are well above 2006 and were pulling away before this latest curve rally.
The latest move on mortgages helps, but 7% is a long way from a housing catalyst…
The 30Y mortgage market at 7.4% is making it easier for homebuilders to do even more attractive buydowns and keep their run rates on housing starts solid enough to push back on recession theories. That said, even a flat 7% mortgage delivers an enormous amount of monthly payment pain to homebuyers. With so many potential sellers sitting on 3% handle mortgages (and even lower), the inventory is going to stay tight.
The signal from the homebuilders on what rate level works for many buyers in their mortgage rate buydown incentive programs appears to be the high 5% handles. This does not imply that a low 7% will move enough potential sellers in the existing home sales market, but it gives the builders more to work with as a starting point.
Basically, the homebuilders will keep on winning in this market even if we see the pace topping off right now as we move into the offseason. We looked at a range of homebuilder ranks and stock performance data in a report we posted this past week (see Pulte: Relative Value Meets Old School Coupons 11-15-23).
Even though mortgage rates are the prime driver of monthly payments, the supply-demand imbalances (higher demand) are not helping prices equilibrate to the monthly payments that work for many homebuyers and especially the first-time buyers and many move-up buyers. Existing home sales are back at crisis period levels and the inventory swing factor has supported prices and stretched affordability beyond many potential buyers (see Sept New Home Sales: The Need to Live Somewhere 10-25-23).
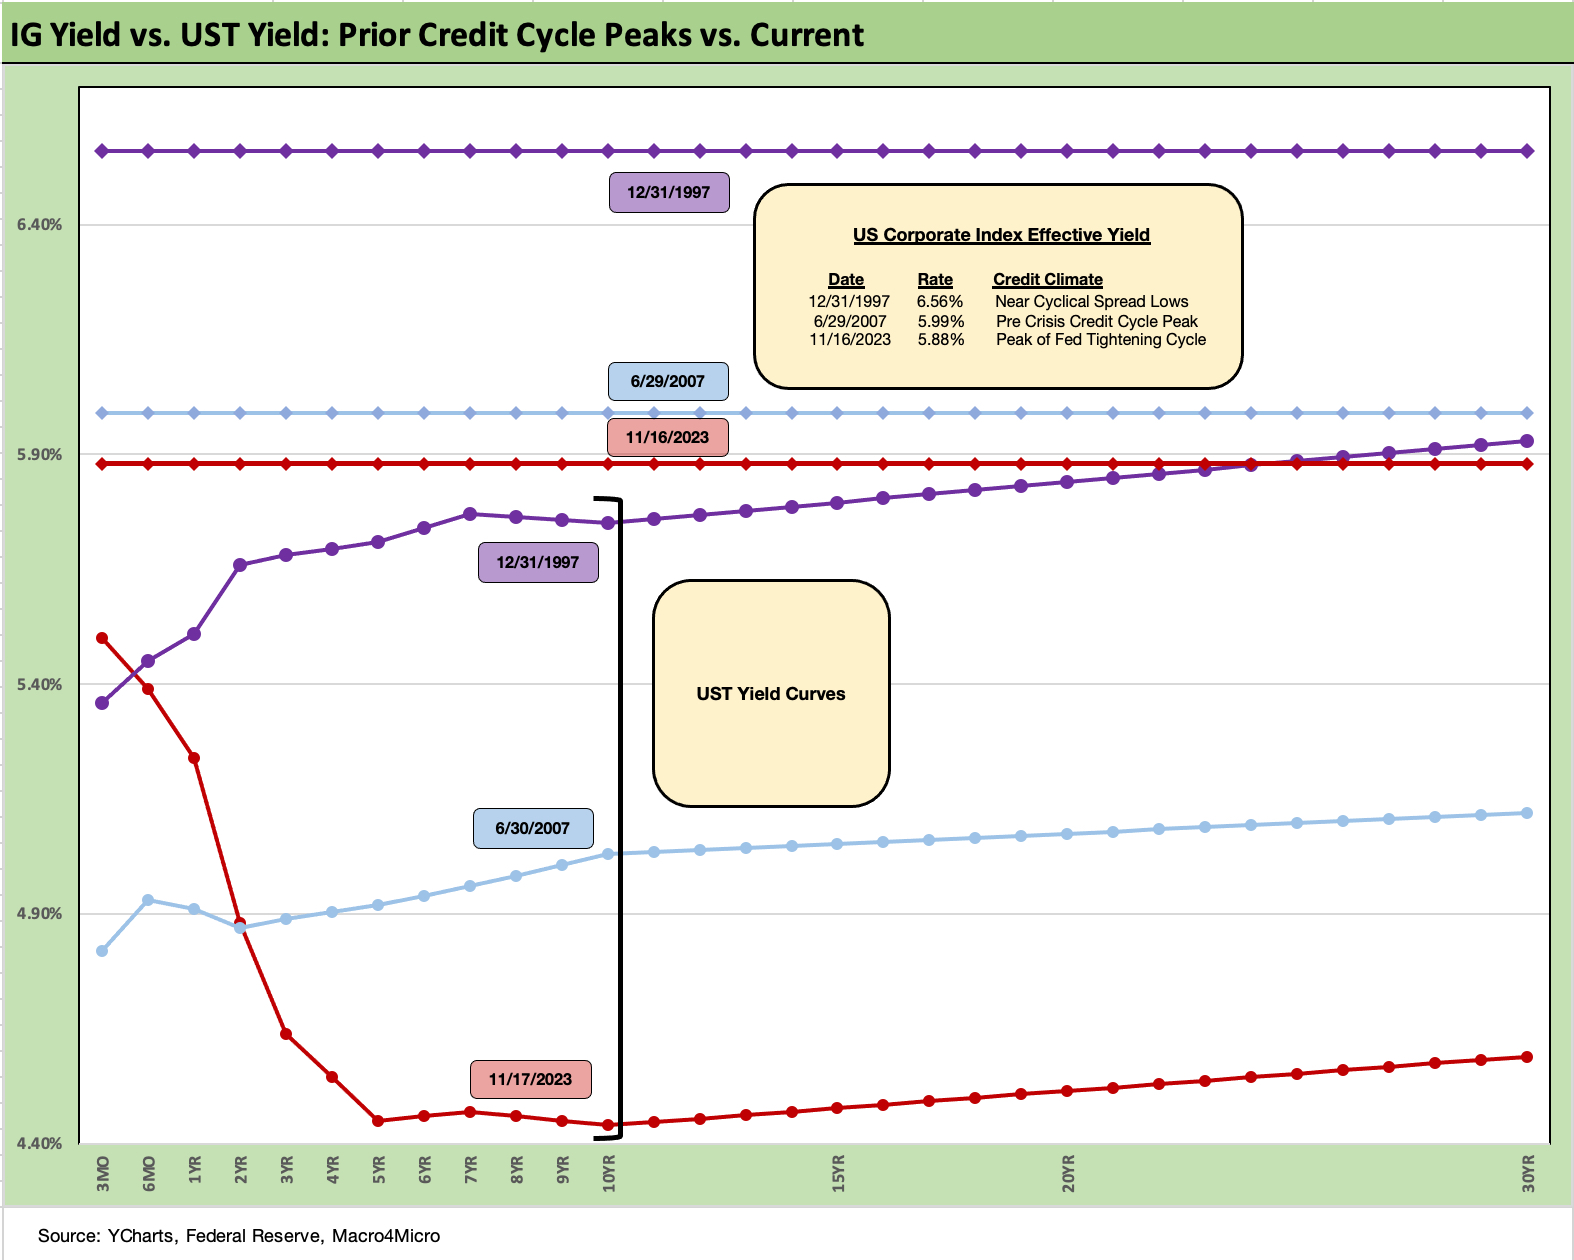
The above chart goes through a similar exercise for the current UST curve and IG index yield for current days vs. two periods (1997, 2007) where the market was at or near spread lows.
Spreads were much tighter in those peak periods relative to the +120 bps to close last week in the ICE IG index (11-17-23). For the past week, IG spreads tightened by -6 bps with quality spreads compressing slightly within IG. The ICE IG index OAS is around 14 bps through the long-term median, so spreads are still not signaling trouble or fears around a material spread wave along the speculative grade divide (see HY Credit Spreads: Migration, Medians, and Misdirection 11-6-23).
As we look back across periods of spread compression near credit cycle peaks, the +70 bps for the IG index at the end of 1997 was much lower (the low was in Oct 1997 at +53 bps) than today. The same is true at +100 bps at 6-30-07 at the credit bubble peak, which was tight to today’s levels. The takeaways from 1997 and 2007 were that those years were in stages of the credit cycles that were on shaky ground given the direction of credit quality.
As we know, the market events got noisy after those 1997 and 2007 periods and dramatically so after June 2007. The 1998-1999 period was a protracted period of global credit volatility (Asia, EM, etc.) ahead of the launch of the eurozone credit markets to start 1999. For TMT, it ended badly.
It is notable that the BBB tier OAS has not been moving much across these recent rally weeks seen in the UST and equity markets. That changed this past week with an -8 bps move tighter to bring the trailing month to -10 bps tighter. That is over $4 trillion of face value ($3.6 trillion of market value) in the medium grade tier that is not showing a case of nerves at this point.
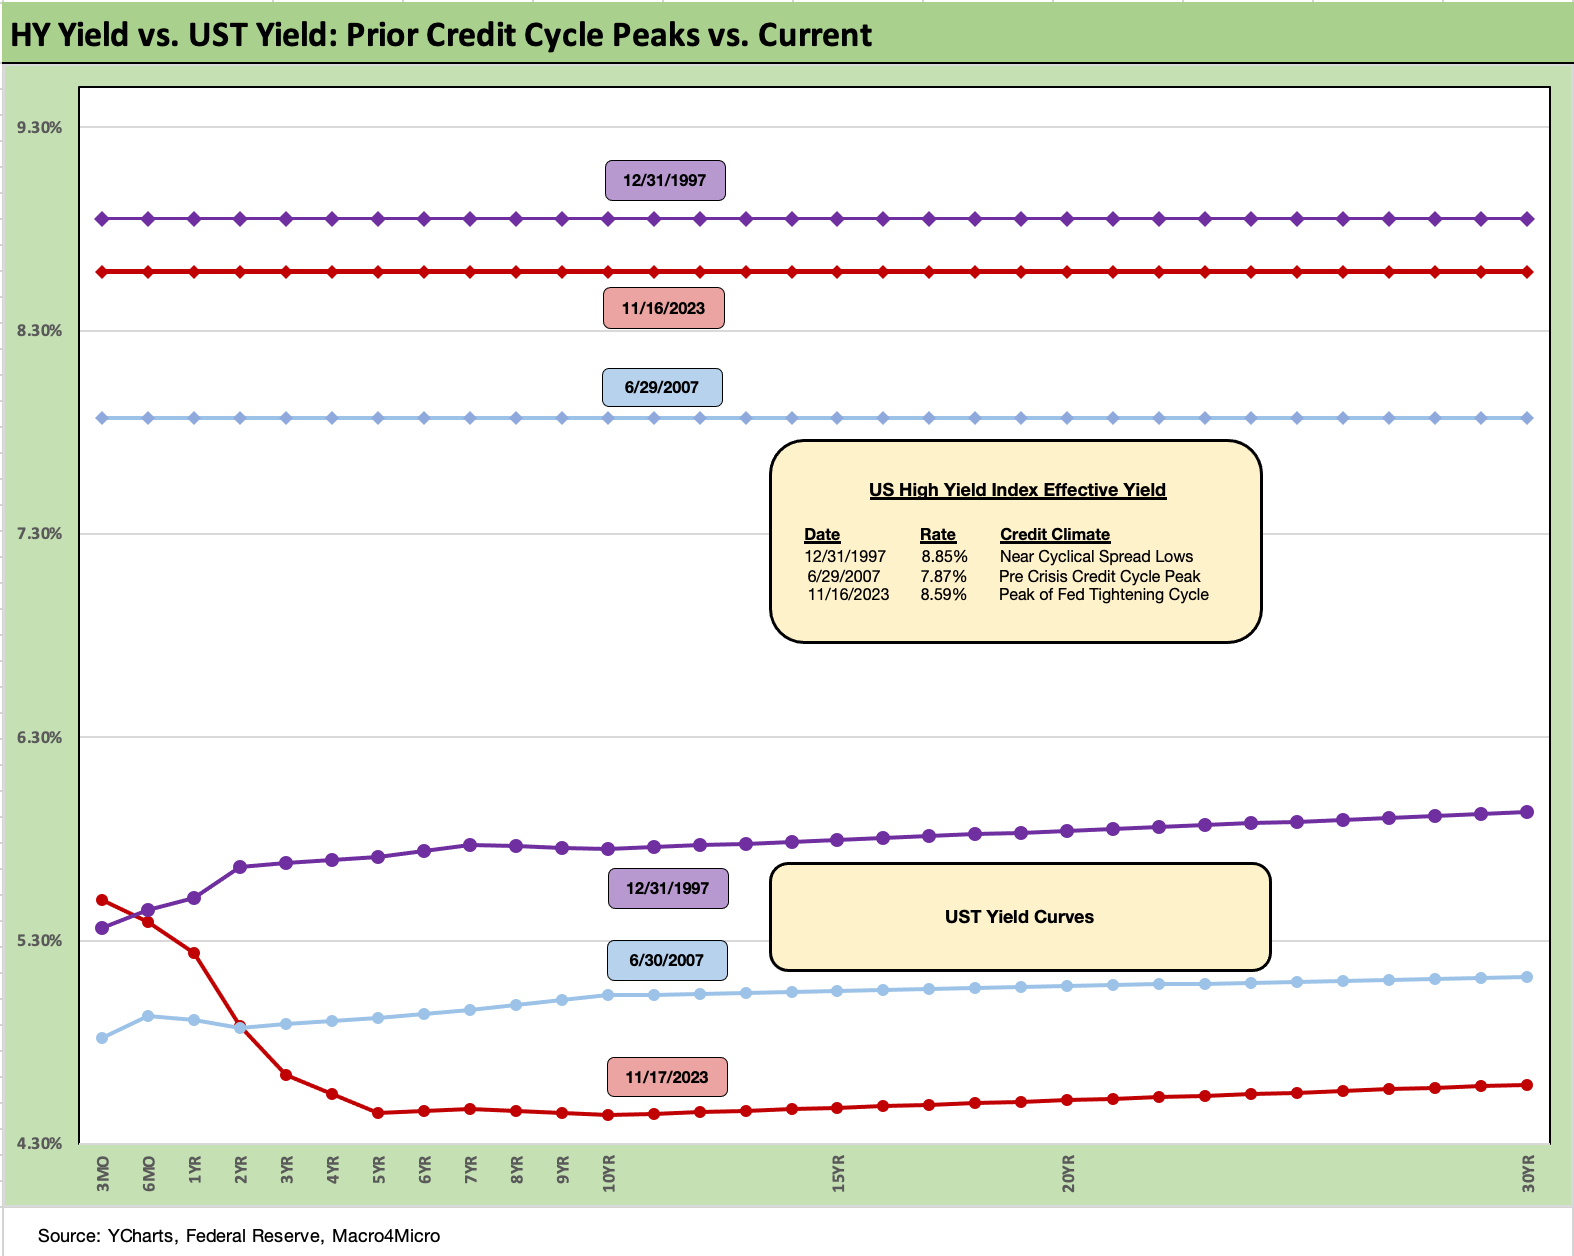
The above chart does the same drill for the US HY market as we did for the IG markets. We use the same dates to frame the symmetry of risks today. We saw HY OAS at +296 bps (12-31-97) although HY OAS had been inside +250 bps in Oct 1997 (+244 10-17-97).
During the crazy period of June 2007 as the market fuse was burning down, we saw HY OAS of +298 bps on 6-30-07 (as tight as +244 on 6-1-07) vs. the +399 bps to close last week (11-17-23). HY OAS was a dazzling -49 bps tighter the week of 11-3-23, but for the current week (11-17-23), the move was only -4 bps tighter. The BB tier was -52 bps tighter over the big rally week of 11-3-23, the B tier -47 bps tighter, and the CCC tier -24 bps tighter. The CCC tier remains wider for the trailing month at +10 bps wider to end last week while both the B and BB are tighter over the trailing month.
These levels are comfortably below the long-term HY median of around +472 bps, so spreads have a long way to go if the market gets sloppier and the geopolitical risks head in an uglier direction. So far, the geopolitics have been very restrained with Iran keeping its head down and the Lebanon border heating up but not yet exploding. Oil has been well behaved so far in all the Mideast turmoil and even dropped into $70 handles and $75 WTI to end the recent week.
Fundamentals have been in aggregate solid, and 3Q23 earnings season is not signaling worry in the immediate context of spreads. For some proxies for trends in the private credit markets, we just got through a decent reporting quarter for the BDCs, which offer some signals on the leveraged, small cap private market. Private credit extends well beyond BDCs into midcap and large cap risky deals. That will continue to get a lot of focus as a differentiating risk wildcard in this credit cycle.
The HY spread rally in the face of some softer macro releases seems more about the dynamics of light supply, UST curve relief, and some equity market sentiment support than compelling relative value. HY offers one of several means to play the credit cycle with less duration risk and higher yields than the IG market. Confidence in the cycle helps the risk-reward symmetry although we remain defensive on the sector considering the risk premiums relative to the UST market.
The forward expectation handicapping continues, but this is a very different HY cycle than past downturns with the UST curve and inflation handicapping driving so much of the risk pricing reactions in a BB heavy HY market.
We see spreads in HY as quite tight from various angles, which we discuss in other publications. The absolute OAS in historical context and relative to the risk free and lower risk alternatives do not stack up well vs. history and medians (see HY Credit Spreads: Migration, Medians, and Misdirection 11-6-23). That said, HY spreads overall are a long way from the peaks of earlier credit cycles. It is hard to shake them from a fundamental standpoint. They have tightened materially across the year from year end 2022 (+481 bps ICE) to the current +399 bps. We had expected HY OAS to get shaken by now from such tights, but this has not happened.
Update on UST curve segment slopes…
Each week, we pick a few UST curve slopes to update. This week we look at 2Y to 5Y, 5Y to 10Y and 10Y to 30Y. We are basically breaking the curve into subsegments that roll up to the more common focus on 2Y to 10Y and 2Y to 30Y. Last week we weighed in on the 3M to 5Y UST and the 3M to 10Y as short UST securities at 5% handles still draw a crowd. The ability to quickly extend in a push-button world is another angle on the March run on the banks. It does not take too much effort to roll into positions out the curve.
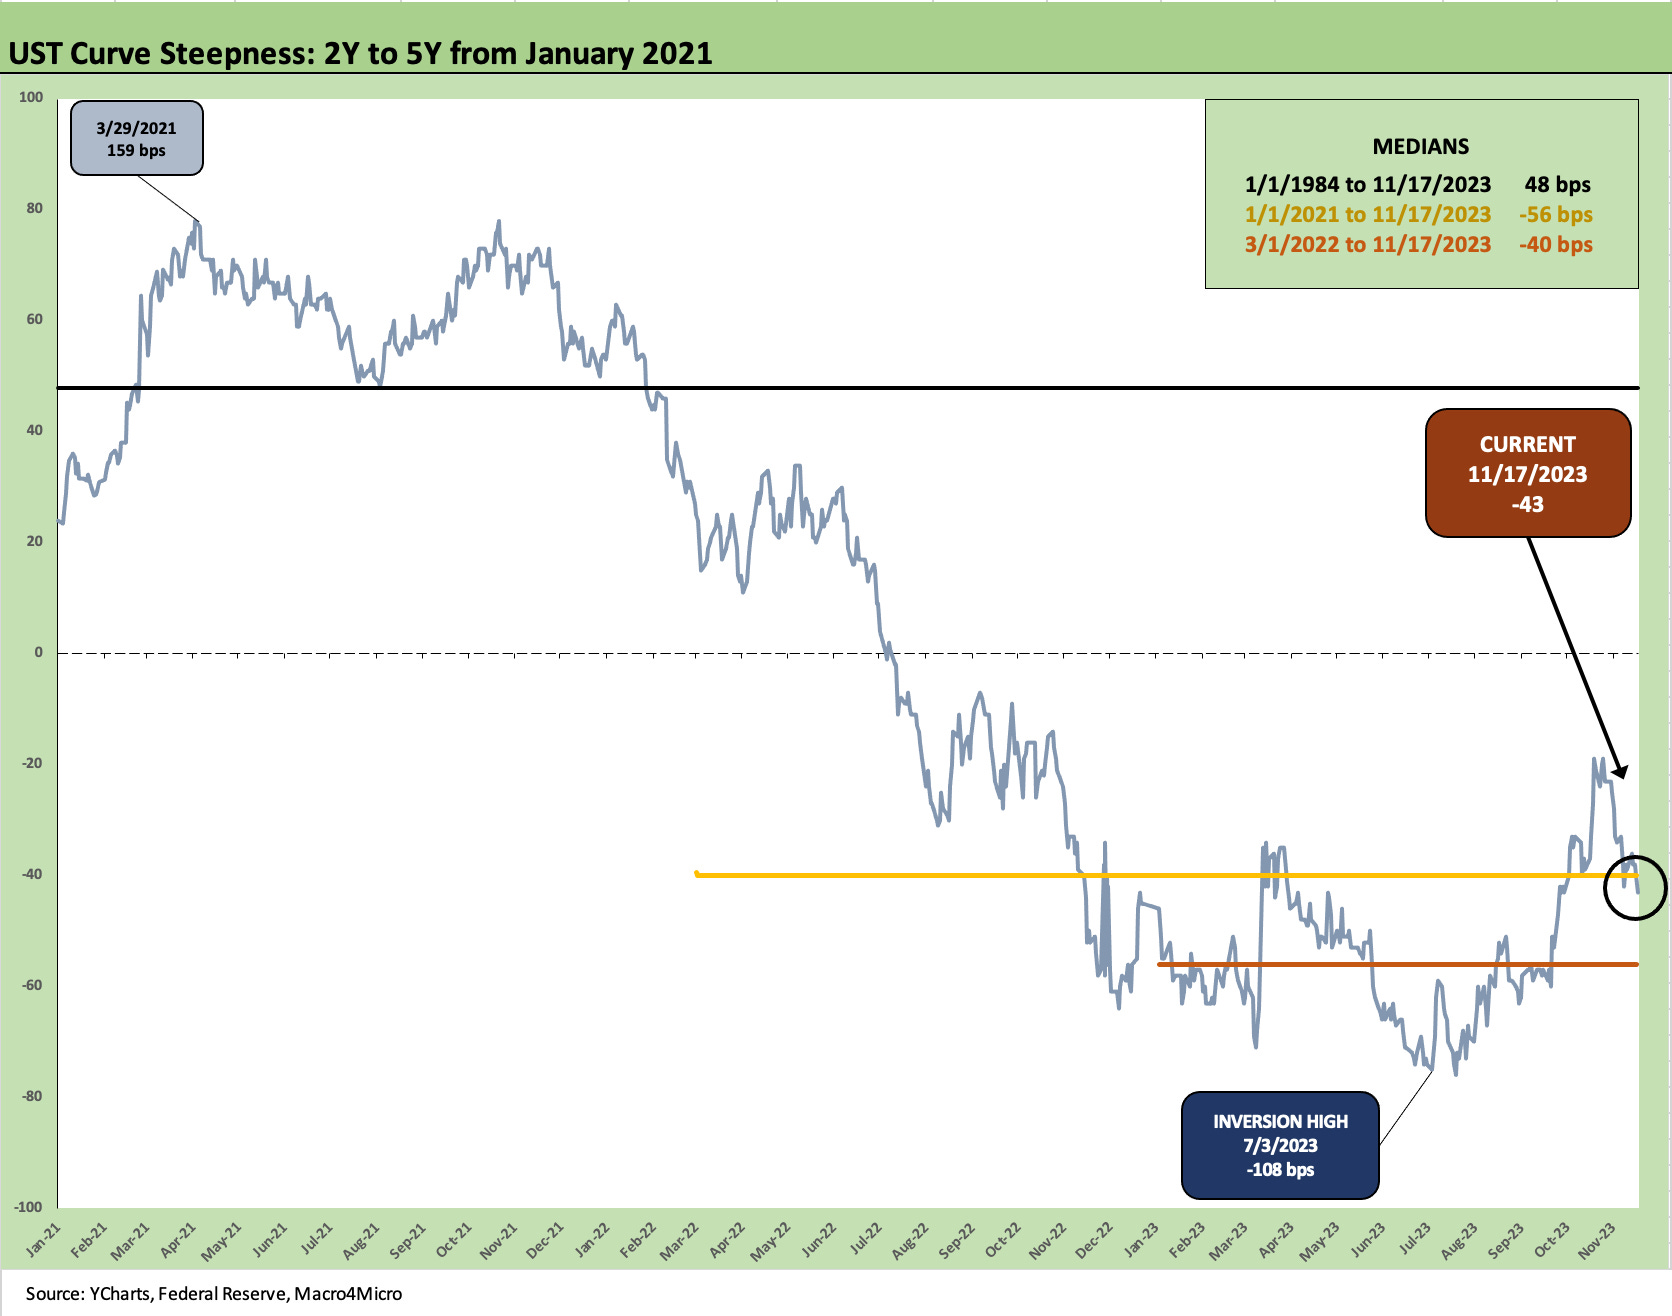
The above chart frames the 2Y to 5Y slope since the start of 2021. We also drop in the short-term medians and long-term medians in the upper right of these charts. The inversion is still very much in place above even if cut in half from the peak inversion of July 2023. The upward slope peaked for this time horizon back in March 2021 at +159 bps as inflation was gearing up for a wave and the UST market reacted accordingly. The Fed stayed on hold, and they catch hell in the commentary for that delay in tightening.
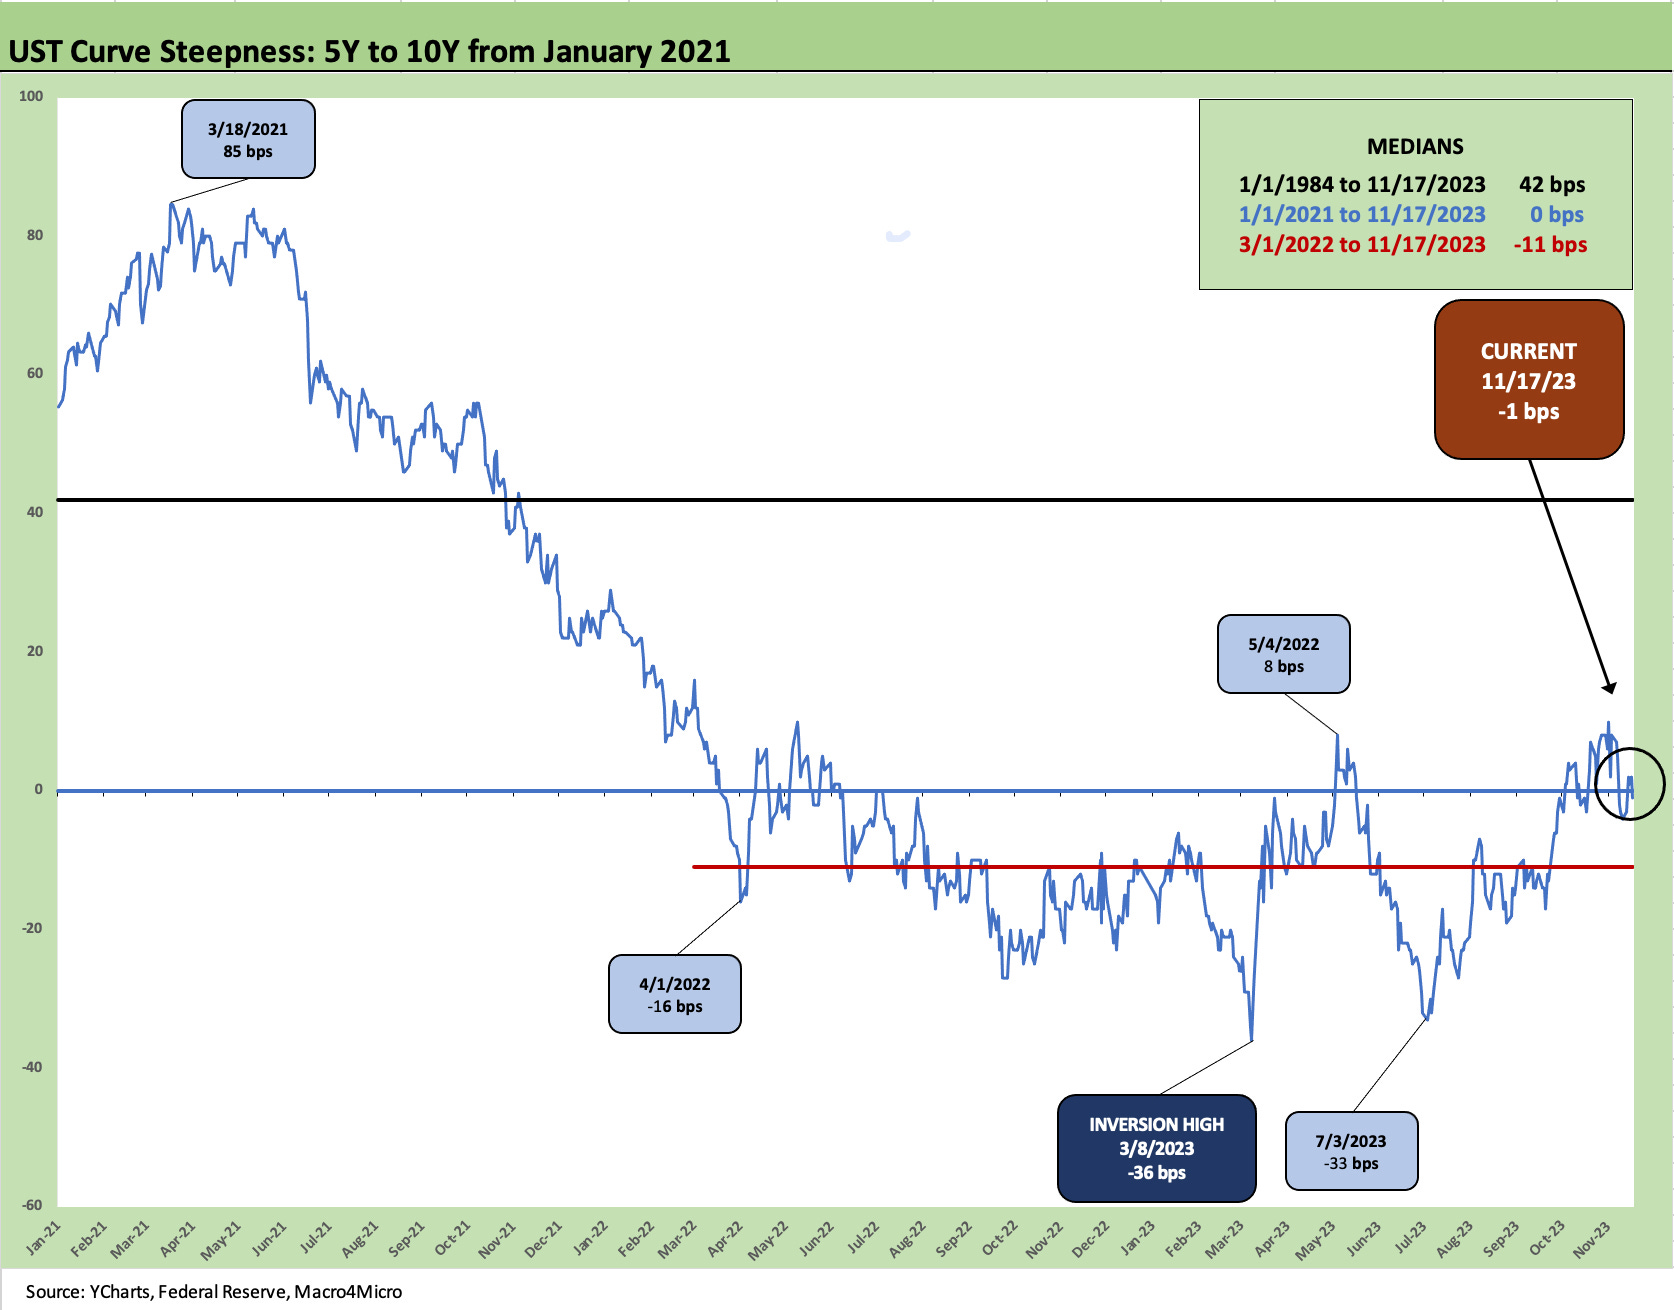
The 5Y to 10Y is hanging around flat and back to spring 2022 levels after cracking into upward sloping in October. The timeline median from 2021 is flat, the segment median is modestly inverted (-11 bps) since the tightening cycle began, but the long-term slope median is +42 bps. The theory is you should get paid more in spreads as you extend into a 10Y from a 5Y both for credit risk and should get more in yield for the duration risk. At least that’s the theory.
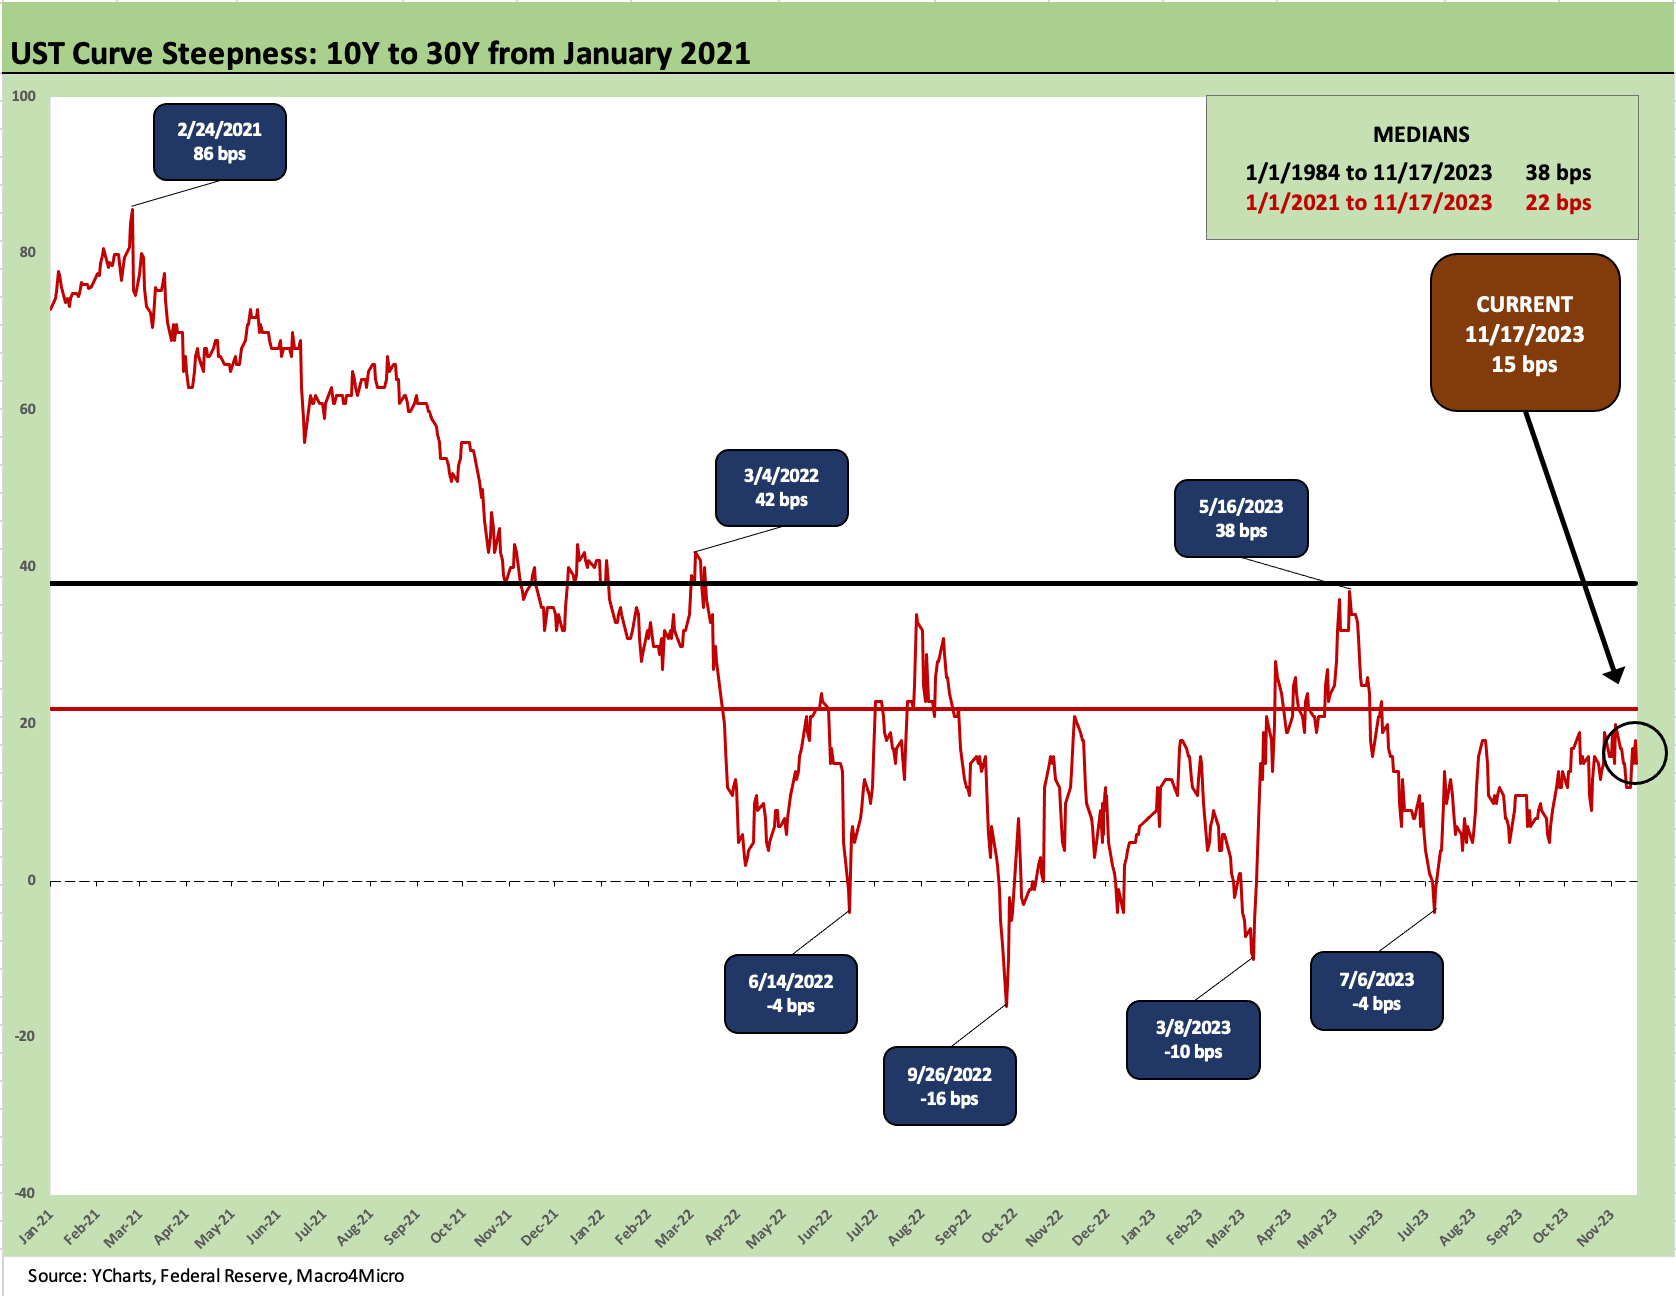
The above chart shows the 10Y to 30Y is back to upward sloping as the market has been feeling the duration effects in this tightening cycle. The current 10Y to 30Y is the closest of the segments to its long-term median slope. We see an upward sloping 10Y to 30Y at +15 bps now vs. the long-term median of +38 bps and recent post-Jan 2021 median of +22 bps.
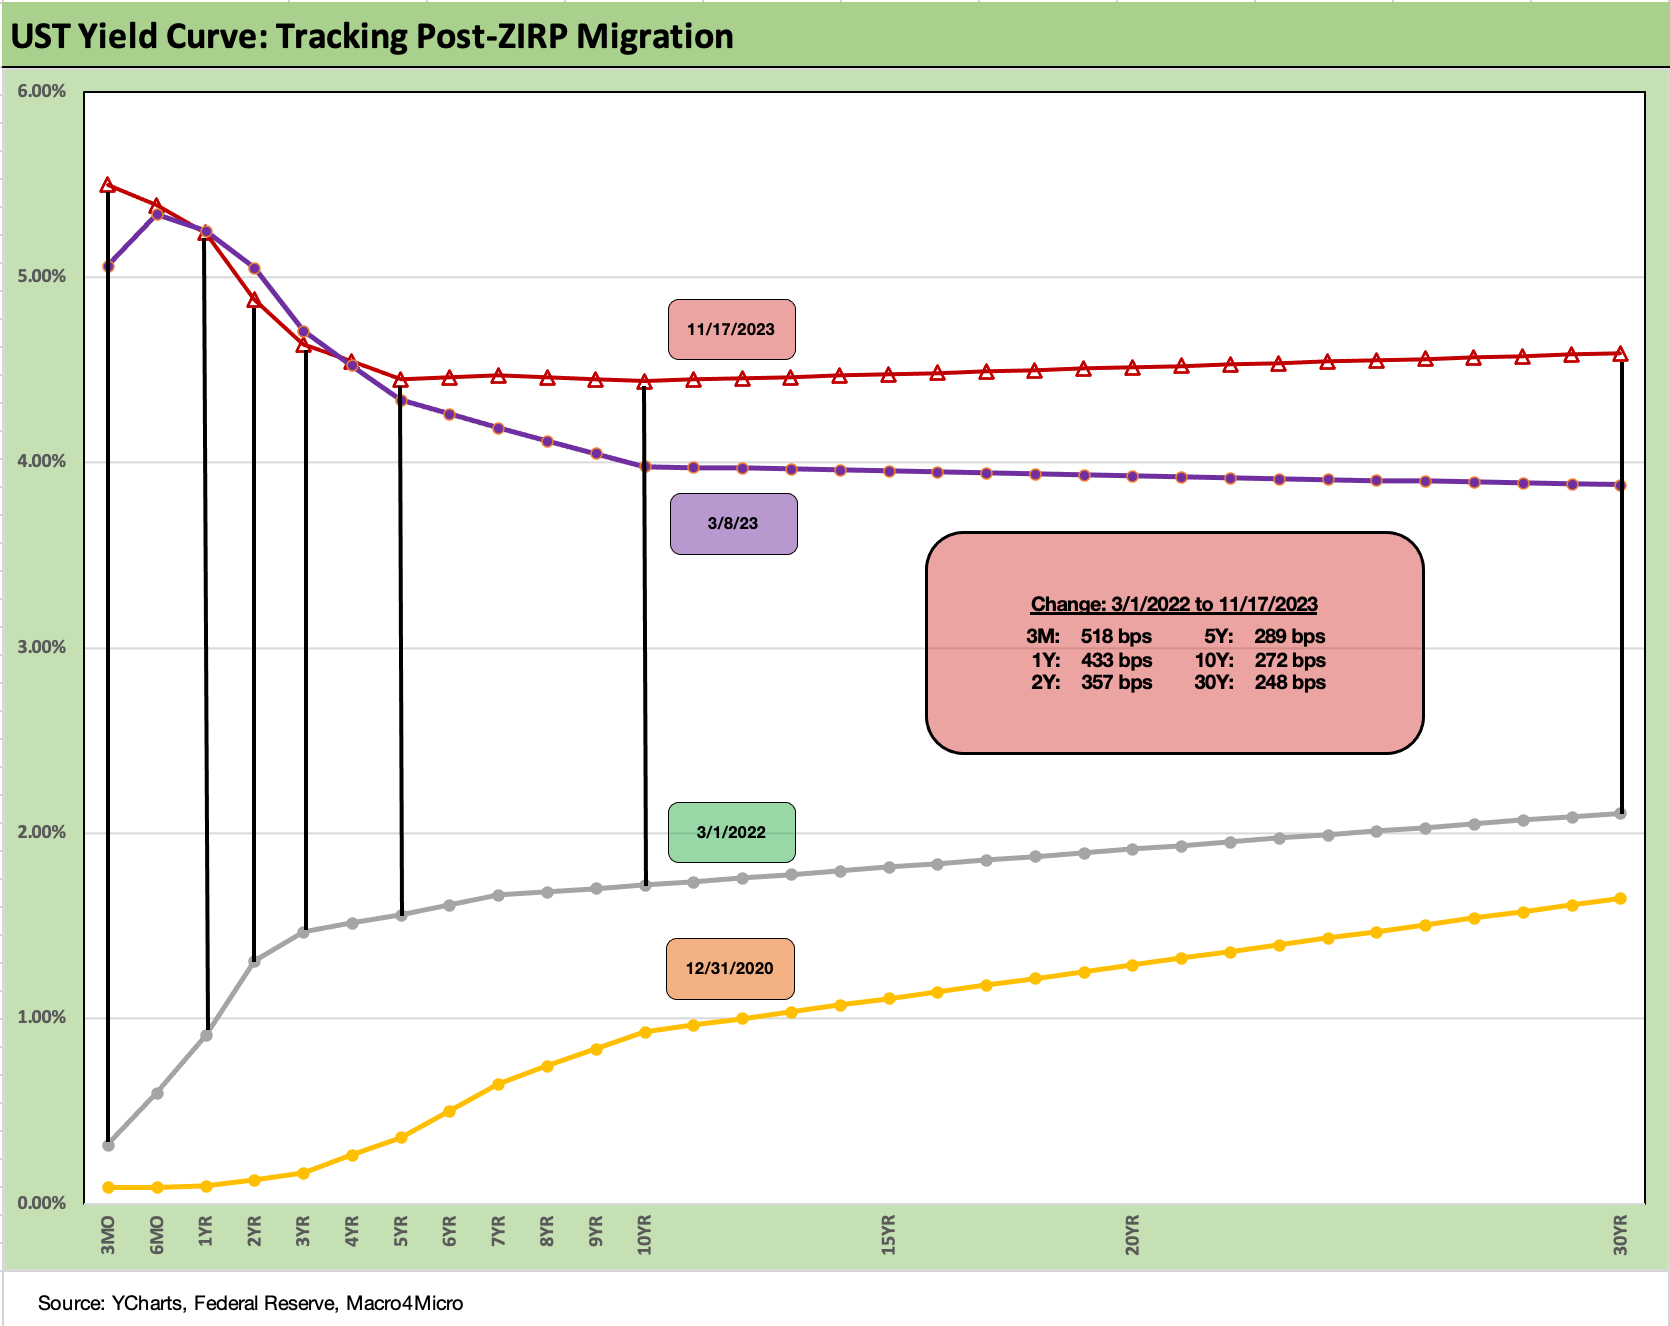
We wrap with our usual final chart where we break out the upward shift from the start of March 2022, the month that ZIRP ended. We also include a 12-31-20 UST curve for a frame of reference. The journey from upward and steep into a bear flattening and finally a steep inversion from the front end is now showing a flatter curve again beyond the 5-year UST.
We post the cumulative UST migration differentials since March 1, 2022, in the box. As a frame of reference on how quickly the curve moved, we can look back at the 10-20-23 differentials from that Footnotes publication. There we see the 5Y differential at +330 bps (-41 bps lower on 11-17-23), the 10Y at +321 bps (-49 bps lower), and 30Y at +298 bps (-50 bps lower on 11-17-23).
The 2023 wild finish…
As we head into year end, the UST rally will keep asset allocation strategists debating (with others and with themselves) with inflation trending favorably. The question is how to play that inflation dynamic against what is increasingly looking like a steady but not hot set of economic fundamental indicators.
Meanwhile, the Fed will keep making hawkish speeches and the world will spend more time googling Arthur Burns (1970-1978 Fed Chair) and why Powell wants to be the kinder, gentler Volcker rather than the Burns flop. Greenspan has been tagged by history with planting the credit crisis seeds with extra fertilizer (and a hand in the TMT bubble), so Powell has a shot at some post-term honors in the modern era rankings.
Powell will be looking to his post-Fed years to take some credit for saving the credit markets in 2020 (assist from Mnuchin) and heading off recession forces (2023). His quick action in March 2023 may also may have saved numerous regional banks even if the jury is still out on what comes next there in the asset quality cycle.