
October Existing Home Sales: Searching for Lows
Existing home sales see another round of declines with median prices higher.


The existing home sales numbers once again show the lowest numbers since 2010 but firm prices are riding on the back of extremely low inventory levels.
The volumes fell by -4.1% sequentially with YoY volumes at -14.6% vs. Oct 2022 and 3 of 4 regions lower with only the Midwest flat.
The NAR cited the fact that 1/3 of homes sold above their list price with entry level and the mid-priced tier holding in well in bidding.
The median sales prices show a new all-time high for the month of October and the median price rose in all 4 regions.
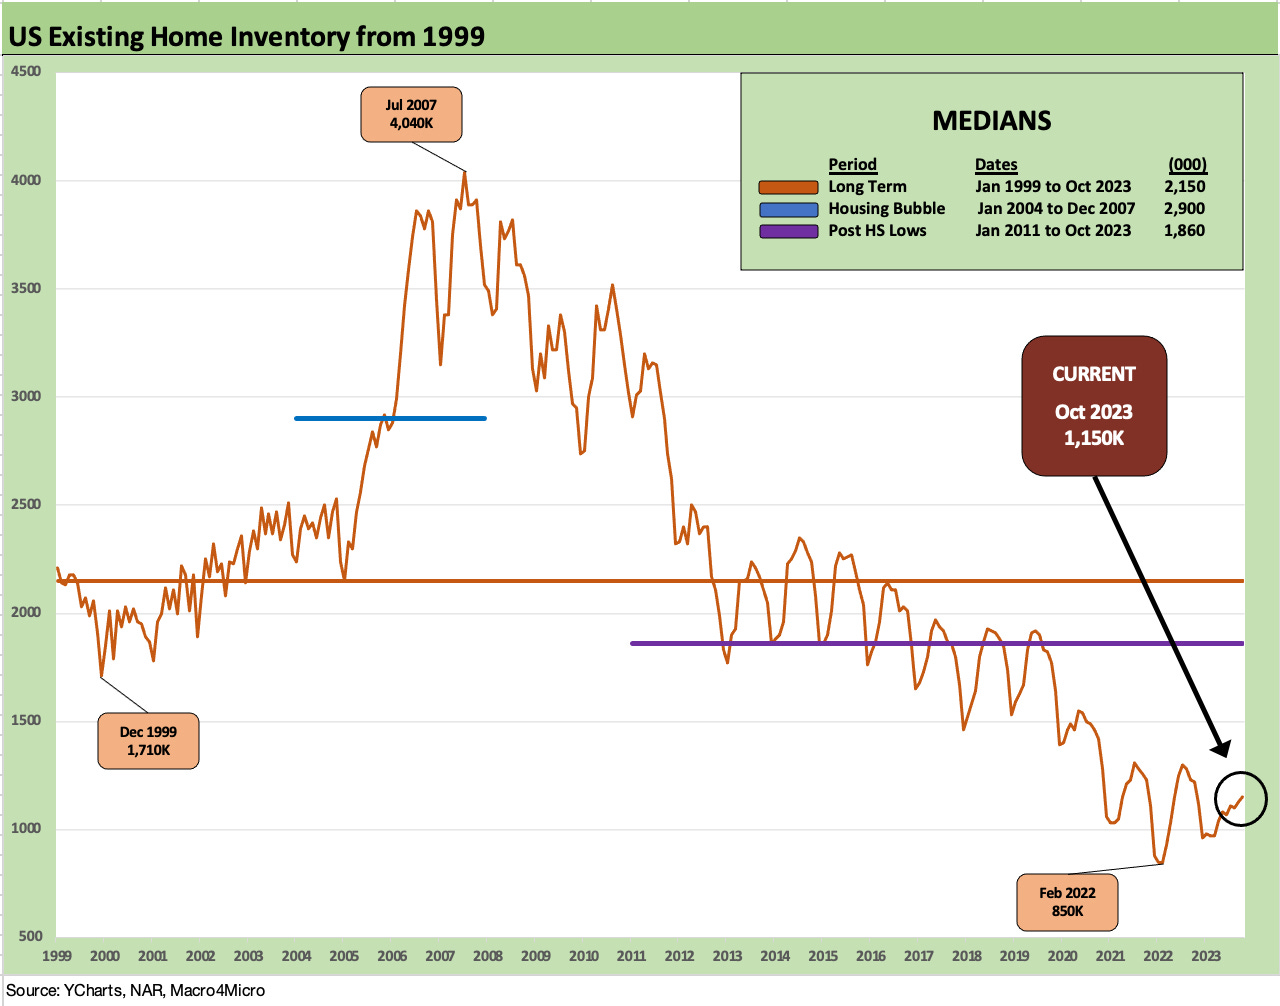
The existing home sales market remains in a very strange state with volumes painfully low, prices firm and even higher. Inventory continues to serve as the stabilizing factor in a rebounding economy that is showing record payroll numbers while the threat of recession is more a speculative exercise than evident in jobs and wage trends. The inventory number detailed above of 1.15 million is up +1.8% sequentially but is low enough by region to keep prices solid as demographics and demand drive the uptick in prices.
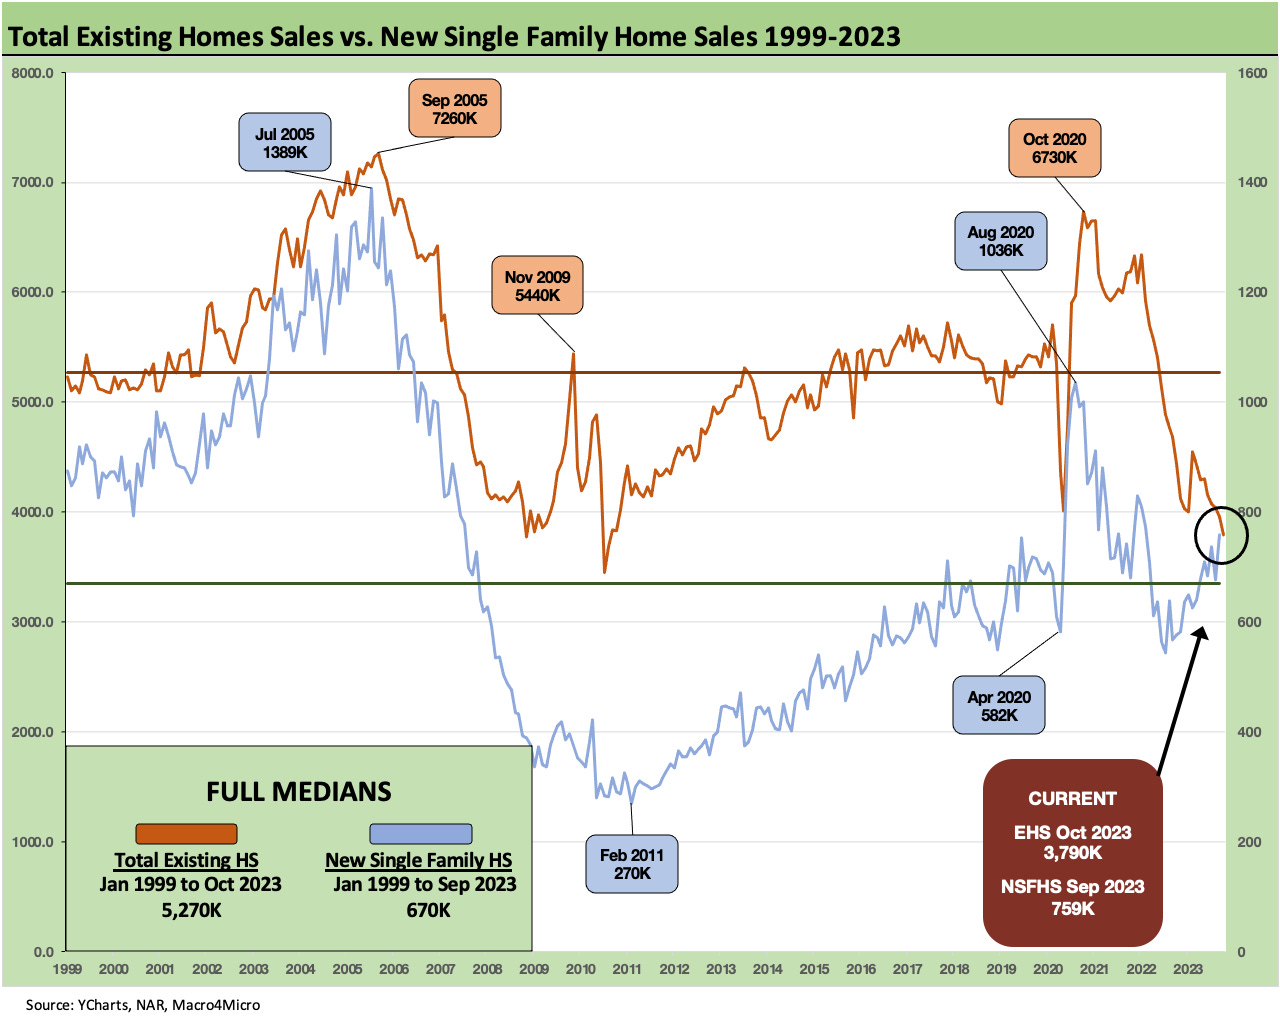
The above chart plots new single family homes sales vs. existing home sales as we revisit the recurring theme of the mix shift toward new home sales. The new home sales numbers for Oct 2023 get released next week.
The builders have many tools at their disposal to provide inventory and offer products that fit the buyers’ needs and price range. The builders can step in with financing offers and mortgage buydowns to keep winning the game. The sweet spot of buydown rates is in the high 5% range according to major builders. Existing home sales do not have such options and face the golden handcuffs problem hindering sellers.
The decline in mortgage rates to 7.4% from last month’s 8% scare (see Sept Existing Home Sales: The 7% Solution Running Low 10-19-23) can only do so much given that the monthly payment sticker shock will not be going away in the 7% handle range with so many 3% and 4% handle mortgages prevalent in the homeowner market.
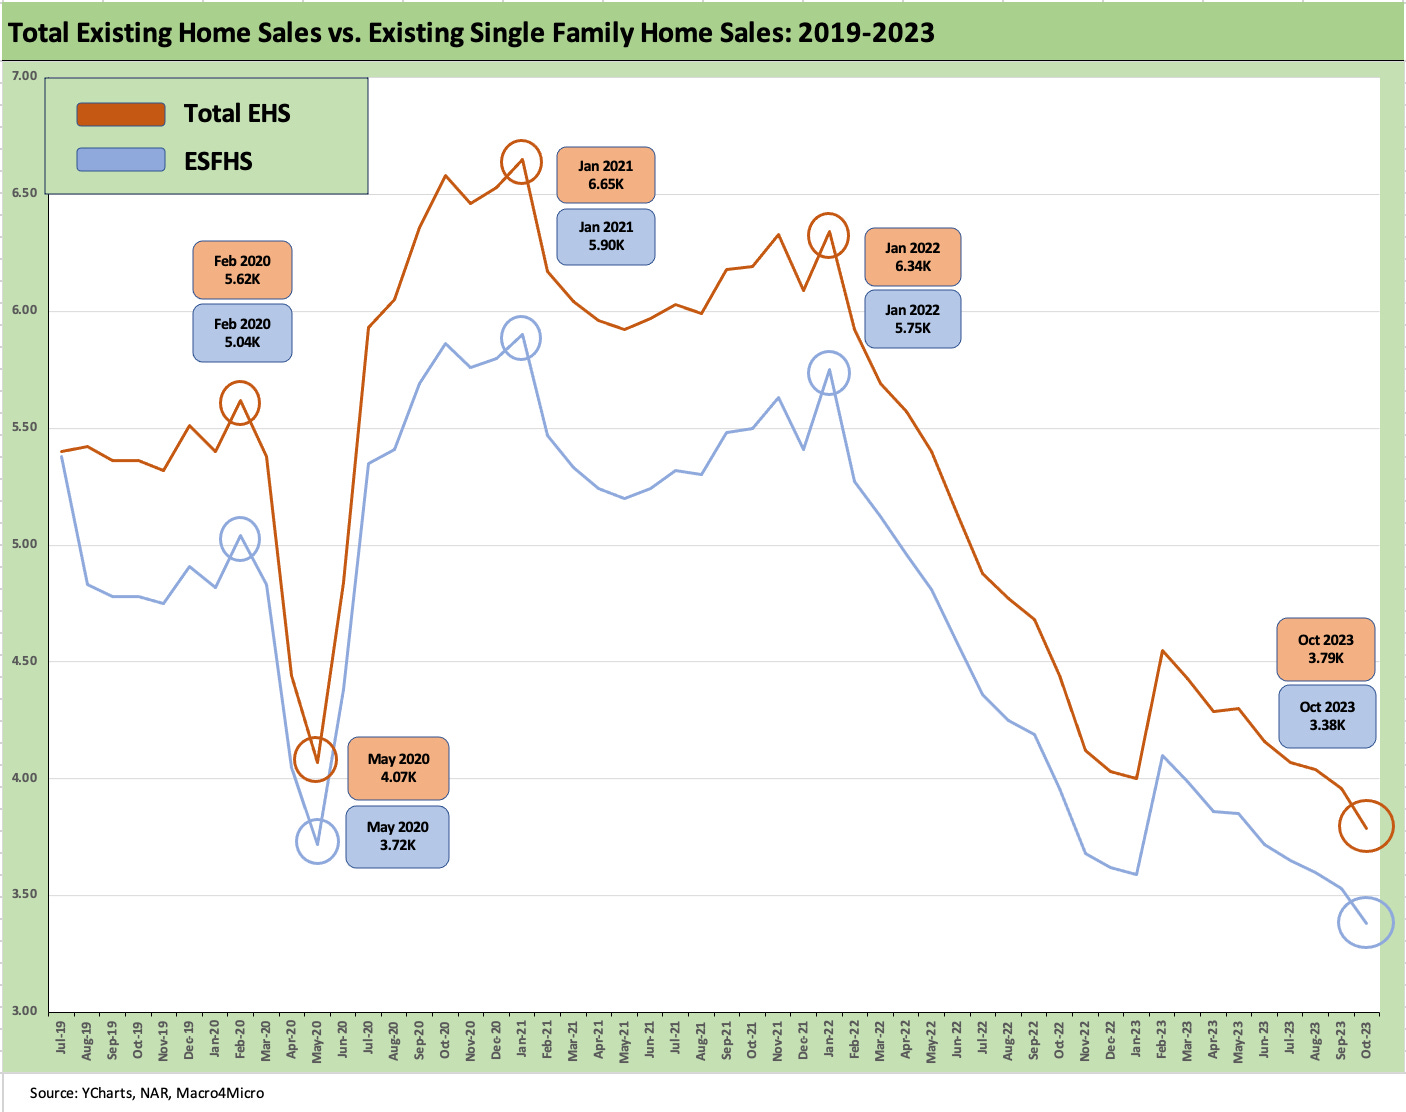
The above chart frames the time series for total existing home sales (including single family, townhouses, condos, and co-ops) vs. just the existing single family homes. The two lines offer some nuance on the same broad trend – as in low supply and low activity in historical context. For Condos and Co-op data, volumes are well below the 2021 peak run rate of 707K for that year.
Condo and Co-op sales in October were down -2.4% sequentially and down -14.6% YoY. Sales prices for Condos/Co-ops were +7.6% YoY to $356K. For an example of the high end, the West posted median prices of $511K. The low end was the Midwest at $247.6K. Prices across the regions were all higher YoY.
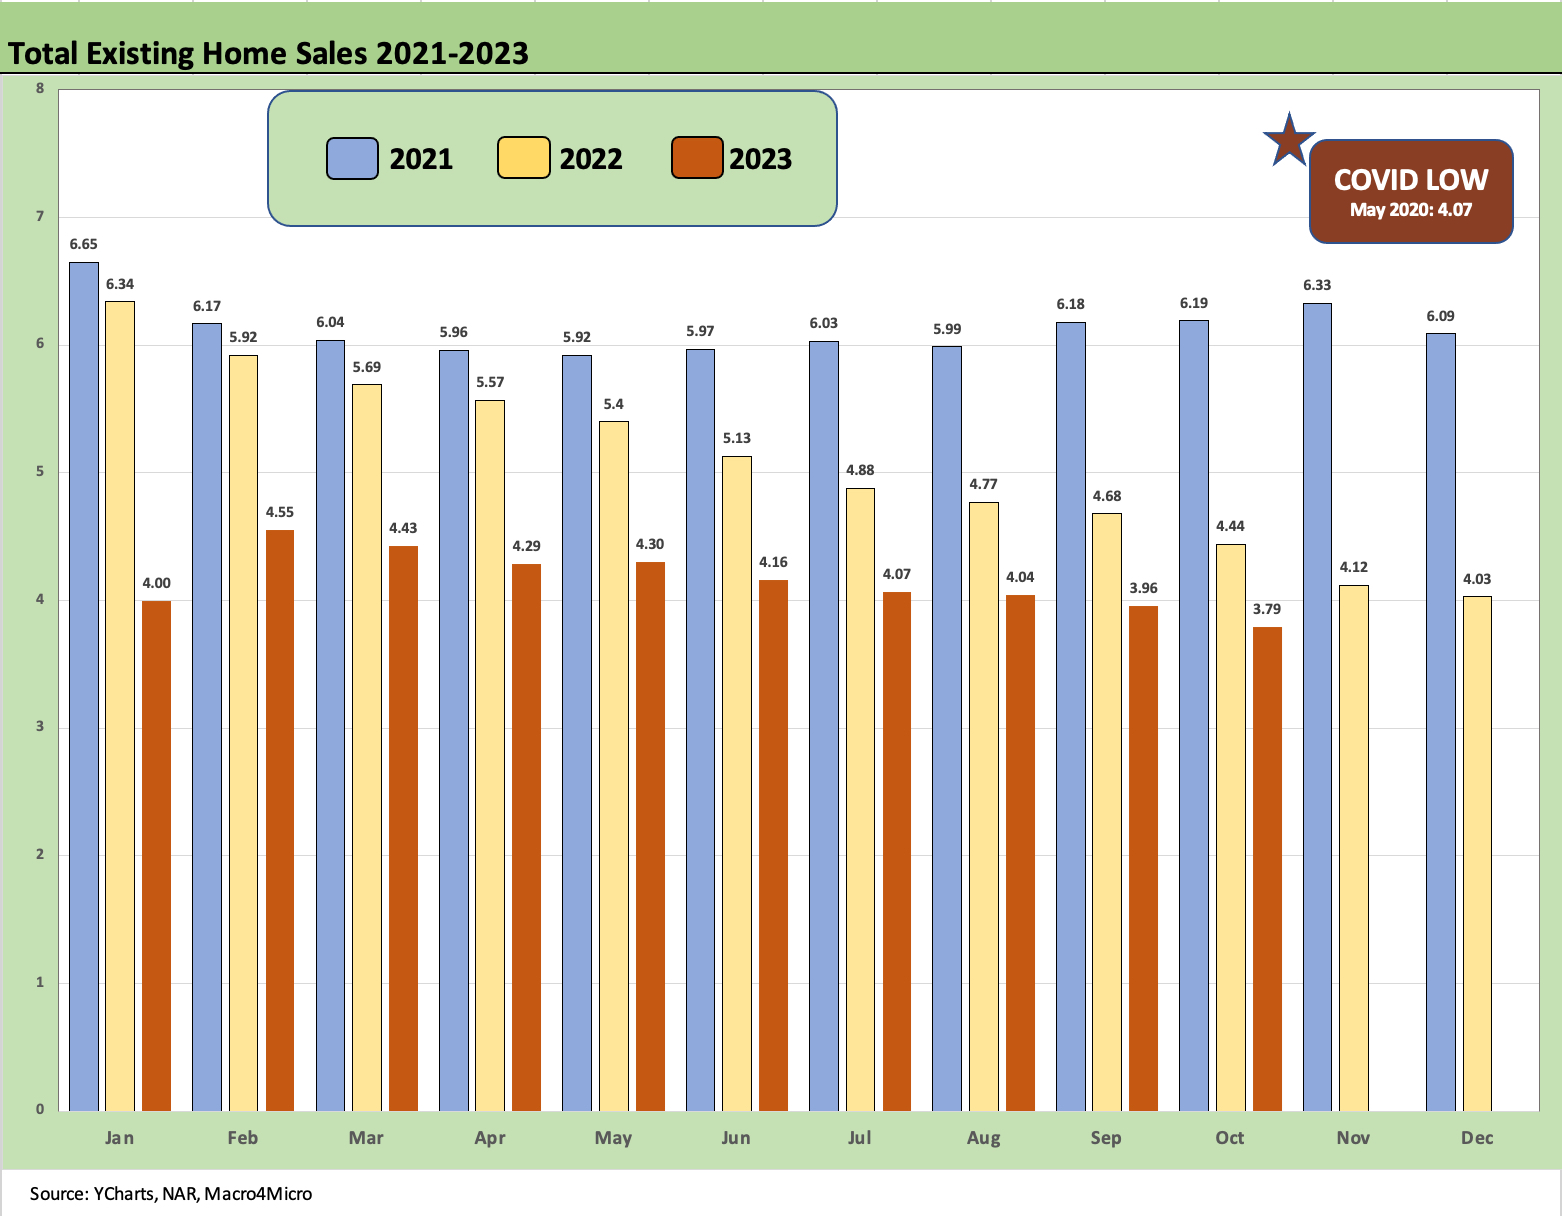
The above chart shows the monthly existing home sale volumes. We now see the multiyear low with the comparisons getting back to the 2010 bottom of existing home sales and the weakest months of the 2008 financial crisis.