
October CPI: The Big 5 Buckets and Add-Ons
We look at a good news month for CPI as the needle moves to the cusp of a 3% handle on core inflation.


The 3.2% headline YoY CPI was a marked sequential improvement from 3.7%, and the 0.0% monthly CPI in Oct (vs. 0.4% in Sept) offers a jolt of optimism.
The Services lines (in a Services economy) will remain the toughest to crack with Services ex-Energy at +5.5% YoY and Total Services +5.1%.
In some of our favorite “CPI ex” lines, we see CPI ex-Shelter at +1.5%, CPI ex-Energy at +3.9%, and “All items less food, shelter and energy” at +2.0%.
The UST curve and equity markets went straight into celebration mode with the better CPI numbers. Headline was more impressive than the move in Core. Even drilling into the line items, there is room to find for more optimism in some of the metrics, but the nagging and lagging progress in Services will be the main pushback from UST curve bears (that and a seriously off-the-charts UST borrowing need).
As we go to print, we see the 5Y UST down over 20 bps, the 10Y UST down 17 bps, and 30Y over 12 bps. The S&P 500 at a +2% handle and NASDAQ crossing the +2% line to 2.4%. That is the logical reaction in light of recent market swings.
The Big 5 CPI Buckets
Below we update our breakdown of the major CPI buckets across Food, Energy, Shelter, Automotive, and Medical CPI that comprises 75% of the CPI Index. We then look at some other line items that disproportionately impact households in budgets and the general consumer psyche.
The good news is progress from last month (see September CPI: Big 5 Buckets and Add-Ons 10-23-23) with Energy lines being the main driver of the headline decline at -2.5% in Energy for Oct 2023 and -4.5% YoY. New and used vehicles went into negative price mode for the month with new vehicles at -0.1% for the month (+1.9% YoY) but used vehicles at a hefty -0.8% decline for the month and -7.1% for the YoY deflation effect.
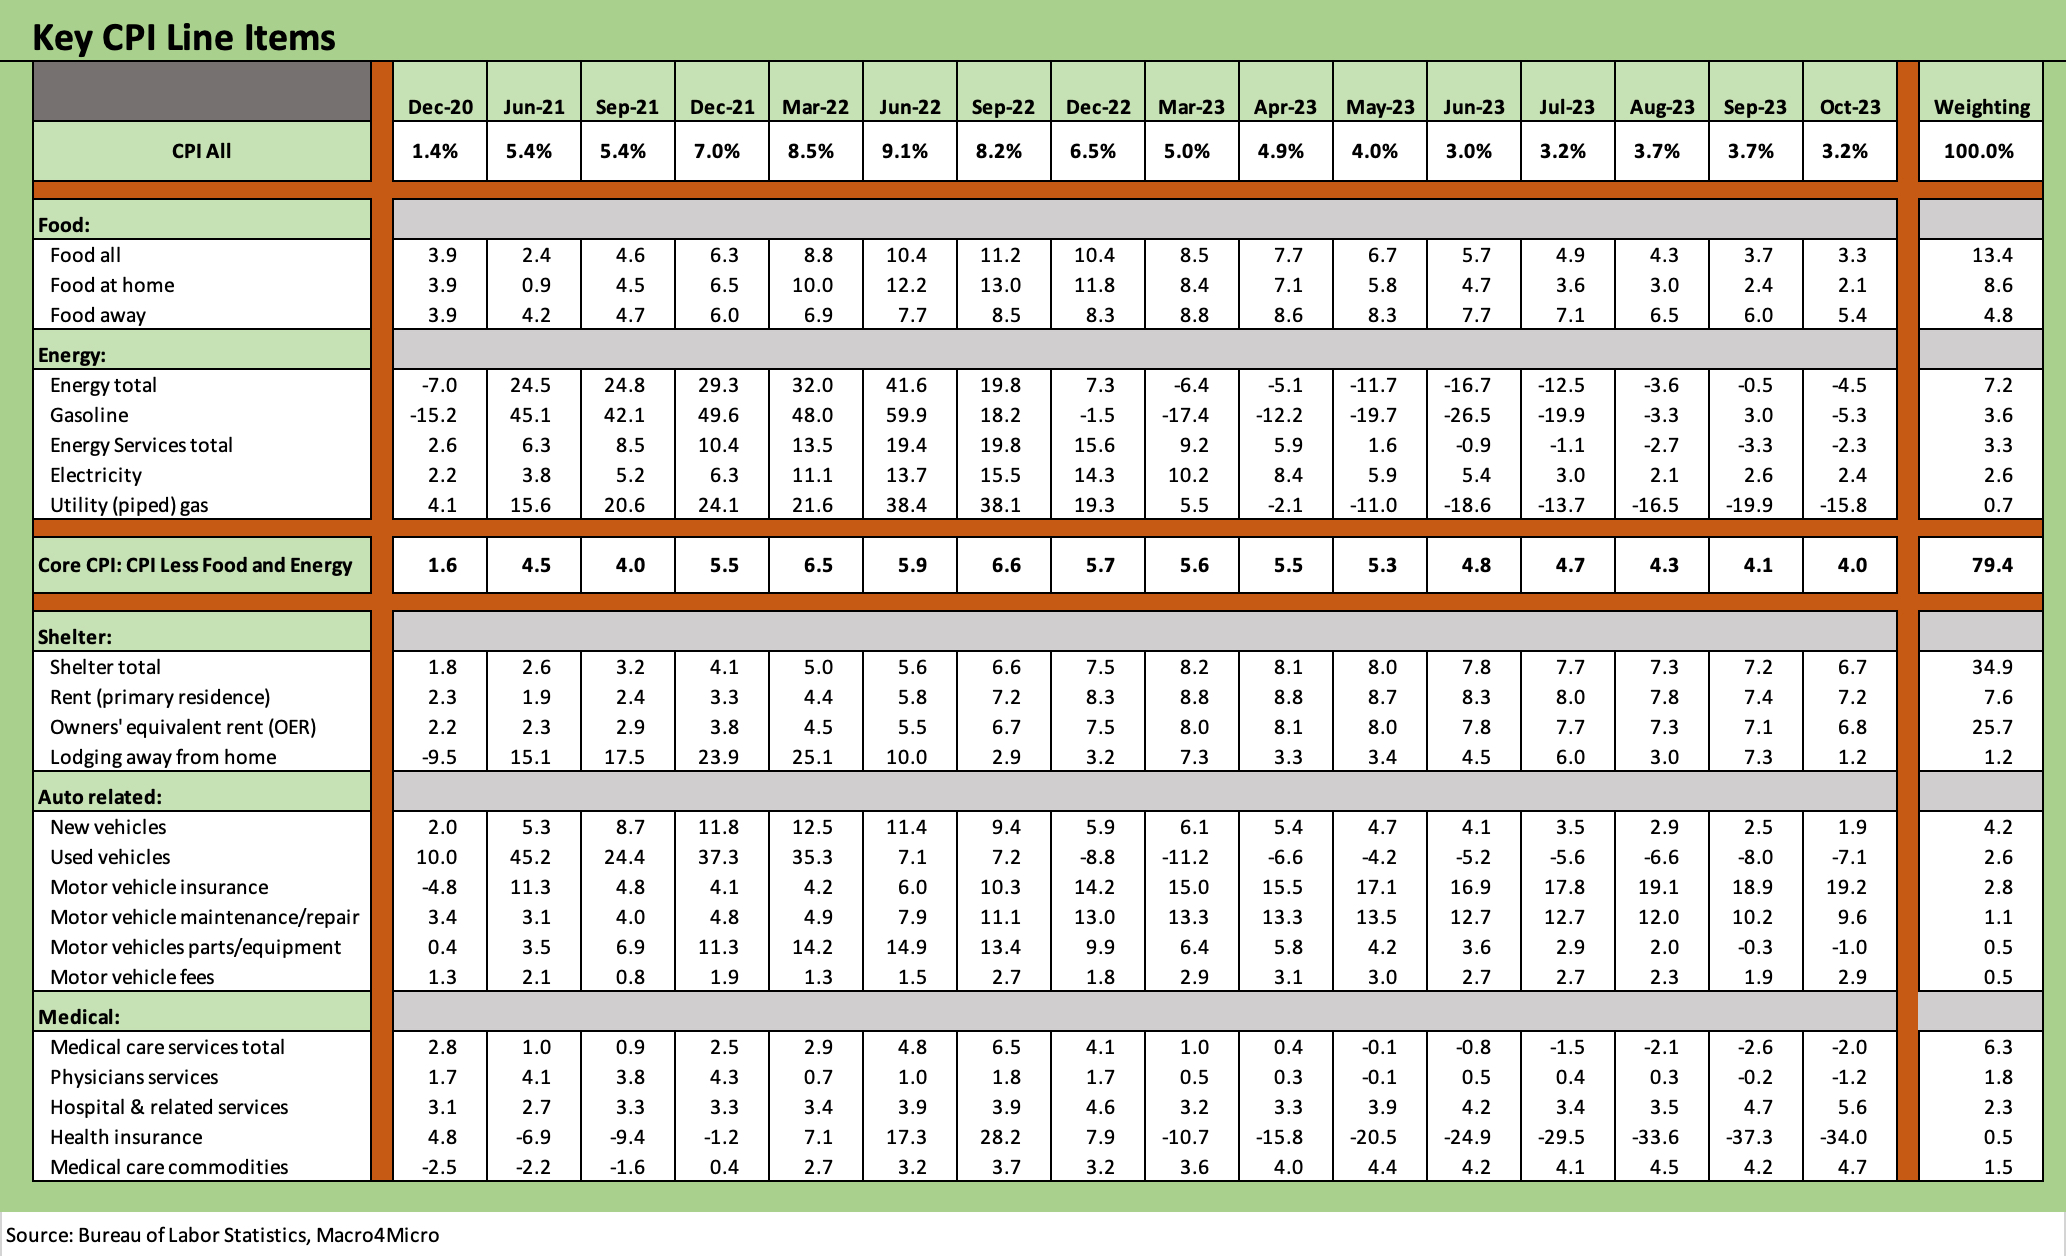
The Big 5 is something we started using a while back to capture the critical drivers of the headline CPI Index numbers. The headline number had struggled to move lower with tougher YoY comps as we got further past the summer of 2022 peaks, but Food and especially Energy have been trending favorably after the 2022 Russia-Ukraine oil and gas shock.
Oil is notoriously volatile and was declining sharply the past month as the Israel-Hamas clash did not escalate into Iranian missteps. Core CPI still needs to push through the headwind costs such as higher labor even as more onerous financing costs flow into goods and services.
Among notable trends that roll up into the consumer menu but not shown in the above chart, we see the Durable Goods line in deflation mode at -2.1% YoY and -0.5% for the month. Nondurables weighed in at +1.7% YoY and -0.7% for the month, so those both go into the good news buckets.
“Services less rent of shelter” was +3.0%, which we see as a useful metric given the array of economic asterisks around the value of the Shelter CPI metric (almost 35% of the CPI index) that we have raised so many times (we will spare you this month).
Looking across the Big 5 shows sequential progress in that Shelter line even if it is still overstated vs. high frequency national rent metrics. Within Autos, the Maintenance line and especially the Insurance line underscore the rising cost of owning a vehicle. Auto financing also has spiked with the tightening cycle. There is no relief there. The UAW contract will demand more flow through of costs or the Detroit 3 will eat the difference. There is going to be bad news for someone along the chain from suppliers to OEMs to dealers to customers.
Medical care inflation metrics stay in check despite the focus on what new health insurance CPI metrics might mean. The Health Insurance treatment under CPI has something in common with the Shelter metrics not only for lagging effects but also for lacking a direct tie to the cash in/cash out life of the consumer in the trenches. That is a story for another day.
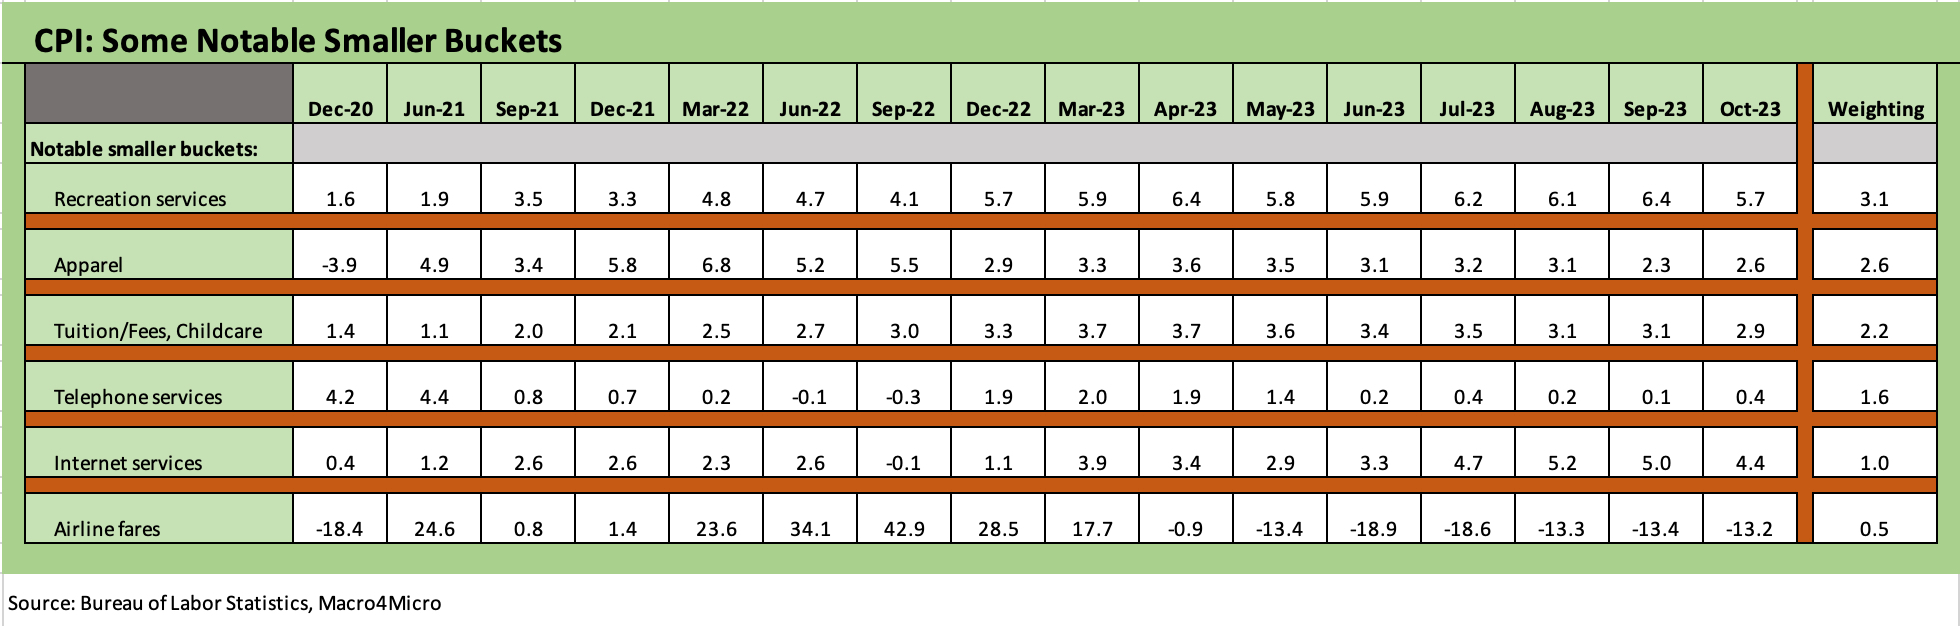
The above chart details some high-profile line items that add 11% more to the mix and bring the total CPI index share of the Big 5 plus “Add-Ons” to around 86% of the index. We see 2 higher and 4 lower sequentially for the YoY CPI trend. Recreation Services declined to 5.7% YoY from the 6% bracket on strong leisure and recreation activities. The leisure boom flowed into hiring and soaring travel this past peak vacation season (peak driving and peak flights). Telephone CPI started ticking higher again to +0.4% from +0.1 % last month, but Internet ticked lower to +4.4% from +5.0%.
Overall, a good news headline beats a bad news headline in a market where many consumers will still feel annoyed at the overall menu basket and smaller purchasing pie they have since 2021. Food at home is a much-diminished problem at +2.1% from 13.0% noted above in Sept 2022, and Energy goes a long way to helping on the freight and delivery and ag operating costs flow-through effects. For many households who shop the aisles, they still know what it all “used to cost.”
In a political year, the “used to cost” factor is fraught with peril for the “guys in charge.” The stock market and UST curve should react one way, but the enthusiasm factor might not spread to the political realm. President Ford found out running against Carter (my first voting election) and Carter found out against Reagan.
A big difference in 1976 was that the US was coming off its longest recession since the Great Depression. The 1980 election was coming off a recession that was the first leg of a double dip recession. That first one ended “officially” in July 1980 per NBER before the second leg post-election recession in July 1981 (see Business Cycles: The Recession Dating Game 10-10-22).
Volcker was at the helm, for both Carter and Reagan, taking the yield curve to the woodshed. Today, the running growth rates on the economy and term-to-date economic performance beats Trump, Obama, and Bush. We have not seen an inflation cycle flowing into an election cycle where the cloud of a recession was not there. Reagan had some time ahead of the 1984 election, but Carter and Ford were screwed. Biden’s polls are in the tank, and inflation is vying with age as the first two words out of many mouths.
The question is whether just the market cares about 2% vs. 3% handles on CPI into 2024 but not the voters. Many consumers’ dim view on inflation may be embedded and that means that there is no countering the inflation factor with current numbers and what could be a 2% CPI by election day. Other issues will need to take the lead. There is no question that the stock and UST markets care.