
Pulte: Relative Value Meets “Old School” Coupons
We look at Pulte in relative value in context and frame peer group statistics on revenues, market caps, and ASPs.


We put Pulte in the context of the major homebuilder names in credit as PHM offers a mix of high coupons that are hard to find in the peer group after the refi and extension waves of the ZIRP and QE years.
The overwhelming majority of homebuilder sector market cap and revenue is now in the BBB tier with even more builders deserving upgrades as they prove their mettle during a painful tightening cycle and UST shift.
We see PHM as an easy overweight although for many it is more a “hold tight” name in their portfolio with high coupons to clip and favorable make-whole protection.
For some peer group perspective, we look at the rankings of the builders by revenue, market caps, and average sales prices (ASPs) from their most recently reported quarter as the building sector is now overall a high grade subsector for the publicly traded companies.
Relative value commentary on PHM: We see PHM bonds as the best relative value of the BBB tier builder pack on the combination of quality, spread and coupon. PHM also offers a better alternative for income-oriented portfolios given its bond mix. The PHM high coupon and longer dated maturity selection stand out in the pack relative to names such as DHI and NVR with a collection of 1%, 2%, and 3% handle coupons. DHI and NVR are both stronger credits, but PHM wins on relative value.
We like the PHM 6% handle bonds closer to par levels due 2033 and 2035. Those holding the PHM 7.875% premium bonds due 2032 (109 price handle at last price indication 11-14-23) are well set to clip coupons and watch the wheels of time (and UST curve shapeshifting) unfold. The par weighted coupon level in the BBB tier is currently 4.3% and in US HY 6.0%. These bonds were issued back in the early years of the new millennium and carry punitive make-wholes. The prospectuses for these deals are in the 2002 and 2003 time frame (we chased them down), so these legacy bonds have been sitting on the books for two decades.
PHM does not need to issue for refi purposes (absent an acquisition) and in fact appears to be nibbling at bond buybacks on the 5% handle bonds of 2026 and 2027. The ability to build cash and balance its financial policies with shareholders and a defensive financial profile is very much in place. PHM repurchased $700 mn in shares YTD 2023 after $975 mn in YTD 3Q22.
We provide more detail on Pulte fundamentals in one of our related commentaries (see Credit Crib Notes: PulteGroup 11-15-23)
The homebuilder industry story line has been favorable for both bonds and credit…
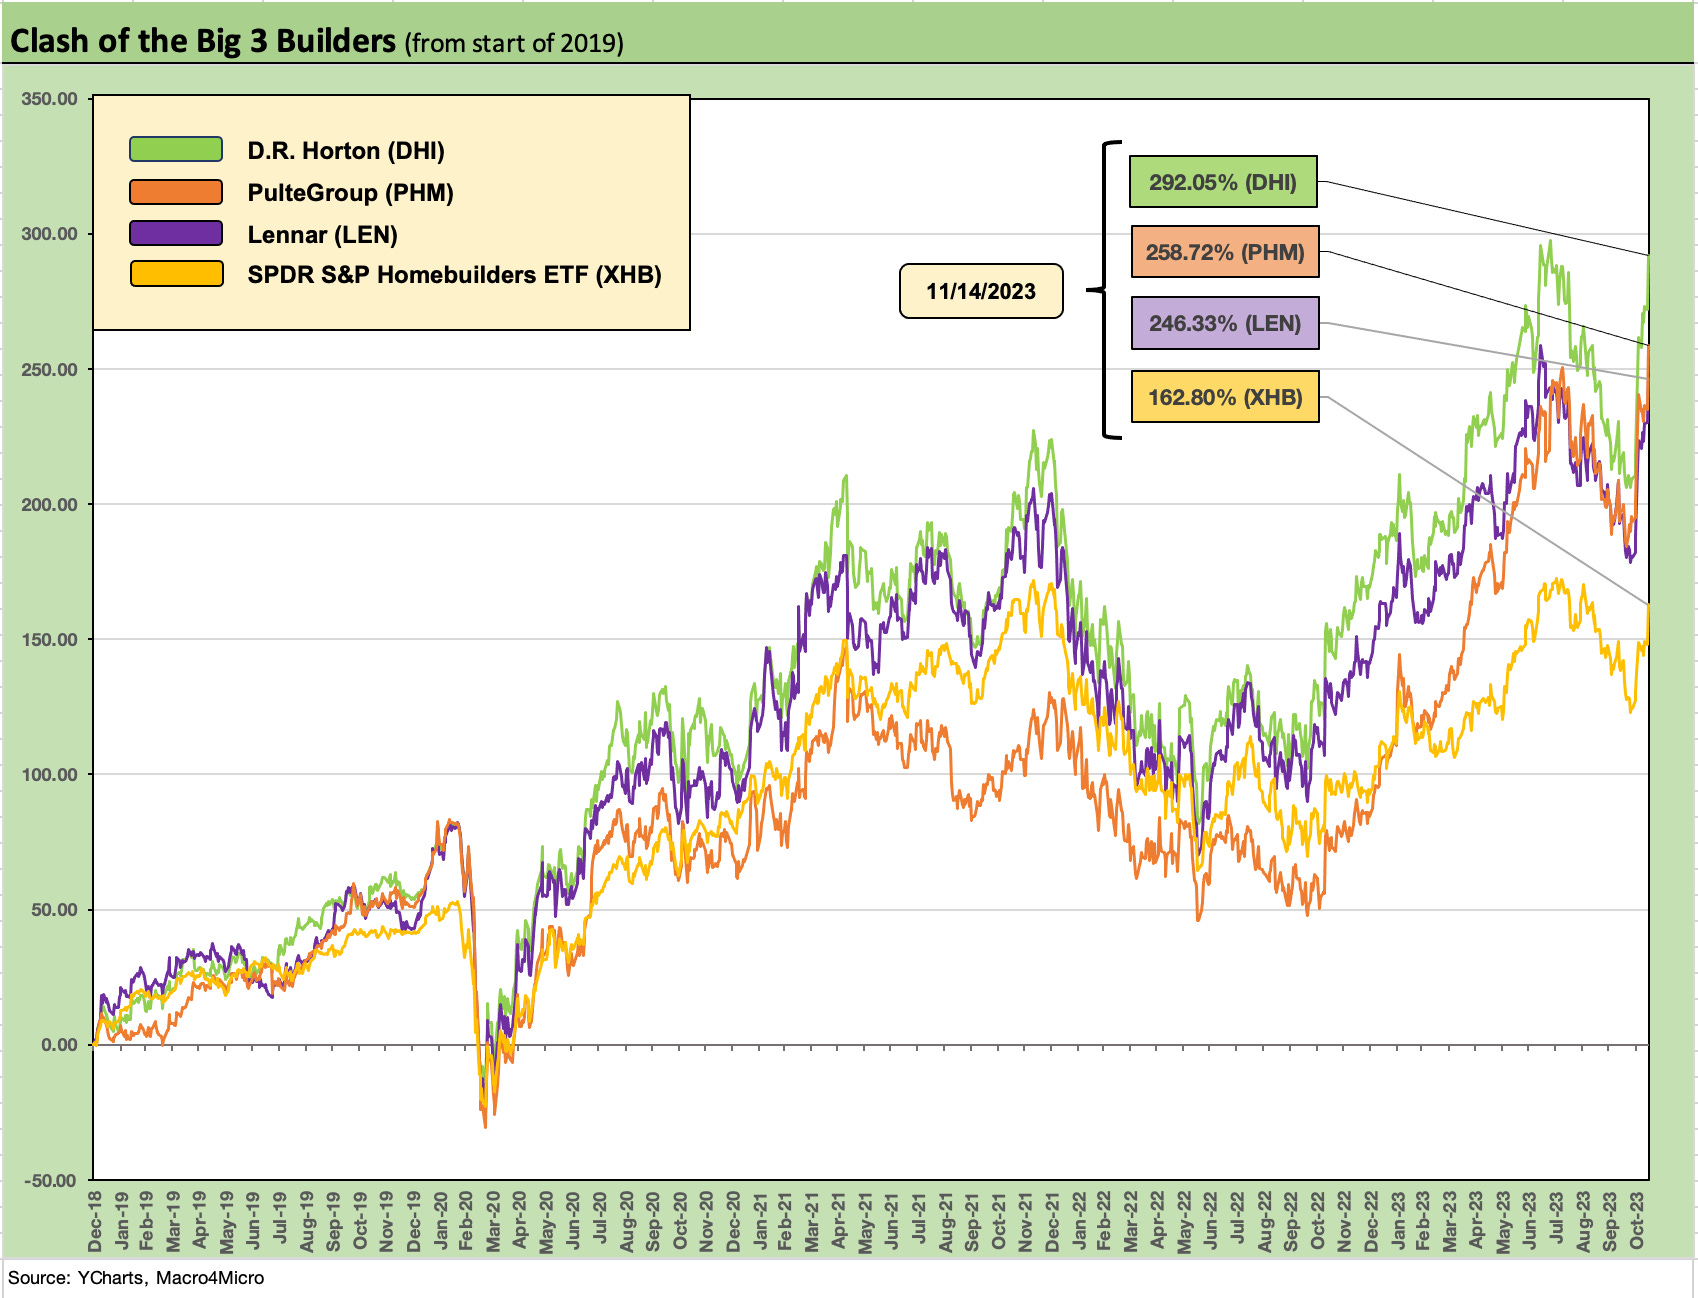
The Big 3 of the builders are BBB tier names with very favorable relative stock performance vs. broad market benchmarks whether capitalization weighted or equal weighted. The above chart frames the returns from the start of 2019 during a period when the easing by the Fed in 2019 and return to ZIRP and QE with COVID did wonders for housing prices, home equity balances, household cash flow on refinancing, and builders and real estate brokers.
In the new world of high mortgage rates, the builders are still getting dealt a winning hand on supply-demand of available housing inventory even though high mortgage rates are squeezing out many buyers at the entry level and narrowing move-up alternatives. The performance of builder securities and steady improvement in financial profiles in such a market was not a consensus view as the pain of 2022 unfolded.
The sensitivity of builders to moves in the UST curve is intuitive, and the performance yesterday (11-14-23) offered a headline reminder with PHM stock at +7.1% and the Top 5 builders up an average of +5.9%. Smaller names rose even more with the most entry-level sensitive names such as LGI Homes at +11.3%. The financially strained small cap credits such as Beazer (BZH) at +9.7% and Hovnanian (HOV) at +10.6% rallied even more than the major names. The peer group of 15 builders added over $8 bn of market cap on the day (11-14-23).
That sensitivity to rates comes with an asterisk, however, since the swing factor is supply and demand and pricing power and the ability of the builders to fill demand that existing home sales cannot satisfy (see Sept Existing Home Sales: The 7% Solution Running Low 10-19-23).
The story of the builders the past two cycles has been a very convoluted one in the aftermath of the housing bubble and subprime RMBS meltdown. The financial resilience of the builders was somewhat lost in the translation as all the turmoil (asset quality, counterparty risk, etc.) emanating from the housing crisis almost brought down the global financial system.
What should also have stood out in all the mess was that the typical builders had a working capital management cycle and base of semi-liquid assets that could be pledged or wound down and liquidated into cash. Only the weakest operators and/or most leveraged folded. It was certainly the wrong time to be a good operator with an LBO (e.g., Willliam Lyon, now part of THMC).
The fact that so few of the major builders financially collapsed should have been the takeaway in what was a period of extreme distress for housing broadly from developers to mortgage lenders and investors in mortgages. The major builders saw very few Chapter 11 cases among the leading builders even if we saw them execute on more than a few coercive debt exchanges in a zero sum game to reward shareholders.
That housing crisis was a real-life stress test for builders, and they showed the various failsafe transition steps they could take as they ratcheted down ahead of the eventual recovery. That seems like a world away now, but the builders with their variable cost structure and financial flexibility held in much better than many high fixed cost manufacturers (autos and suppliers are obvious example).
That history is one reason why so many leading builders have kept their balance sheets so strong and used their cash flow strengths to expand where opportunities existed, acquire along the way, and buy back stock. They learned a few lessons as well.
At this point, we see single A tier quality balance sheets (with BBB tier ratings) in an industry that has now essentially become an IG industry issuer base. The Top 5 builders by sales of the 15 publicly traded issuers that we watch are BBB tier. The 7 IG names of the 15 overall account for around ¾ of peer group sales. In terms of market cap, we see BBB tier builders account for over 85% of the equity market cap for the peer group.
We look at the lineup and rankings in some of the charts below.
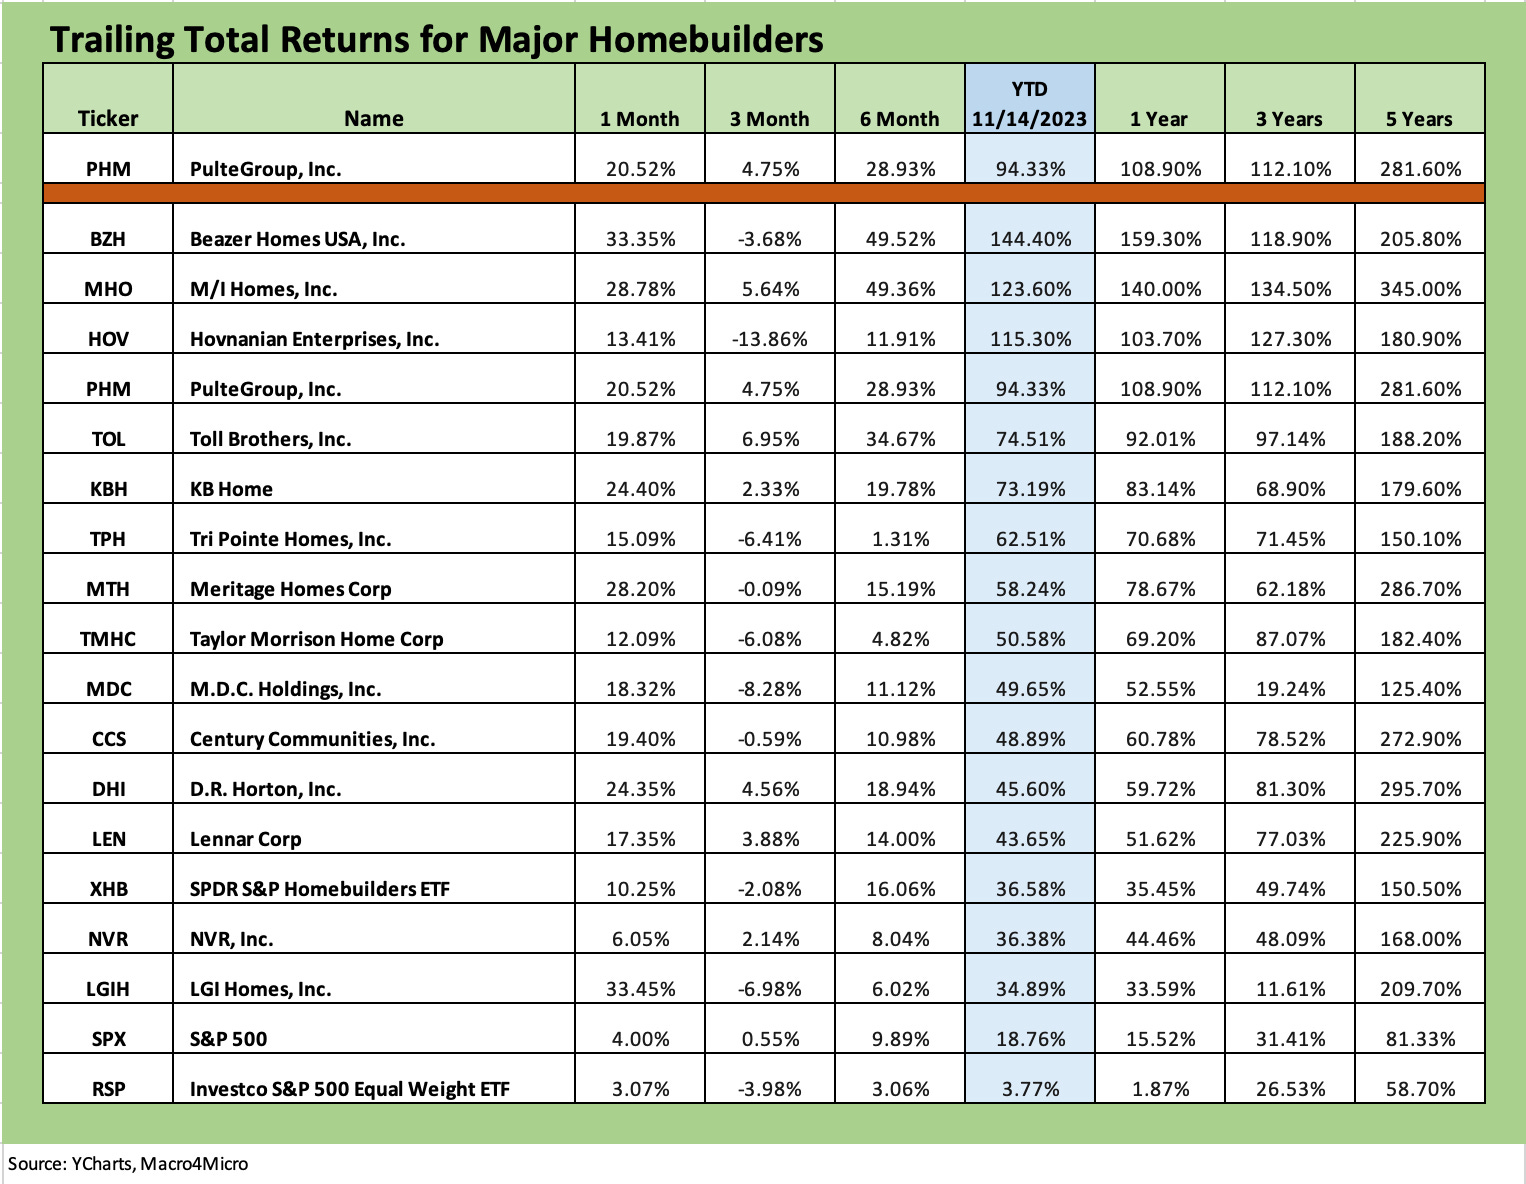
The above chart breaks out the equity performance story across the 15 publicly traded builders we watch. We list Pulte at the top and then place PHM again in the table based on its YTD return ranking in the pack. We drop in the XHB Builder ETF that includes a major share of major supplier chain builders in its securities mix. We also include the S&P 500 and the equal weighted S&P 500 ETF (RSP) for some additional frames of reference.
For the YTD period, PHM is the best performer of the larger names with Toll just behind it. The industry is showing broad strength going into and coming out of the COVID years.
Below we add some size context and price tier information to help frame the checklist of peers.
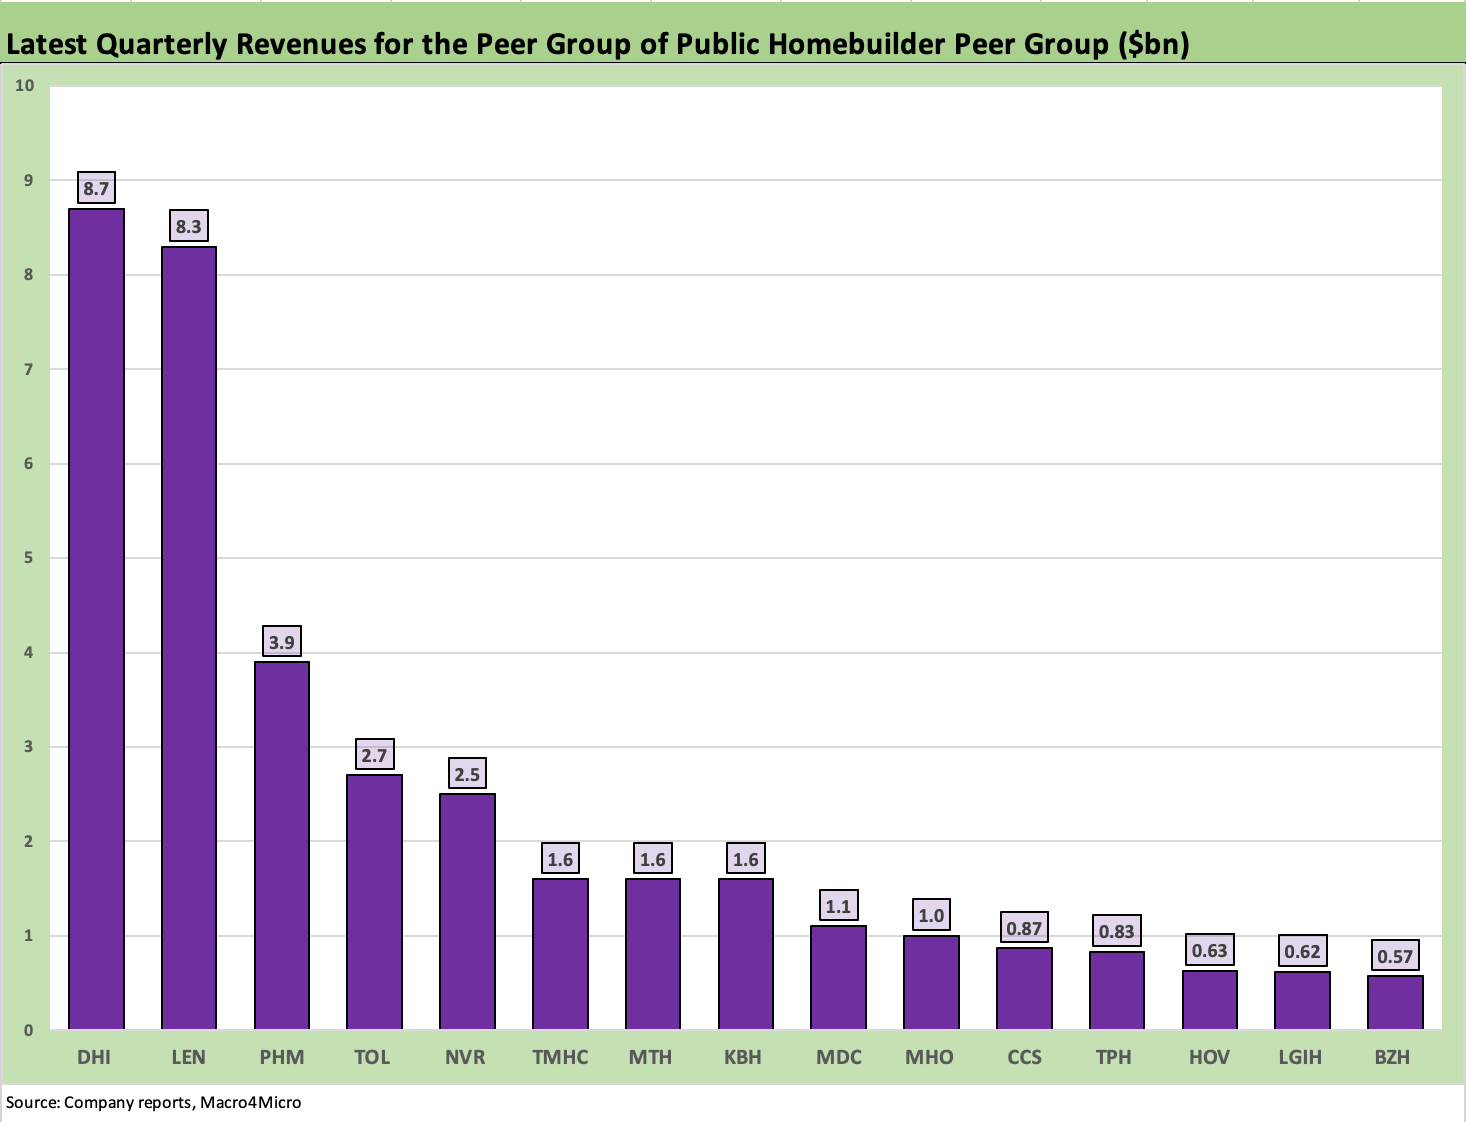
The above chart takes the most recently reported quarterly homebuilding sales numbers and lines them up by height. The positioning of D.R. Horton (DHI) and Lennar (LEN) make a statement on how much they have grown vs. the pack via organic growth or organic growth plus M&A (notably Lennar in acquisitions) since the credit crisis.
The BBB tier names include the Top 5 of DHI, LEN, PHM, TOL, and NVR plus MTH and MDC. The natural question is whether the industry will see more consolidation to gain scale and market breadth for the smaller names. That is a topic for another time.
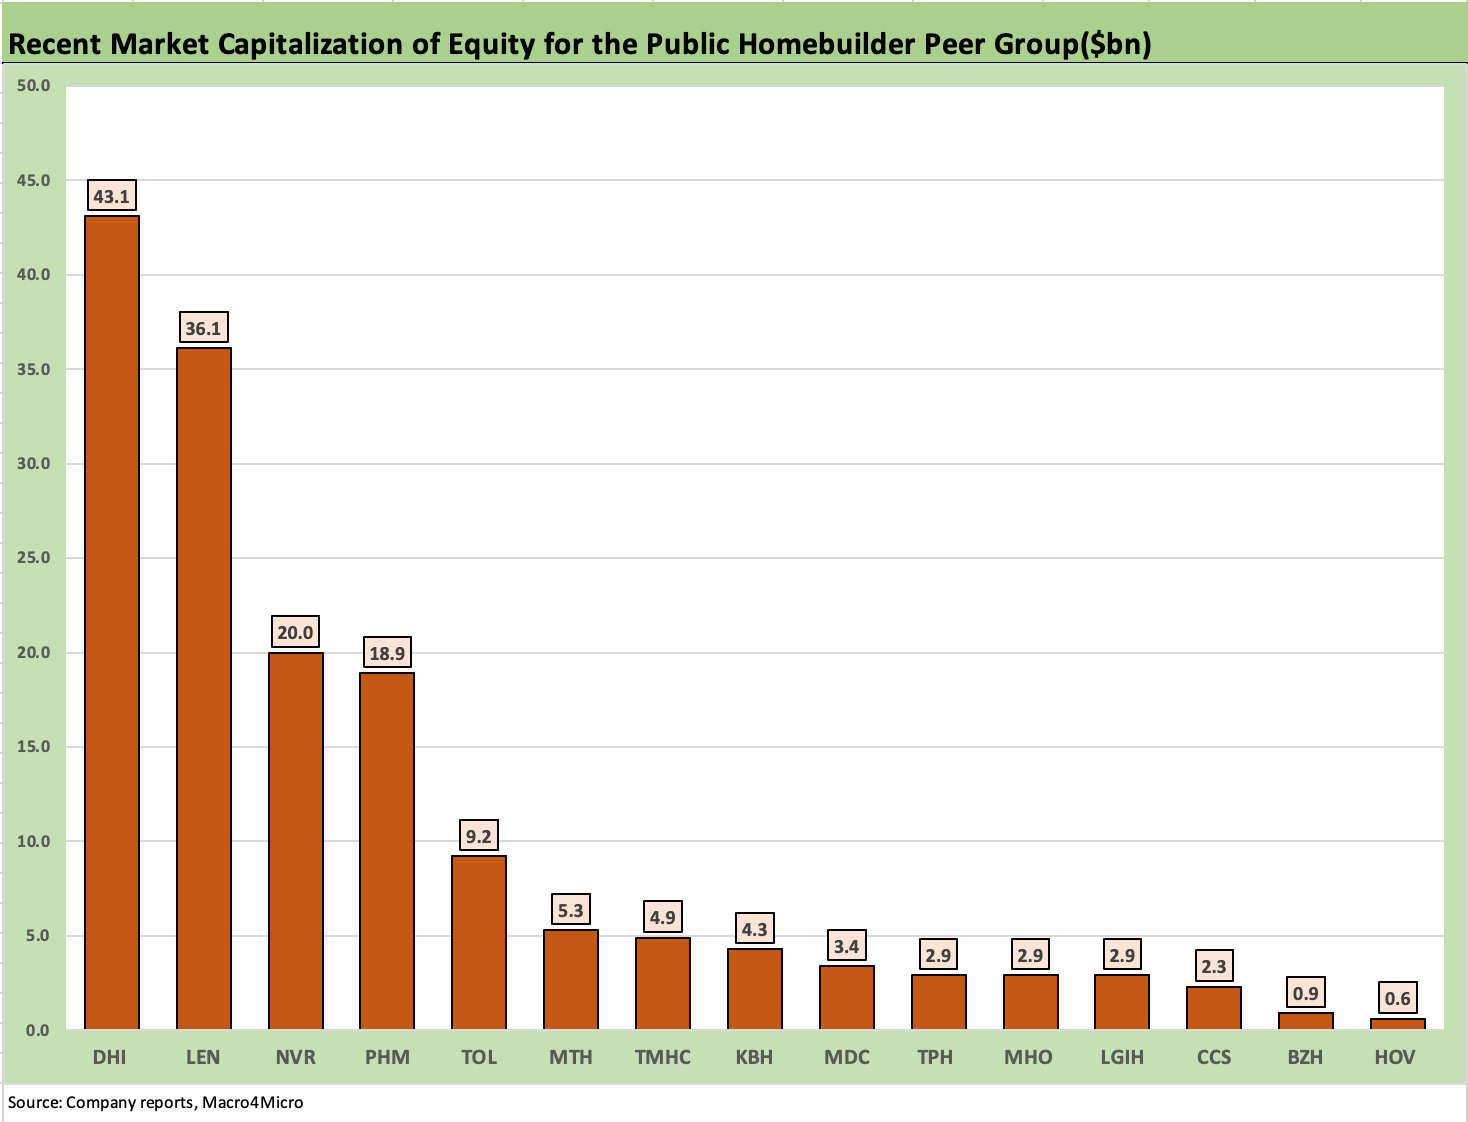
The market caps tell a slightly more concentrated story than revenues. The IG rated names comprise over 85% of total peer group market cap with all in the BBB tier. We would argue that D.R. Horton is a single A tier name with room to spare.
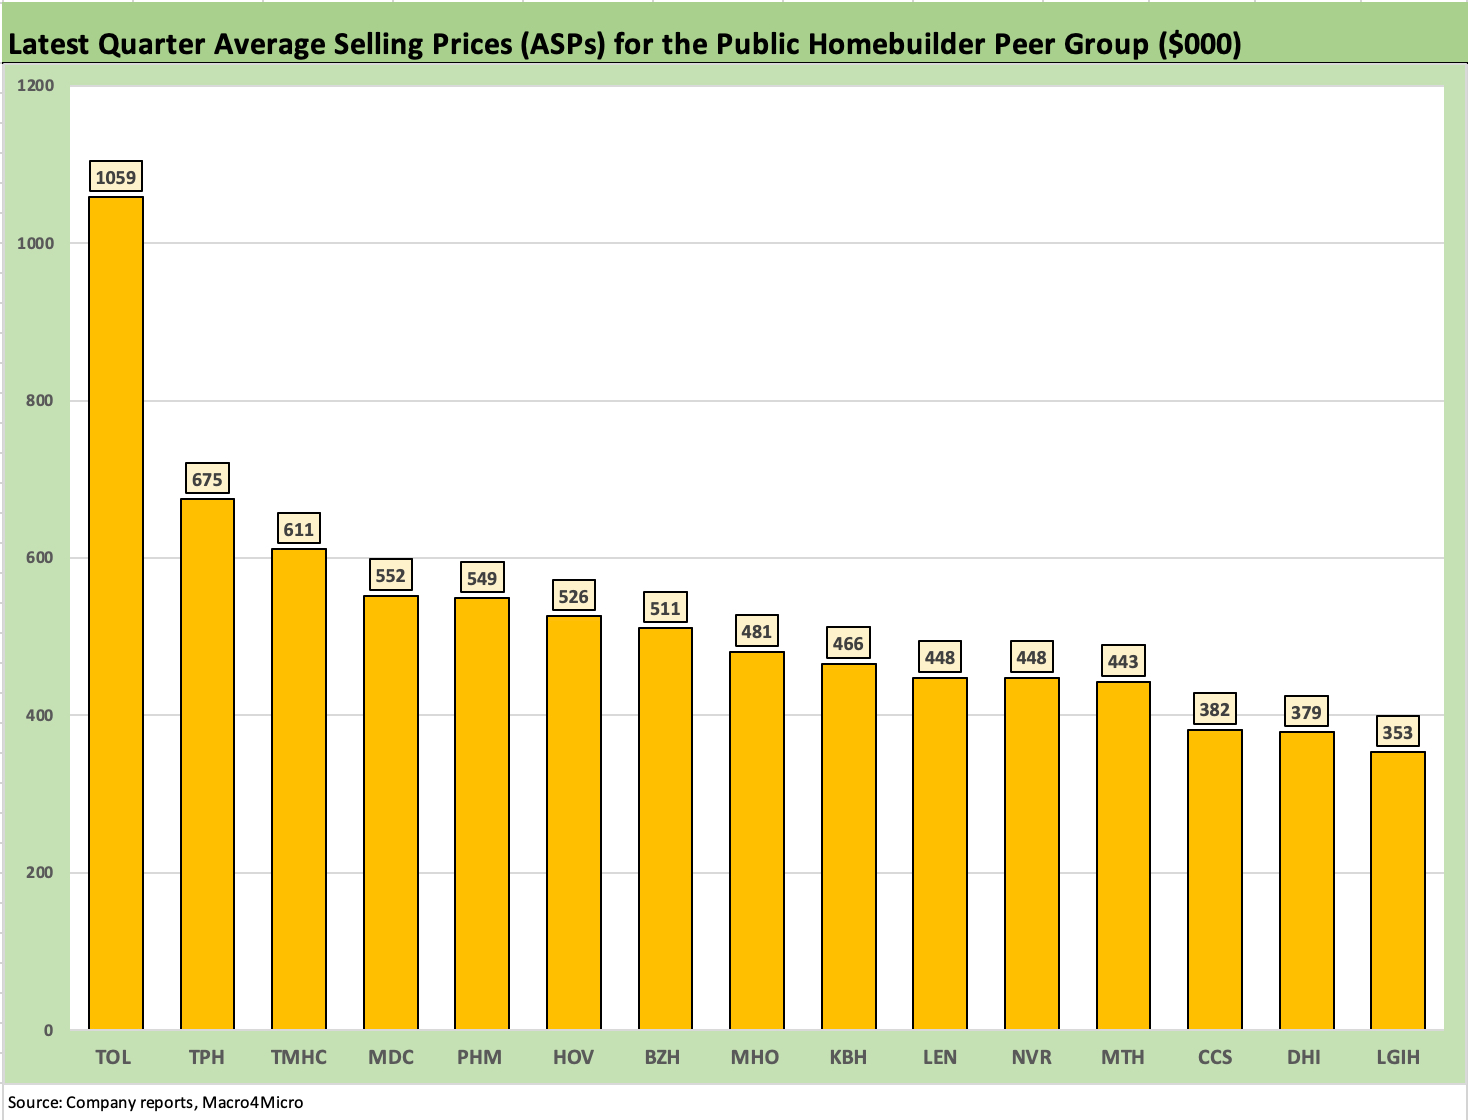
The above chart gives some idea of the range of average selling prices (ASPs) for the mix of builders. There is no correlation between ASPs and quality or stock performance. The ASPs are a function of region, metro concentrations, and product mix.
One could argue there is a correlation between the rate of growth as DHI has demonstrated as it raced into a big lead without major acquisitions while Lennar pursued some major acquisitions into some pricier areas of Florida as well as the West Coast (CalAtlantic, WCI).
Of the Big 3 (DHI, LEN, PHM), PHM has the highest ASP relative to LEN and DHI. DHI has a very distinctive strategy in its recent growth initiatives with its expansion in single family rental and land development (see Credit Crib Notes: D.R. Horton (DHI) 8-29-23, D.R. Horton: Credit Profile 4-4-23). Only LGIH has a lower ASP than DHI.
Toll operates in its own zone in product mix and price tiers (see Credit Crib Notes: Toll Brothers (TOL) 9-11-23). Any builder with a high California presence or operating in select high end markets (e.g., Seattle) is assured a high ASP (TPH, MDC, TMHC after its William Lyon deal).