
Footnotes & Flashbacks: State of Yields 6-23-24
We update the UST curve action this week but break out the IG and HY commentary in “Credit Markets,” our new, separate Footnotes publication.


What do you mean “Rent is rising?!”
With a noisy week of politics ahead tied to the debate, the market will likely be more focused for decision-making purposes on Friday’s PCE numbers and the final 1Q24 GDP numbers on Thursday.
The UST deltas for the week were mild and slightly negative although bond returns have been picking up in the rankings in recent weeks and months as we cover in our asset return footnotes (see Footnotes & Flashbacks: Asset Returns 6-23-24).
The UST curve is still closer to the start of the year for 10Y UST than the UST peak of Oct 2019, and the reality check is that the UST curve today is still lower than the pre-crisis credit market peaks that came before the ZIRP years.
The adverse YTD moves have undermined bond returns in 2024 as the market is now 3 months beyond the 2-year anniversary of ZIRP ending and 2 years from the CPI peak. We update the 2Y to 10Y UST slope history.
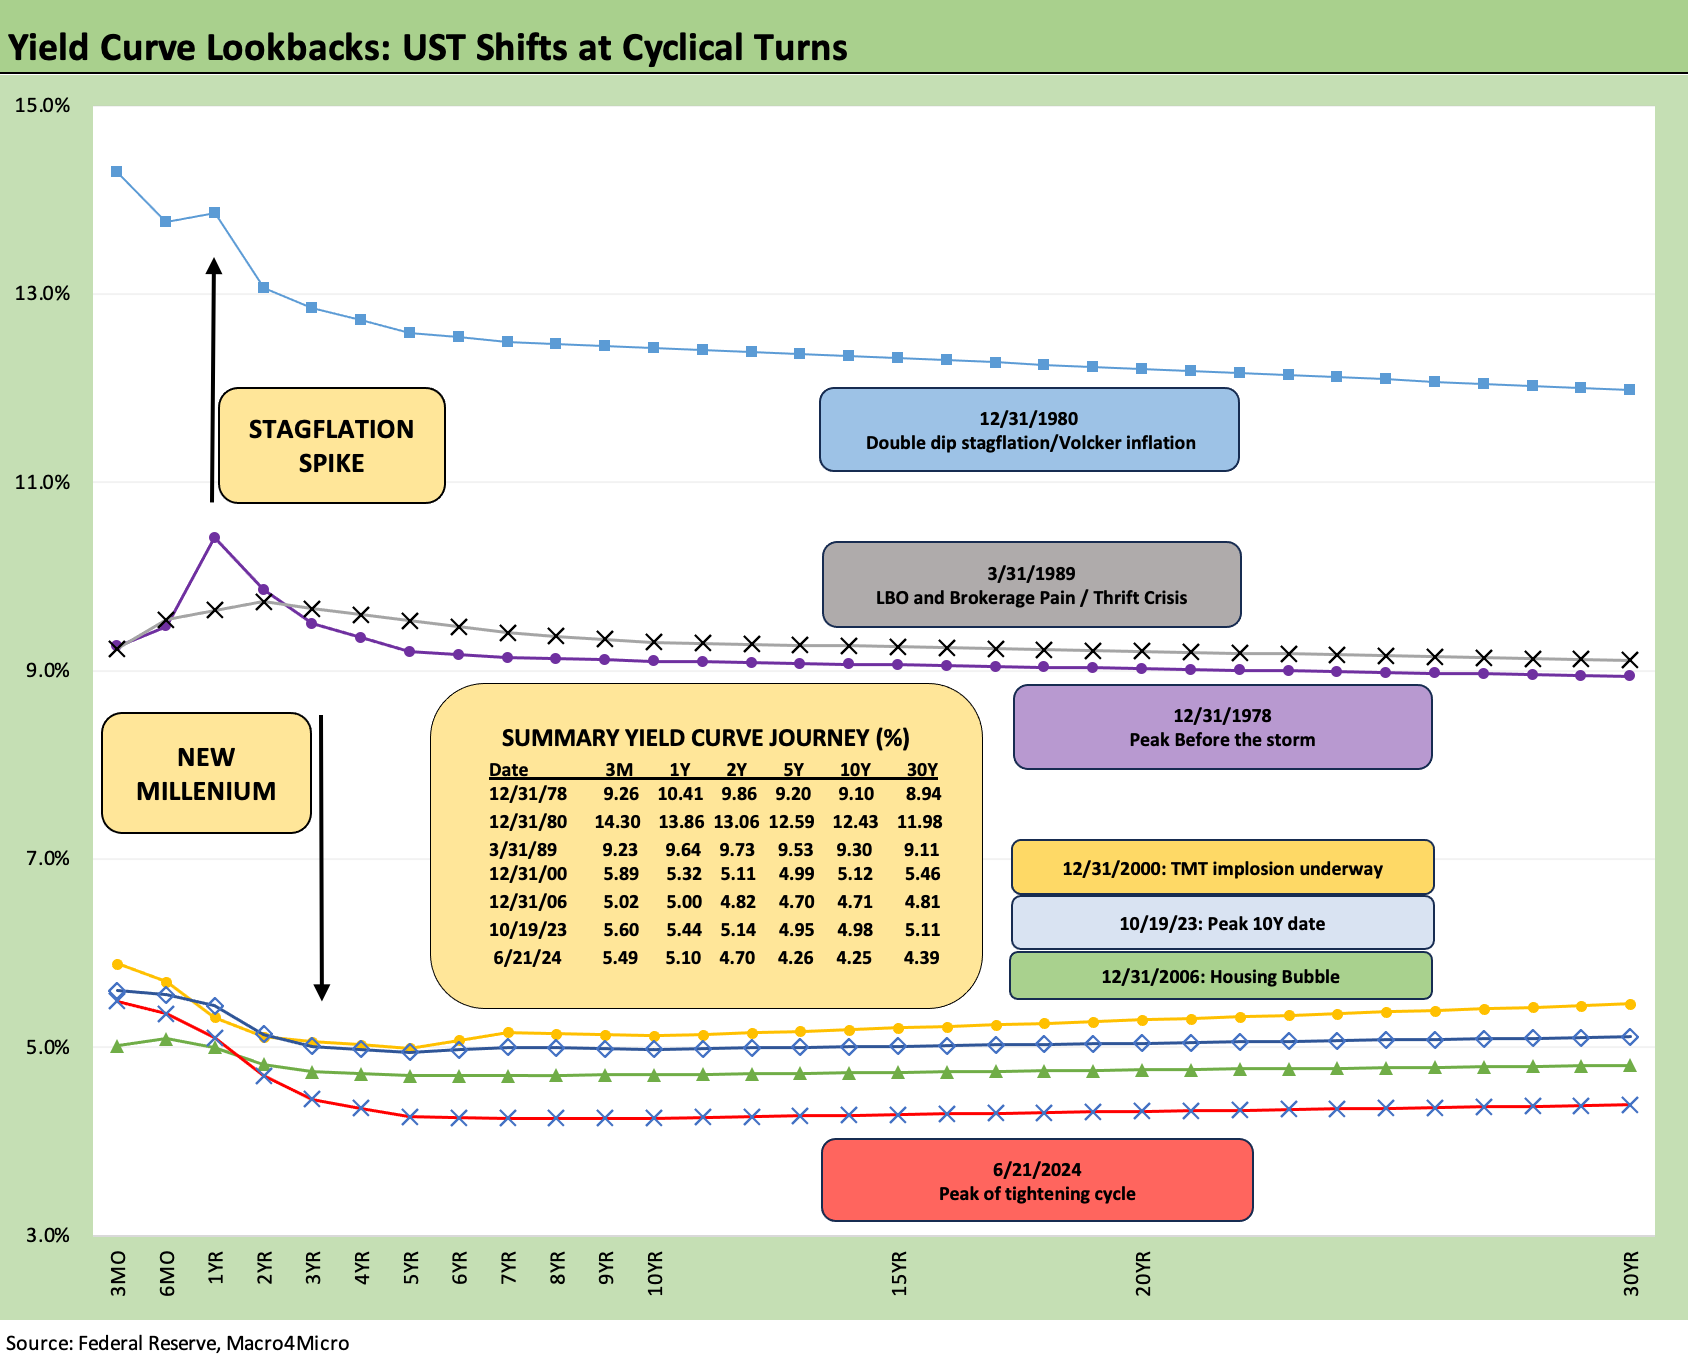
The above chart updates the longer term history of UST curves from the 1978 inversion on across the infamous Volcker stagflation double dip recession (1980, the year of the peak misery index) and then across the late 1980s (1989 credit cycle peak), the TMT bubble (2000 NASDAQ peak year), and the lead-in to the housing crisis (2006 as the last full year of the mortgage excess).
Then we jump beyond the ZIRP years to the 10-19-23 UST 10Y peak date. We include the Friday close this past week on the bottom of the UST curve mix. When we look at where rates are now outside ZIRP, and long UST rates are in fact historically low outside the ZIRP years that dominated since late 2008 and during COVID. That is at least worth considering in making the assumption that rates must decline out the curve.
In recent weeks, the debate around FOMC policy has been picking up around whether Shelter CPI is lagging or simply done now. The market is seeing more headlines that rents are rising from multiple data services (beyond the usual Zillow and Redfin). There is also plenty of evidence that the build-to-rent model of single family rental businesses are changing even when the multifamily cycle has peaked. The interplay of the housing supply and payroll numbers is in a unique position right now. On a side note, picture 11 million people deported in mass roundups. Build-to-incarcerate is a different business model.
The single family rental increase was reported at 3.4% recently, so it is not clear that more timely rental prices are declining. That is a topic for another day. There has been a lot of good research on LinkedIn and in the trade literature on how the more timely rent figures and sea level transactions undermine the validity of shelter inflation (as in the Shelter CPI was way too high), but that is getting more pushback of late. Rent is also complicated by regional variances.
We will see how PCE shapes up this week for the PCE price index and also for personal income vs. outlays (see PCE, Income and Outlays: Lower Income and Consumption, Sideways Inflation 5-31-24).

The above chart plots the UST deltas from the 10-19-23 peak through this past Friday close and plots the YTD deltas that had left bonds bloodied through 1Q24 with bonds now making a small comeback (see Footnotes & Flashbacks: Asset Returns 6-23-24).

The above chart is our recurring reminder that the long end of the UST curve does not have to follow the short end as we saw when the 12-31-22 UST curve converged with the 12-31-23 curve despite the 100 bps differential in fed funds.
We also include this each week for the memory box in the lower right that revisits the timing and magnitude of the FOMC actions. We are coming up on the 1 year anniversary of the last fed funds hike.

The above chart frames the 1-week UST deltas that saw a modest negative move higher.

The above chart just offers another visual on the UST deltas from the 10-19-23 peak as the inversion stayed pronounced even as GDP growth was strong and jobs soaring.

The above chart breaks out a visual on the YTD deltas as the duration pain has eased into the later stages of 2Q24. We look at the shapeshifting of the 2Y to 10Y slope in more detail further below.

The above chart updates the Freddie Mac 30Y mortgage benchmark after it ticked lower this week to 6.87% from last week’s 6.95% as the rate keeps ticking lower from the end of May when the rate stood at 7.03%.
We frame the Freddie benchmarks vs. two periods in the housing bubble including the Dec 2005 date to mark the end of the peak homebuilding year and mid-2006 for a time when the RMBS anxiety and concerns around subprime were surfacing.
Mortgage pressure has remained a problem in the market as the “golden handcuffs” undermines potential home sellers. The golden handcuffs moniker has been more appropriately rebadged to a “lock-in effect.” The mortgage differential between what the seller/mortgage holder has in place now and the current market has left many potential sellers holding the line and just waiting for rates to shift. The theory is prices will be better and buyers more plentiful, but there are scenarios beyond that as inventories climb.
The problem of wanting to unlock home equity value in a sale offers owners opportunities for the future. However, the net effect is to artificially depress inventory levels. The other side of their 3% mortgage is an uneconomic and massive increase on monthly payments as part of their relocation, downsizing (the empty nest transaction) or their “move-up” trade.
As a reminder, around 60% of mortgage holders are at 4% or below. Within that group, around 30% are 3% or below.

The above chart updates the long-term time series from 1984 for the 2Y to 10Y UST slope. We see the long-term median of an upward sloping curve of +95 bps vs. the current inversion of -45 bps. That differential is a +140 bps journey that means lower 2Y or higher 10Y or some combination. That is a lot of UST action to normalize at a time of record borrowing. Expecting a material downward shift is on the list, but that is threading the needle if the expectation is for continued economic expansion.

The above chart shortens the timeline to a start at the beginning of 2021. The peak slope in March 2021 reached +159 bps ahead of the plunge to an inversion of -108 bps in July 2023. The all-in yield sacrifice to extend into more duration risk and more cyclical uncertainty in credit markets outside the realm of UST make this market one where you need to be a bull on duration. That case can be made of course, but there are also pushback scenarios.
The rough ride for duration YTD 2024 (e.g. YTD total return of -3.4% for TLT) is one reason why many investors have stayed in short duration or T-Bills until conviction on the direction of the curve is greater. After all, the ability to move UST positions quickly in a push-button world was demonstrated in the regional bank deposit base. You can move from 3M UST to 10Y UST positions very quickly.
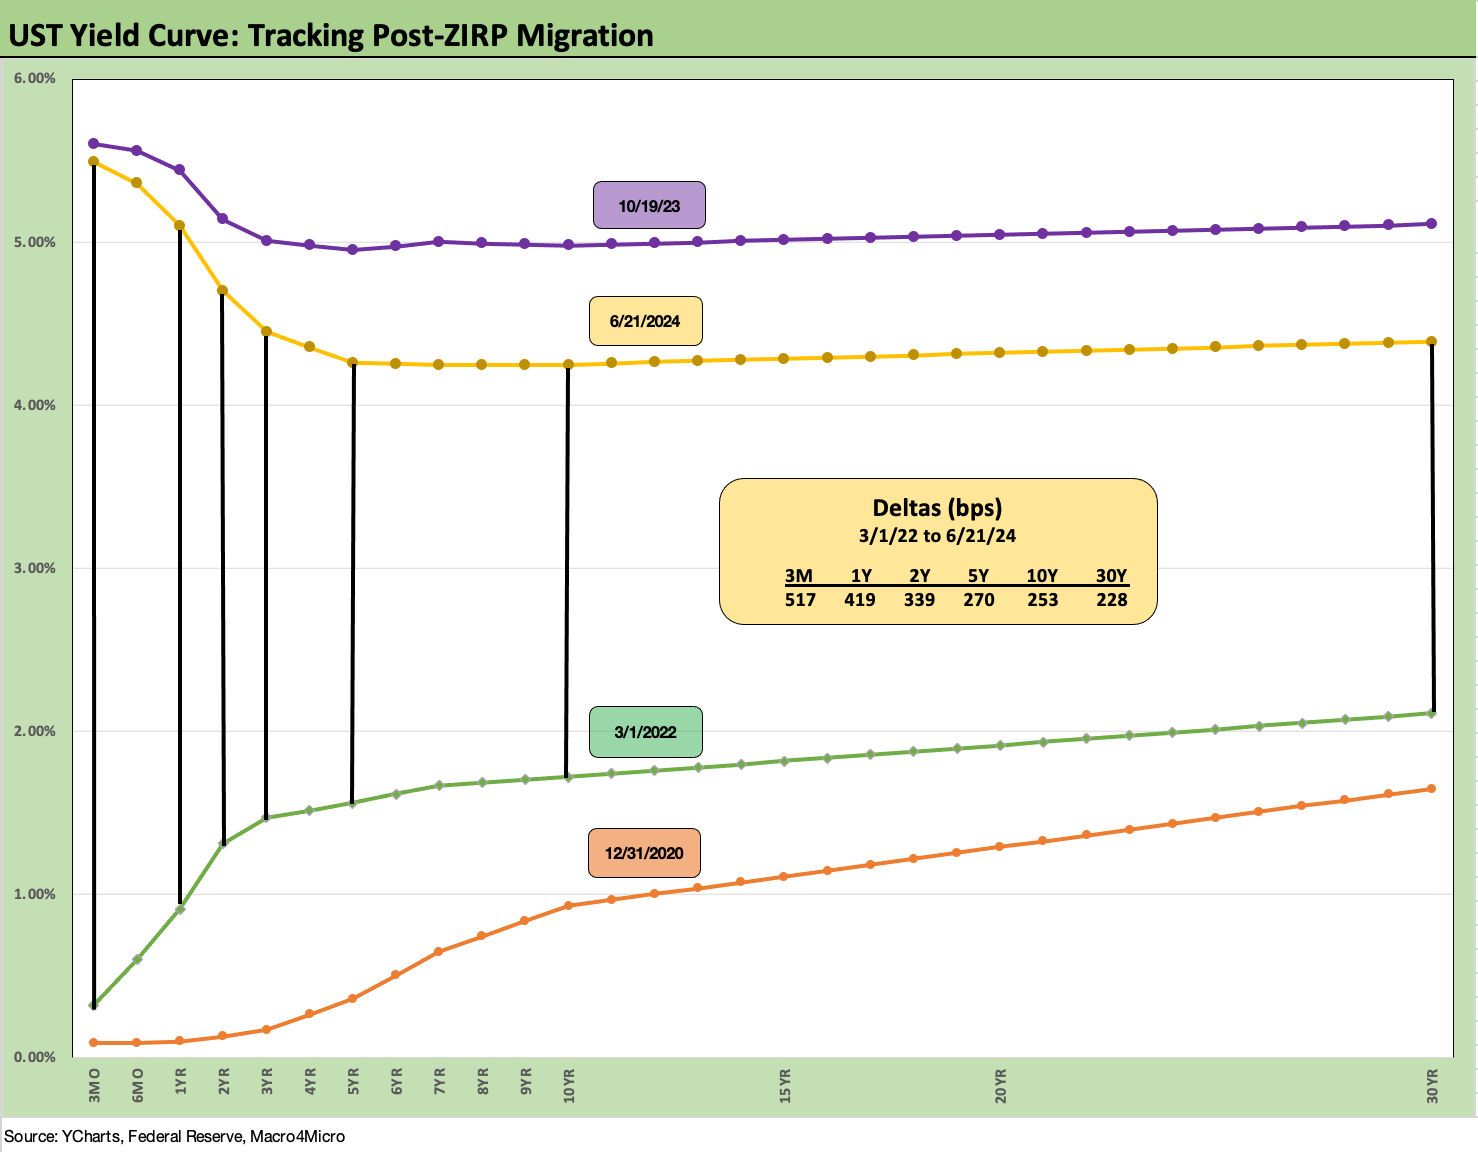
The above chart updates the UST deltas from the start of March 2022, which was the month ZIRP ended (effective 3-17-22) through the end of last week. We also include a 12-31-20 UST curve and 10-19-23 curve (peak 10Y UST) as frames of reference.
From upward sloping into a bear flattener and then a bear inversion has been a wild journey for the markets. The rapid shift from a record inversion on the front end to a record upward slope on the front end back in the Volcker years was other worldly. This is a very different cycle now, and the latest monetary cycle is 4 decades removed from the last one (see UST Moves 1978-1982: The Inflation and Stagflation Years 10-18-23). The backdrop is radically different.
See also:
Footnotes & Flashbacks: Asset Returns 6-23-24
Existing Home Sales May 2024: Weary Climb 6-21-24
Housing Starts May 2024: Starts vs. Deliveries Balancing Act 6-20-24
Industrial Production May 2024: Capacity Utilization 6-18-24
Retail Sales: Consumer Fabric Softening? 6-18-24
Footnotes & Flashbacks: State of Yields 6-16-24
Footnotes & Flashbacks: Asset Returns 6-16-24
Consumer Sentiment: Summer Blues or Election Vibecession 6-14-24
Income Taxes for Tariffs: Dollars to Donuts 6-14-24
HY Spreads: The BB vs. BBB Spread Compression 6-13-24
HY Spreads: Celebrating Tumultuous Times at a Credit Peak 6-13-24
FOMC: There Can Be Only One 6-12-24
May 2024 CPI: I Feel Good, Not Sure That I Should 6-12-24
Trade Flows: More Clarity Needed to Handicap Major Trade Risks 6-11-24
Payroll May 2024: The Wave Continues 6-7-24
JOLTS April 2024: Shorter Line but Not Short 6-4-24
Construction Spending: Stalling Sequentially at High Run Rates 6-4-24
PCE, Income and Outlays: Lower Income and Consumption, Sideways Inflation 5-31-24