
Footnotes & Flashbacks: Asset Returns
We look back at a week with mixed macro signals from the FOMC, duration support from CPI, and tech back to driving equities.


The market saw a distinctly favorable week for duration even if Tech stole the headlines and highs arrived during the week for the S&P 500 and NASDAQ but with the Dow limping.
The long duration 20+ UST ETF (TLT) took down a rare #2 spot in the weekly returns of the 31 benchmarks and ETFs we track and the IG Corporate ETF (LQD) and UST ETF (GOVT) also cracked the top quartile.
The UST action spread the love over to Homebuilders (XHB) as they got back into the top 5 for the week after some choppiness of late.
Tech was the big winner with Broadcom, NVIDIA, Apple, and Taiwan Semi all over the +5% line on the week while the Equal Weighted S&P 500 (RSP) was in the red.

The above chart updates the high level benchmarks we watch in the debt and equity asset class. All the debt and equity lines above had been negative for the rolling 1-month period in late April (detailed in our 4-26-24 Footnotes publication) and since then shifted back to a more mixed picture.
We are back to seeing some setbacks in equities, but debt has held up well with this week improving sequentially for the 1-month. We cover the favorable duration trends in the ETF section below with Corporates and UST feeling more of the benefit in the sequential 1-month numbers above.
Last week, all debt lines were positive and only small caps (RUT) were negative in equities. This week we saw the Dow join small caps in the red with both weaker for the rolling month. Looking back 3 months, both the Dow and the Russell 2000 are slightly in the red. As we cover in the ETF section further below, the more US-centric small caps as well as Midcaps are lagging again.

The above chart updates the 1500 and 3000 series. We are seeing a higher mix of negative lines for 1 month and 3 months. The trend is negative in this mix for the sequential 1-month time horizon vs. last week with the exception of Growth. We see 4 of 6 now in the red for 1 month with Energy the worst at -6.3% for the month. We also see 4 of 6 in the red for the 3-month period. Only Real Estate returns are in the red for 6 months.
The rolling return visual
In the next section we get into the details of the 31 ETFs and benchmarks for trailing periods. Below we offer a condensed 4-chart view for an easy visual before we break out each time period in the commentary further below. This is a useful exercise we do each week looking for signals across industry groups and asset classes.

The above chart shows the shift to a more balanced mix of positive and negative in 3 of the 4 charts. The healthier mix of returns could reflect the uncertainty around the Fed and cyclical risk that is still as much a part of the debate at the FOMC as it is in the broader investment decision-making in sector rotation and name picking.
FOMC action will determine the value of income stocks and defensive sectors while the credit cycle view will flow into asset allocation to higher risk sector trading at very tight spreads (see HY Spreads: Celebrating Tumultuous Times at a Credit Peak 6-13-24, HY Spreads: The BB vs. BBB Spread Compression 6-13-24). Credit trends have held in well, and that has flowed into spreads more akin to earlier credit peaks even if not at the “lowest of the low” in Oct 1997 and early June 2007.
The Magnificent 7 heavy ETFs…
Some of the benchmarks and industry ETFs we include have issuer concentration elements that leave them wagged by a few names. When looking across some of the bellwether industry and subsector ETFs in the rankings, it is good to keep in mind which narrow ETFs (vs. broad market benchmarks) get wagged more by the “Magnificent 7” including Consumer Discretionary (XLY) with Amazon and Tesla, Tech (XLK) with Microsoft, Apple, and NVIDIA, and Communications Services (XLC) with Alphabet and Meta.

We recently added the above chart to the weekly so we can track the headline mega-names and see which might have wagged certain ETFs or the broader capitalization weighted benchmarks. We line up some of the major large cap Tech-centric names in descending order of total returns for the most recent week.
We include the S&P 500 and NASDAQ along with the equal weighted NASDAQ 100 Equal Weighted ETF (QQEW) and the S&P 500 Equal Weighted ETF (RSP). A table of the big tech names from the Mag 7 to the broader collection of “headline types” streamlines the weekly review if one of the big ETF names is impacting performances.
The past week was a banner week for major Tech names as noted in the chart with only Amazon in the red of the single names and the Equal Weighted S&P 500 ETF (RSP) on the bottom. Apple got a lot of headlines for its product commentary and AI pitch early in the week, but Broadcom and NVIDIA were the biggest movers.
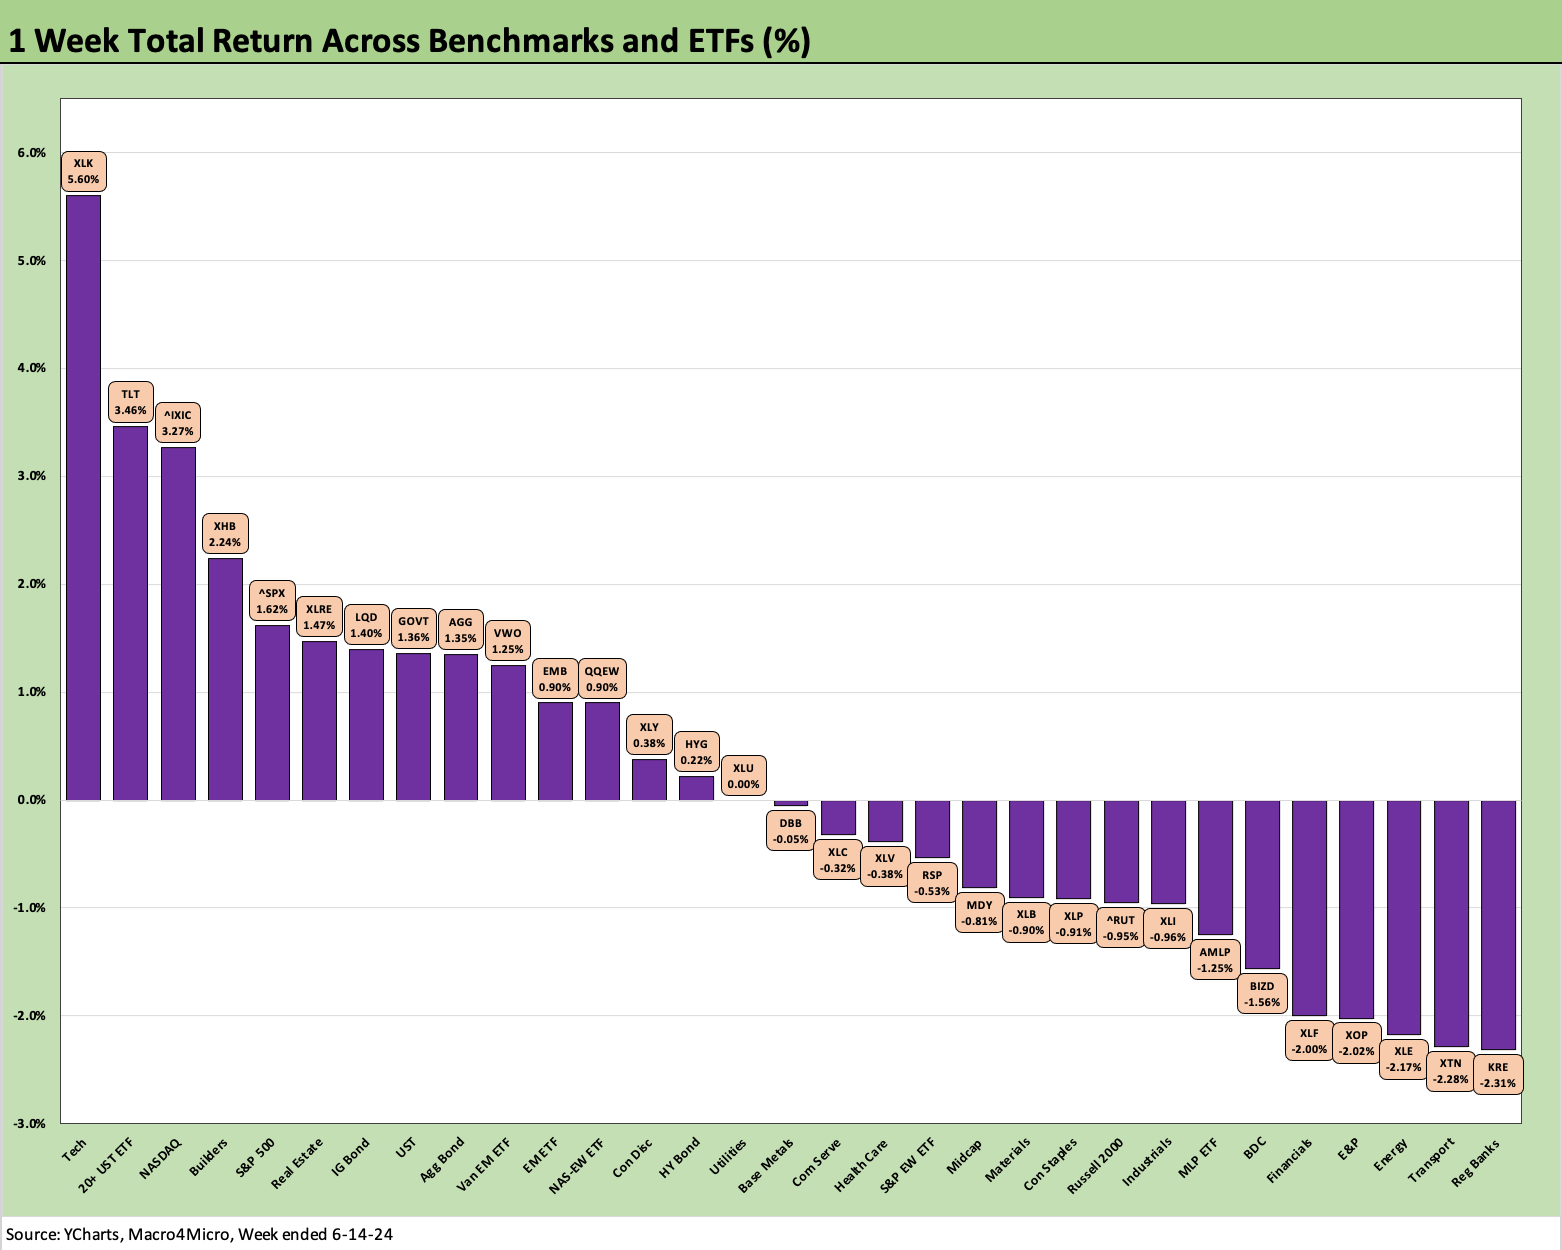
The week saw a 15-16 score for the positive vs. negative returns in the group of 31. That matches last week even with some material outperformers in Tech that ended with the Tech ETF (XLK) at #1 on the week and NASDAQ at #3.
Bond ETFs saw a strong week on the UST as 6 for 6 were in positive range with 3 of 6 in the top quartile and the other 3 in the second quartile. TLT nailed down the #2 spot with IG (LQD) at #7 and UST (GOVT) at #8 while the Bond Agg index (AGG) was just across the line at the top of the second quartile.
The UST curve move pulled along builders (XHB), who still lead the rankings over the trailing 1-year period but had fallen off the pace in recent weeks and dropped across the line into the upper end of the bottom quartile for the rolling 3-month period. We also saw Real Estate (XLRE) roll into the top quartile this week as the UST move injected some more hope into well-positioned income stocks. The XLRE mix cuts across a wide range of subsectors with very sound fundamentals but also more than its share of dogs.
The darker side of real estate worries shows in the Regional Bank ETF (KRE). The bottom quartile of the week’s returns included Energy (XLE), E&P (XOP), and Midstream (AMLP). BDCs (BIZD) were soft after a good run in the trailing 3-months that placed them in the top quartile for that timeline as well as for the trailing year time horizon, where BDCs stand at #7 in the top quartile.
Rounding out the bottom dwellers this week were Financials (XLF), Transports (XTN), and Utilities (XLU). As we detail further below, Utilities is leading the pack for 3 months in a surprisingly strong performance relative to other rate-sensitive sectors or defensive names.

The above chart shows 1 month at 13-18 in a modest deterioration from last week’s 17-14 with the top performers heavy on Tech and Mag 7 (XLK, XLC, S&P 500). In another notable shift from recent experiences, we see 4 of the 6 bond ETFs in the top quartile for the trailing month with the other 2 in the second quartile.
The market awaits more good news for duration, but the CPI index will have to deliver more than just one month like we saw this past week (May 2024 CPI: I Feel Good, Not Sure That I Should 6-12-24). The FOMC clearly wants to see more as well after its disappointing news on the one cut dot plot median (see FOMC: There Can Be Only One 6-12-24).
The Powell presentation and Q&A was somewhat meandering and repetitive by his standards, but the market mind readers came away voting more with the CPI release than with the dot plot for the week. The takeaway was that the bias is lower, and that puts us all back in the “data dependent” process.
The weaker side of the ledger for the 1-month returns framed up like the past week including Regional Banks (KRE), Energy (XLE) and E&P (XOP) along with the lagging small cap index (RUT) and Midcaps (MDY). Transports (XTN) are one off the bottom even as XTN is dead last over 3 months by a larger margin and last place for LTM.

The rolling 3-month return mix came up at 18-13 again this week with energy ETFs falling hard into 2 of the 3 bottom spots on the list after sitting near the upper end of the second quartile for last week’s 3-months cut of the data. Builders had fallen well down the pack as of last week’s 3-months timeline at second to last but pulled back up the ladder somewhat this week.
Small caps (RUT) and Midcaps (MDY) continue to lag large caps badly. Regional Banks (KRE) are still mired in the bottom quartile for 3 months even if the LTM is more generous given the measurement period starting after the spring sell-off of 2023.
The bond ETFs are clustered in the second quartile in this 3-month period with TLT on top of that quartile in a testament to its relative volatility. HYG has lagged TLT and LQD on HYG’s shorter duration and the better recent UST rally including the healthy move lower this week. We cover the UST deltas in our separate Footnotes publication on yields (to be published later today).

The LTM period has not shifted much with a favorable score of 29-2 and solid mix of positive returns. We see 18 benchmarks/ETFs in double digits with only 6 ETFs at 6% handles or below. Of those 6 at 6% or below, 4 of those 6 are bond ETFs.
From our vantage point, 18 benchmarks and ETFs at 10% or higher (another 3 at 9% or higher) is a very strong run even if that comes with the asterisk of a very ugly 2022 to rally from. We see builders on top at #1 before the next 3 are tech-centric or Mag 7 heavy.
The S&P 500 is in the top quartile mix with a fair amount of Mag 7 support. The S&P 500 returns are over 13 points higher (or double) the return posted by the Equal Weighed S&P 500 ETF (RSP). That differential had narrowed but is now going the other way again on the big tech moves even in the tier of names below the Mag 7.
Midstream Energy (AMLP) and BDCs (BIZD) are in the mix with Financials (XLF). The performance of XLF and BIZD make for a healthy part of the mix that reflects well on the credit cycle and overall asset quality (for now). The AMLP and BIZD performance also offers a reminder of the value of cash income returns in the total return equation.
See also:
Consumer Sentiment: Summer Blues or Election Vibecession 6-14-24
Income Taxes for Tariffs: Dollars to Donuts 6-14-24
HY Spreads: The BB vs. BBB Spread Compression 6-13-24
HY Spreads: Celebrating Tumultuous Times at a Credit Peak 6-13-24
FOMC: There Can Be Only One 6-12-24
May 2024 CPI: I Feel Good, Not Sure That I Should 6-12-24
Trade Flows: More Clarity Needed to Handicap Major Trade Risks 6-11-24