

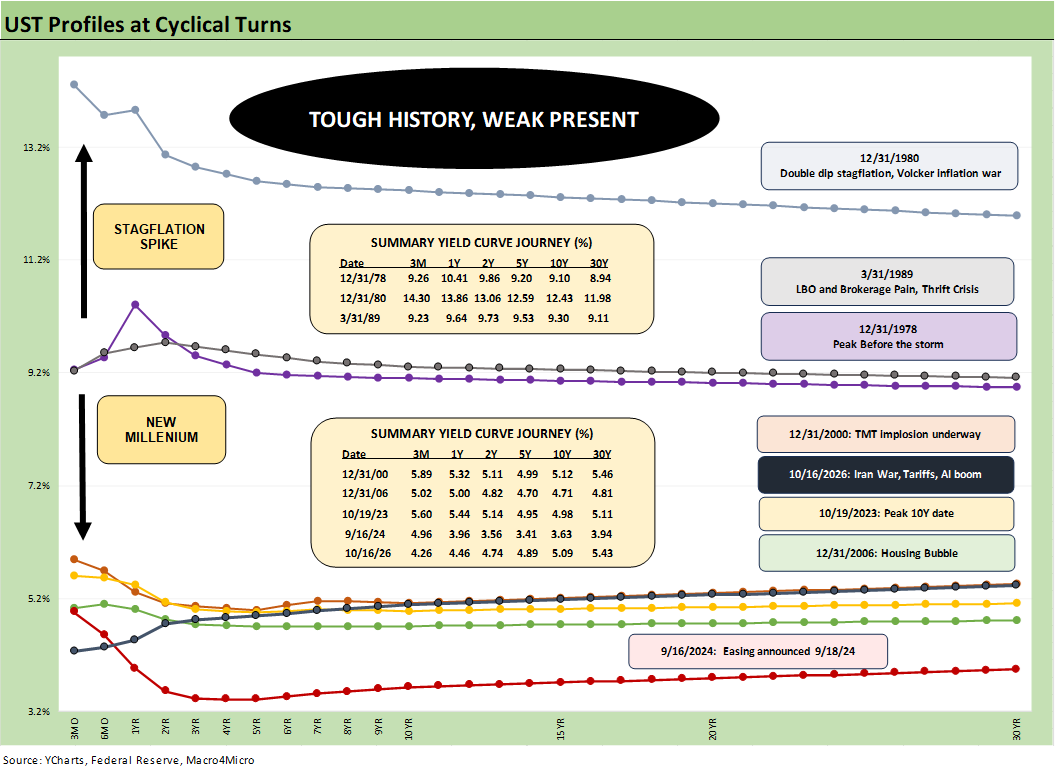
UST Curves and Cycles: Today in Historical Context
We put the current UST curve in the context of some cyclical histories and ask some questions.
The above chart updates a targeted history of UST curves in place around some critical turning points - whether in economic cycles or monetary policy pivots (or need for a major decision).
I include two boxes with the yield curve details since the curves get a bit crowded in the short to intermediate maturity buckets in the new millennium. The late 1970s, early 1980s, and the late 80s certainly stand apart from the group (visually above and in my personal memory banks).
I line the UST curves up in the boxes in chronological order. The current UST curve we posted (10-16-26) can be framed against those days. Dec 2000 marked what was a tech bubble set to burst (March 2000 NASDAQ peak) and a HY bond default cycle getting underway. Enron (late fall 2001) and Worldcom (summer 2002) were coming down the pike and would add a lot of drama – from the DOJ to the legislative process (e.g. Sarbanes-Oxley in 2002) as well as the capital markets regulatory agenda (what I would call “research lockdowns”).
Looking at the curves on these dates vs. Friday’s close (10-16-26) is just a mental gymnastics drill. I tend to look at UST curves as “more symptom than cause” across economic cycles, but the curve can be a cause for banks and housing via cost of capital challenges. Rate tension flows into bank interest margins as well as asset quality. Rates obviously flow into the corporate borrower level (notably for the highly leveraged floating rate exposed or refinancing schedule heavy) and impact demand in risky asset funding. That will remain a hot topic in private credit today.
Housing and the multiplier effects of homebuilding along supplier chains certainly feel the power of interest rates directly via working capital cycles and new home sales turnover and total volumes. Existing home sales feel it as well as mortgage refi barriers and “golden handcuffs” constrain those with low mortgage coupons on their home. Housing volumes (new or existing) ring a lot of cash registers from suppliers to retail to a range of services including lending, RMBS underwriting, and insurance.
To be clear, the Fed and the curve are always a cost issue. Industry dynamics of course add a lot more to the story. The chart shows that current “high rates” are in substance not really that high in historical terms (Volcker 20% fed funds anyone?). Such rates as today are still seen as a shock relative to 1% fed funds in 2004, ZIRP from late 2008 to Dec 2015, and ZIRP again during COVID from March 2020 to March 2022.
In the timeline, we see a lot of 5% or near 5% 10Y UST yields including 5.1% in Dec 2000 when the tech bubble was a worry. A notable exception among those detailed is the 9-16-24 curve which appeared late in the Biden term. That was when the FOMC was about to go into easing mode. At this juncture, PCE growth was solid and unemployment low. We cover that period in earlier commentaries. That UST curve sits on the bottom of the comps presented in this chart (see Footnotes & Flashbacks: Credit Markets 9-16-24, Footnotes & Flashbacks: Credit Markets 9-23-24.)
Some lookbacks at the key dates posted…
December 2000 offers a reminder of what came ahead of the Greenspan easing frenzy of 2001 (Greenspan’s Last Hurrah: His Wild Finish Before the Crisis 10-30-22). He took similar actions to bolster the banks against crises in the early 1990s when commercial real estate was a material threat to large, medium and small banks. If AI unravels, Team Warsh will have their legitimate excuse to follow that history.
The December 2006 date can be seen as the peak year for the residential mortgage excess and mortgage refi wave (125% LTV refinancings, etc.) and the home stretch (stench?) of the housing bubble. The subprime RMBS and outsized counterparty risk and leveraged derivative threat were not accurately disclosed or measured.
The HY bond credit cycle peak came in June 2007, and the bank system crisis made the HY default threat that much worse on refinancing risk. HY outflows and punitive market-making in HY also fueled market dislocations at the securities firms and securities units of the large banks. Soon all those securities firms would get rolled up under Bank Holding Companies or become BHCs themselves (Goldman, Morgan Stanley).
The Oct 2023 curve marks the peak for 30Y mortgages and a high for the 10Y UST on 10-19-26 when the 10Y closed just under 5.0% after hitting that level intra-day. The 30Y Freddie mortgage rate was 7.63% at the peak with a range of other mortgage surveys around 8%. Current Freddie rates are 7.4%.
The UST yield curve threat to mortgage rates today is clear since Oct 2023 posted lower UST 10Y UST yields than we see today even after last week’s curve rally. That is no small risk for current mortgages subject to where inflation heads from here (see Mortgage Rates vs. UST Curves: Spooky Memories to Ponder 9-20-26).
Among the questions from here…
There are always a lot of questions and variables to consider across every cycle, but this current one is trickier than most with “AI bubble” debates; a Mideast war; tariff excess and potential escalation of trade wars; commodity and energy price spikes; and high and/more stubborn inflation.
A volatile (euphemism of the week) President who rejects elections and who is apparently devoid of a basic understanding of economics (“selling country pays the tariff” Huh?) further complicates common sense handicapping.
A few obvious questions:
Will the FOMC deliver one more tightening from here in Dec and send the 3M higher? Will the FOMC move even higher into 2027 and push the 3M and 2Y higher again? Does that drive a bear flattening that does more damage to heavily leveraged borrowers?
With inflation metrics (both CPI and PPI) going the wrong way this week and WTI up another $10 this past week and refined products still in severe supply-demand imbalances, does the long end stay range-bound or do we see fresh upward migration or even steepening?
Will inflation ease if the oil markets crack or the demand side faces more second-guessing on growth that hits GDP? Will the AI ecosystem excess in valuations set off equity market dynamics that flow into the UST curve and drive more flight to quality? Then again, does that also set off a credit repricing cycle with spread widening and the economic fallout there from micro to macro?
To the extent the Democrats take the House as the keeper of the budget flame (regardless of the Senate), will Trump accept the election? If Trump rejects the election and goes “full Insurrection Act”, will the GOP sheep in the House and Senate even make a soft bleating sound? If Trump does accept Democracy, will the market start to handicap/discount budget breakdowns and fallout from inevitable clashes and investigations? These are the kind of scenarios where the market will say, “call me when we get there”.
These are the questions that we all will be wrestling with, but the most immediate threat remains energy costs and inflation. Refined product crises continue from gasoline and diesel. Home heating bills in places like Maine and New Hampshire are painful with estimates closer to $2,000 than $1,000 for a typical 275-gallon tank (I grew up on home heating oil in New England). As with tariffs, the policy reactions to diesel prices (Trump hugging Putin on sanctions) can lead to more problems than they solve. That is not going away.
More speculative elements revolve around AI valuation sentiment and market risk. That sends us back to the profile of the Dec 2000 curve above and how the FOMC immediately responded in the aftermath of the capital markets chaos in 2001. We look at numerous curve histories in the links below.
This past week was a painful one for AI and semis that we cover separately. We saw a range of double-digit negative return weeks across many tech names. Dell, which was way ahead in the return rankings, dropped by almost -23% and Applied Materials (AMAT) posted about -19% for the week. Software was also hit hard in AI-exposed names. CoreWeave (CRWV) is not a semi or classic software play, but it generated headlines with a -25% return for the trailing week as an AI driven cloud infrastructure company. It also has people talking about “credit” again.
Elections and Trump…
As noted, the other subjective wildcard (arguably the wildest of the wildcards) is whether Trump accepts election results or goes full-on Mussolini with a dash of those German guys. ICE of course would need to alter their wardrobes (Does brown make me look fat?) and invest in armbands. That type of political and societal shock will not do wonders for consumer spending or investment planning. The international demand for UST would be undermined since it will inevitably make trade policy even more confrontational.
I am old enough to have watched the JFK funeral on TV and very early in life learned about the iconic Ike, FDR, etc. I’ve kept studying history since. “Not normal” does not capture what is going on today. I grew up around WWII and Korean War vets and VFW and Legion barbecues. It is hard to envision what they would think of these events. Most all of them are dead of course. This current election and White House rhetoric defies US history and has more European flavor from the 1920s and early 1930s.
See also:
Industrial Production Sept 2026: Capacity Utilization 10-17-26
CPI Sept 2026: Does Chronic Inflation Need More Treatment 10-15-26
Macro Crosscurrents Rattle the UST Curve and Equity Valuations 10-15-26
Mortgage Creep Continues, Curve Shapeshifting Uncertain 10-4-26
Mortgage Rates vs. UST Curves: Spooky Memories to Ponder 9-20-26
Some UST curve histories:
Business Cycles: The Recession Dating Game 10-10-22
UST Curve History: Credit Cycle Peaks 10-12-22
Bear Flattener: Today vs. 1994 and Aftermath 10-18-22
Fed Funds, CPI, and the Stairway to Where? 10-20-22
Greenspan’s First Cyclical Ride: 1987-1992 10-24-22
UST Curves: Slope Matters 10-25-22
Greenspan’s Last Hurrah: His Wild Finish Before the Crisis 10-30-22
Wild Transition Year: The Chaos of 2007 11-01-22
UST Slope Update: Some New Inversion Highs 12-8-22
Yield Curve Lookbacks: UST Shifts at Cyclical Turns 10-16-23
UST Moves 1978-1982: The Inflation and Stagflation Years 10-18-23