

Mortgage Creep Continues, Curve Shapeshifting Uncertain 10-4-26
Another setback along the UST curve keeps the heat on mortgages.
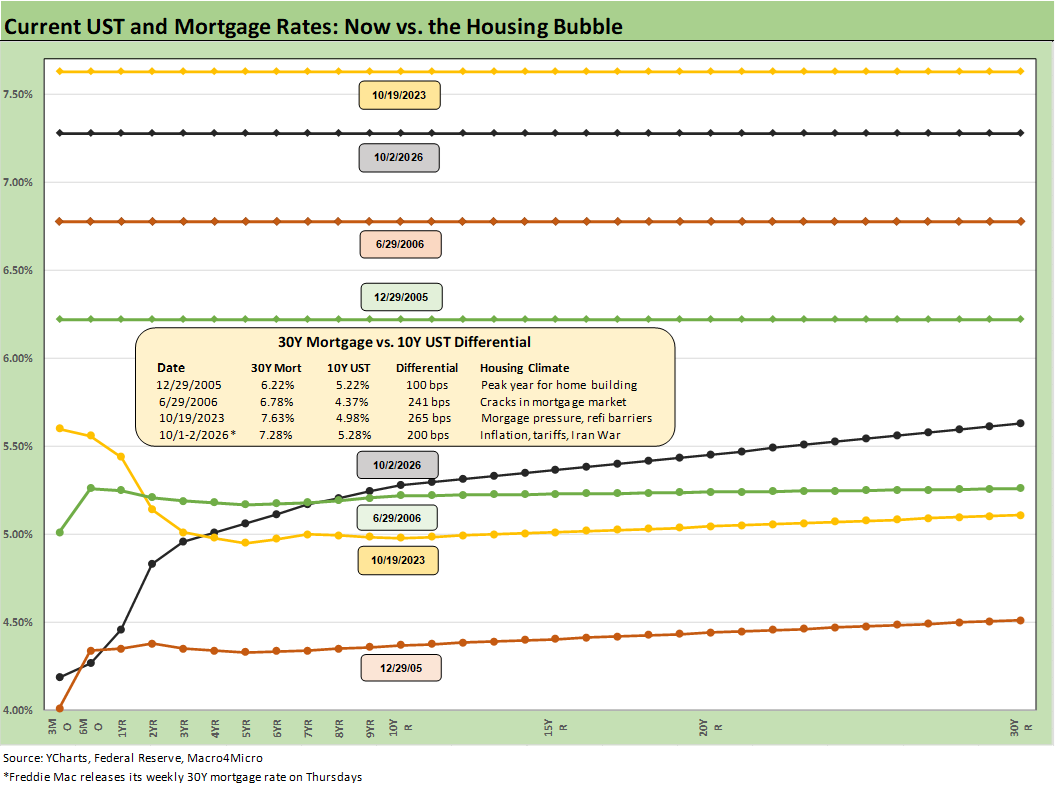
The chart updates the Freddie Mac benchmark and UST curve comps with recent moves in the 10Y UST potentially pushing mortgages even higher into the danger zone. We looked at some of these histories recently, and the specter of the October 2023 cyclical highs is getting closer to being revisited (see Mortgage Rates vs. UST Curves: Spooky Memories to Ponder 9-20-26).
As we look back, it should be highlighted that the 10Y UST was slightly under 5.0% when the Freddie benchmark hit 7.63% in October 2023 and various other mortgage surveys hovered near 8%. That period also came on the heels of an oil macro shock (as much as Team Trump avoid citing Putin and Ukraine in looking back). The ensuing macro trends showed the US economy continuing to expand into 2024 (2.8% annual GDP growth in 2024 vs. 2.1% in 2025).
The housing sector and affordability barriers tied to monthly payments will make the headwinds worse as we roll into 2027 unless oil does in fact crack and move the long end of the UST lower. The rapid moves higher in mortgages over the past two weeks have driven rates to 7.28% at Freddie and around 7.57% in the Mortgage News Daily survey. That spells more trouble for both new and existing home sales. The signals are aiming higher for mortgages, and that is sure not what the housing market needs at this point.
The differential between the 10Y UST and the Freddie benchmark was 265 bps back at the Oct 2023 peak on the 10Y. Currently, that differential is +200 as shown in the chart with the10Y UST higher now. That in theory makes for bad risk reward symmetry in the absence of a favorable yield curve move.
There is certainly no shortage of ways to spin UST scenarios, and the history is convoluted whether recent history or back in the days of Volcker (when I had a 23% prime based loan). We also saw a slew of 9% handles in early 1989 (see curve history links at the end of this commentary). Yield curve pain is hardly new (see The Curve: Pain and Confusion 9-28-26). The good news is the virtually assured heavy fixed asset investment driven by AI with a currently solid (but uncertain) consumer profile.
The more recent quarterly reports for homebuilders have shown prices and margins under pressure. In this current backdrop, mortgage rates trump the lower average selling prices (see KB Home: 3Q26 Highlights Builder Pressures 9-25-26, see Lennar 3Q26: Metrics Keep Weakening 9-18-26). We get a fresh round of builder earnings ahead for the September quarter earnings releases.
Some UST curve histories:
Business Cycles: The Recession Dating Game 10-10-22
UST Curve History: Credit Cycle Peaks 10-12-22
Bear Flattener: Today vs. 1994 and Aftermath 10-18-22
Fed Funds, CPI, and the Stairway to Where? 10-20-22
Greenspan’s First Cyclical Ride: 1987-1992 10-24-22
UST Curves: Slope Matters 10-25-22
Greenspan’s Last Hurrah: His Wild Finish Before the Crisis 10-30-22
Wild Transition Year: The Chaos of 2007 11-01-22
UST Slope Update: Some New Inversion Highs 12-8-22
Yield Curve Lookbacks: UST Shifts at Cyclical Turns 10-16-23
UST Moves 1978-1982: The Inflation and Stagflation Years 10-18-23