


A good reality check for a sound economy (vs. extreme valuations in the equity market) is to do a gut check on industrial production along with the other usual, more pressing indicators such as personal consumption expenditures (PCE) at more than 2/3 GDP, fixed investment during an AI and tech product boom, payrolls in a “low fire/low hire” market, and of course corporate earnings and guidance that will accelerate this week.
This past week saw Industrial Production numbers for September offer some reassurance. That said, fears around inflation will (and should) remain high after PPI and CPI worsened this week.
PPI is a notable leading indicator, and those metrics were grim in September. That came on the heels of CPI headlines moving higher to 3.7%, which uncomfortably exceeds hourly wage growth of 3.0% (see ( Macro Crosscurrents Rattle the UST Curve and Equity Valuations 10-15-26; CPI Sept 2026: Does Chronic Inflation Need More Treatment 10-15-26).
This coming week ramps up the range of earnings reports and macro guidance with a heavy schedule of transports (airlines, rail, freight and logistics) joining a very busy slate of defense and aerospace reports. We will see bellwethers such as GM for a read on consumer durables and consumer finance quality (Cap One, Synchrony, Ally). We get 2 Mag 7 reports with Meta and Tesla and Netflix reports. United Rentals is always a good capex and nonresidential/industrial construction proxy as well.In other words, the macro picture will get some useful infill.
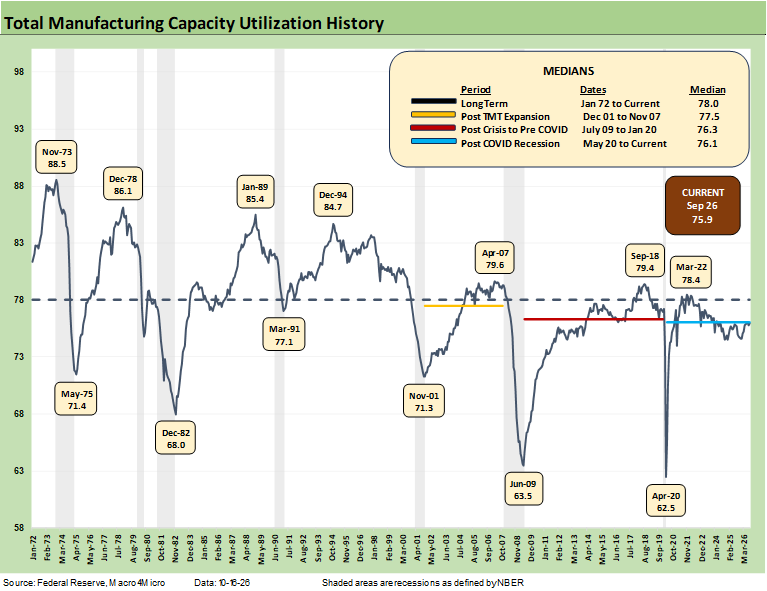
The above chart updates the time series for manufacturing capacity utilization, and the release had a fresh wave of restatements across the years. The pattern in the chart tells the cyclical history with its peaks and valleys. The timeline shows the 1973 peak with the Arab Oil Embargo unfolding (Nixon) across the stagflation cycle into the 1975 low (Ford in office). Then came the Iranian oil crisis and CPI spike of 1979 rolling into the inflation/stagflation years under Carter followed by the double-dip recession years in 1980-1982 with Reagan taking the helm in 1981.
The economic cycles have been covered in detail in past commentaries, but it is worth noting the 9% handle UST rates of 1989 (see UST Moves: 1988-1989 Credit Cycle Swoon 10-20-23), the recession onset and oil market disarray of 1990 with Desert Storm warning up in the fall of 1990 (see UST Moves: The 1990-1991 Risk Factor Pig Pile 10-24-23, Greenspan’s First Cyclical Ride: 1987-1992 10-24-22).
That FOMC easing wave in the early 1990s was also set against a backdrop of bank stress came with of a commercial real estate crisis. Then came the “mother of all bear flatteners” and an ugly upward UST curve shift in 1994 (see Bear Flattener: Today vs. 1994 and Aftermath 10-8-22).
The tech and telecom bubble bursting after the 2000 peak often comes up in lookback exercises these days given anxiety around the AI boom. It is worth noting that the 2001 tech bubble stress saw Greenspan riding to the rescue in impressive fashion (see Greenspan’s Last Hurrah: His Wild Finish Before the Crisis 10-30-22).
One theory is that a crack (or worse) in the AI market frenzy could lead to a Greenspan-style easing binge by the Warsh-led FOMC. If that did not happen at the FOMC, it is not hard to envision the Trump response. The “Boys on the Bus” from Jan 6 would get rounded up and be on the steps of the Fed and Bill Pulte would be investigating FOMC members for jaywalking and parking tickets. Easy credit is a growth catalyst, but it is very hard to use effectively in the face of higher inflation.
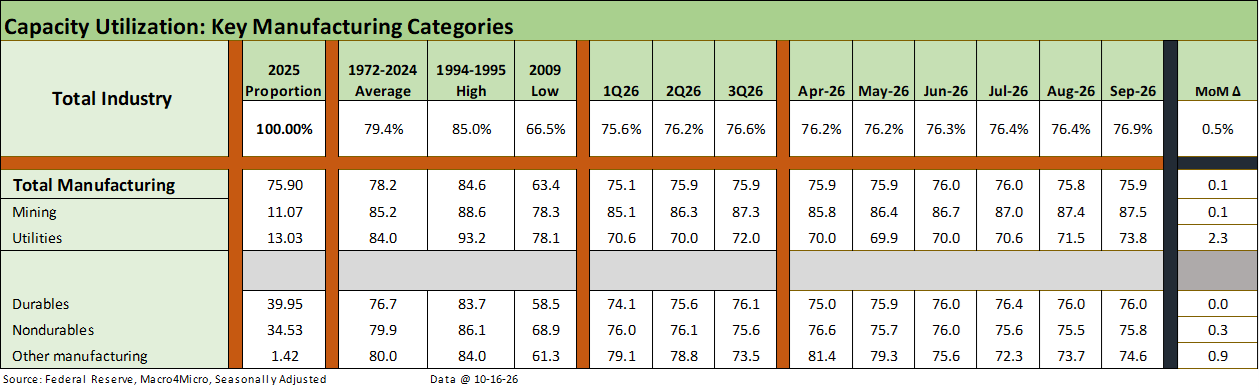
The above table updates capacity utilization for Sept. We include the deltas in the right column, and the trend is favorable. We covered the longer-term history the last time we wrote about these broader trends (see Industrial Production July 2026: Resilient, Steady, Hopeful 8-18-26).
Capacity Utilization trends do not allow easy generalization, but it is safe to say “higher is better.” The direction of total capacity (via higher capex) and the dynamics of the products produced (pricing power, margin, etc.) and end market factors (demand, volumes, capex trends, etc.) all come into play. The erratic tariff policies do not make life easier for planning (capex, pricing strategies, long term contracts, etc.).
The influence of capacity utilization is about more than just “higher or lower” since it is about product mix, prices, unit costs, and how that all flows into breakeven levels. We have seen higher utilization rates in recessions. The trick is the right mix, cost structure, and margins for a given utilization level.
In the current market, the question is how soaring tariffs, adverse trends in energy/material costs, worsening freight and logistics cost pressures, and the continued undermining of long-established supplier chains flow into the numbers.The global supplier chains were established for a reason ranging from relative costs to comparative advantages of various types (quality or cost) or even just the availability of the product. The one-dimensional trade policies of the White House in some cases undermine investment and hiring.
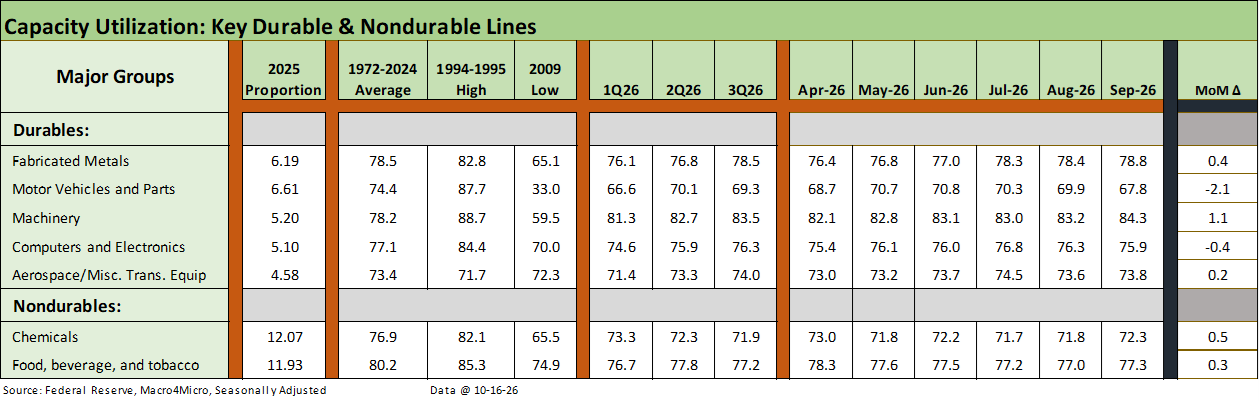
The above table details a sample of 5 major manufacturing durable groups. We also include the two largest nondurables industry subsectors. We see 2 of 7 down sequentially in the right delta column (Autos, Computers). Industrial production overall was higher YoY. Capacity was also up YoY, so that is good news subject to how it plays out by sector into 2027. Expanding capacity is not without its risks.
Motor vehicles and parts were down sequentially MoM and from the spring and summer. Autos and parts have been a tariff policy focal point and are going through a lot of change given setbacks in EV policy and thus the threat of what became capex excess. We see ongoing investments to relocate more operations from Mexico to the US by the legacy Detroit 3 as well as some of the Japan 3. Automotive products saw a decline in Industrial Production of -6.9% in Sept YoY. That auto sector measure rolls up under “consumer goods.”
The overall increase YoY was +2.2% in industrial production (as opposed to capacity utilization). Capacity grew by +1.2%, which is spread around by “market groups.” Business equipment was the winner in industrial production growth at +6.7%. Consumer goods were off slightly YoY at –0.1%. Among category winners in industrial production trends for Sept YoY, we see “Defense and space” at +6.7%, “Information Processing” at +5.1%, and “Industrial and other” at +5.0%.
With fixed investment doing well in the relative growth posted along the GDP lines and AI investment being the headline theme, that is a logical mix (see GDP 2Q26: Bullish Final Revisions 9-30-26, Macro Dance-Off: PCE Growth vs. Fixed Investment 10-1-26). We get the advance estimate for 3Q26 GDP in 2 weeks, and the PCE and Fixed investment growth will tell an important story on the cyclical resilience in the face of worsening inflation and affordability challenges.
See also:
CPI Sept 2026: Does Chronic Inflation Need More Treatment 10-15-26
Macro Crosscurrents Rattle the UST Curve and Equity Valuations 10-15-26
Mortgage Creep Continues, Curve Shapeshifting Uncertain 10-4-26
Mortgage Rates vs. UST Curves: Spooky Memories to Ponder 9-20-26