


Which villain? Inflation or Valuation?
The PPI pressures signal more trouble even as the combination of CPI and PPI news saw the UST curve lower with the 10Y UST now under 5.1% as we go to print. The FedWatch odds of tightening by the Dec FOMC meeting to 400-425 bps are now at 63.6%. The odds for the Oct meeting are 29.3%.
Equity pain in tech can be one factor in a flight to quality moving UST, but the potential is there for investors to factor in how slow growth could start to spill into fixed investment expectations as well as consumer resilience. Both have proven very resilient to this point. The assumption needle can move.
The higher YoY “Final demand” PPI inflation cuts across both goods and services with Total Final Demand PPI at +6.3%, Final Demand Goods at +9.8%, and Final Demand Services at 4.9% with all three higher than August YoY.
Intermediate goods and services PPI are also going the wrong way, so it gets tougher to spin the virtue of tariffs, war and the value of scaling back low cost sourcing alternatives. Then again, White House policy makers can just shout louder and use adjectives.
Reading the PPI release is like going to the gym. It is a good idea even when you want to skip it given the strain. There are a lot of tables and small fonts. The September 2026 PPI release was more interesting than usual with the backdrop of the UST curve lower, stocks weaker in recent days, and that price action coming at the same time as inflation is rising, deficits ballooning, and AI ecosystem and broader tech valuations are facing some second guessing.
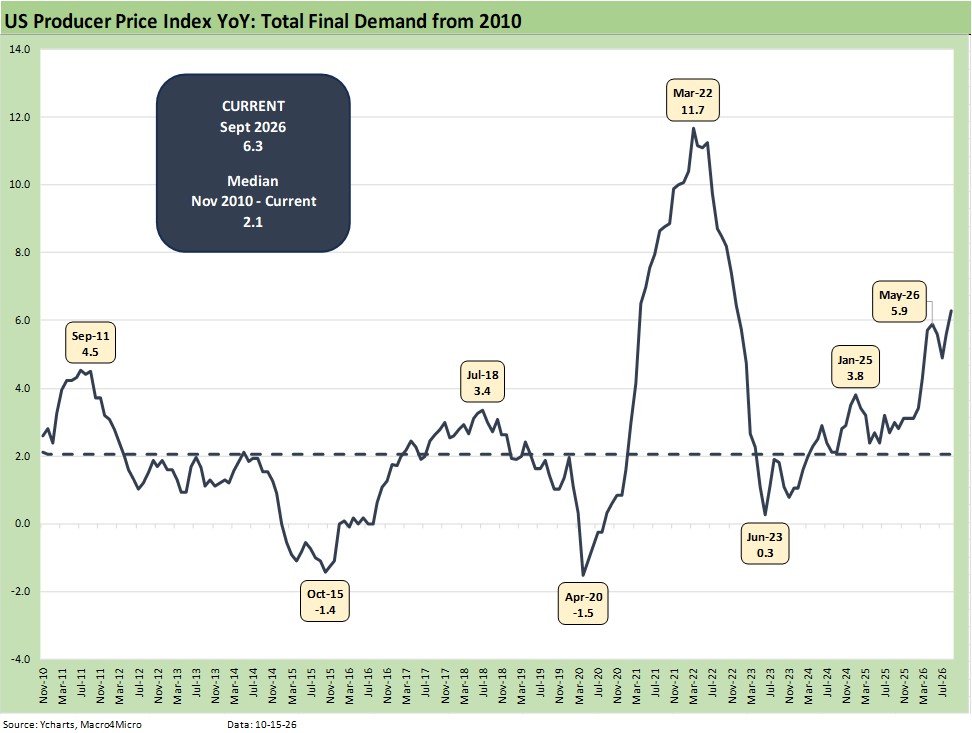
The chart details the PPI headline final demand from Nov 2010 through Sept 2026. The trend line tells its own story with PPI today posting 6.3% or triple the median from 2010 when the market was in the middle of Obama’s first administration.
Back in 2010, ZIRP was the Fed monetary policy that continued through Dec 2015. That came after the markets came out of the worst of the financial crisis period in 2009. As the rebound continued off the June 2009 lows, PPI hit 4.5% in Sept 2011 as the sovereign crisis also was cresting. We then saw another small peak in July 2018 at 3.4% before the post-COVID inflation wave into the 2022 peak.
For Sept 2026, the “worst since 2022” headlines for PPI today tell the story.
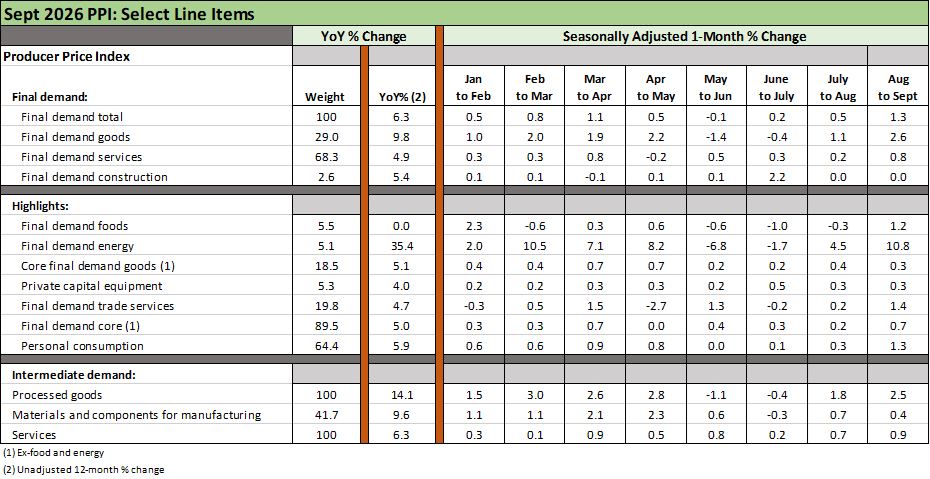
The above table updates some key PPI lines for Sept 2026. The trend is virtually all bad. PPI for YoY “Final demand total” ticked up to 6.3% from 5.4% in August. “Final demand goods” (29% of PPI index) YoY rose to 9.8% from 7.7% last month. “Final demand services” (68.3% of PPI index) moved to 4.9% from 4.5% in August. “Final demand energy” rose to 35.4% from 24.4%. That is ugly (and it sure is not Zelensky’s fault). We also highlight a few intermediate demand headline indicators at the bottom of the chart, and that is also bad news.
The sequential MoM moves is a “follow the bouncing ball” and scan exercise, and the ball is clearly bouncing the wrong way in Sept from August. Both “Final demand goods” and “Final demand services” show material increases. Energy is another notable MoM pain point, moving from 4.5% to 10.8%. “Final demand core” posted a MoM move from 0.2% to 0.7%
Overall, if you see PPI as a leading indicator, macro pressure remains high on inflation and/or on costs (and thus margins). Pricing power is an industry-by-industry and goods vs. services drill down exercise. As 3Q26 earnings keep rolling out, the market will hear updates on the various cost pressures from tariffs to energy and materials.