
Market Commentary: Asset Returns 6-8-26
A wild week of tech pain and UST weakness moves into a fresh CPI/PPI test ahead of the FOMC meeting the following week.


Pick one for this week, but they are both ceasefires.
We enter the week with a fresh wave of missiles in the US-Israel-Iran War (we mean “ceasefire” per Trump and “war is over” per Rubio). The oil experts continue to weigh in on what the supply shock will look like as the Strait disruptions continue. How that will impact the chain from oil to refined products is a material risk with EU and Asia on the ropes. China inevitably will step back in to buy and push the demand side at some point. Meanwhile, the fertilizer shock is a “brace for impact” X factor Washington does not discuss much.
Trump also is now launching his latest tariff gambit to recover the tariff revenue stream using “forced labor” as his angle (see USTR release on Section 301 tariffs). The USTR is worth a read how all the major (and minor) trade partners are guilty of violations. The USTR rationalization is worth a read while the White House tries to keep a straight face on how they care for the plight of oppressed workers in developing nations. The substance of the grounds is a lot like the Section 232 National Security grounds for upholstered furniture (seriously?!). The risk again now is whether trade partners respond.
As we cover in the charts below, the scale of the moves for tech on the downside are mitigated by the even more stunning recent spikes higher. The Semiconductor ETF (SOXX) at over a +79% return YTD and single names such as Dell (+213%) and Micron (+208%) along with Intel (+169%) are showing supernatural returns YTD even after this week’s sell-off.
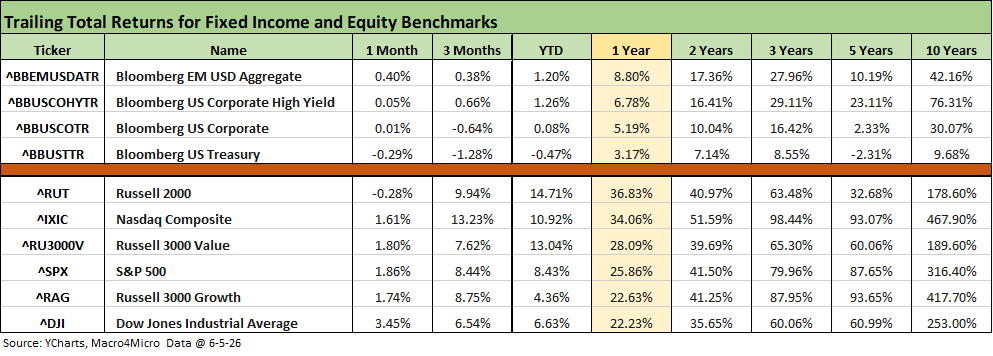
The above table updates various timeline returns for the major fixed income and equity asset class benchmarks we watch. The duration setbacks are evident in the UST index and the weak returns for the longer duration IG Corporate index. Credit spreads have remained quite compressed with HY and IG spreads signaling resilient credit risk appetites in bonds (private credit loans a different story).
Equities had a setback this week as we detail below, but the running time horizons are still impressive looking back YTD and 1 year. Even just for the 1-month period with all of this week’s “noise,” only the Russell 2000 small caps was in the red. The running 3-month and YTD numbers annualize to results well in excess (in some cases a multiple) of the long-term returns on the equity asset class.
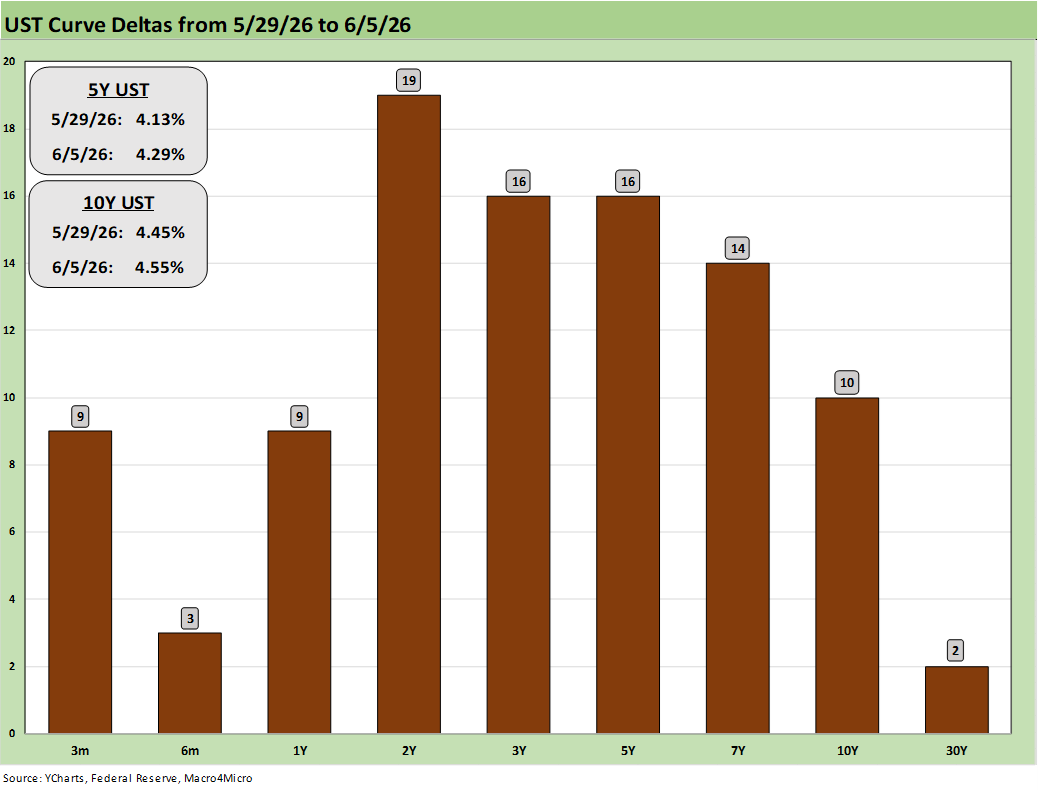
Another week of bad news for UST deltas undermined bond funds as we detail below. With Iran deal uncertainty, oil price swings, and the supply of numerous critical commodities from the strait looking questionable, the CPI and PPI data this week could complicate life for Warsh in his sales pitch to the FOMC to ease. Warsh is looking to pitch his new focus on modified data benchmarks. He may come across as more “axed” than analytical to his very seasoned and analytically oriented audience.
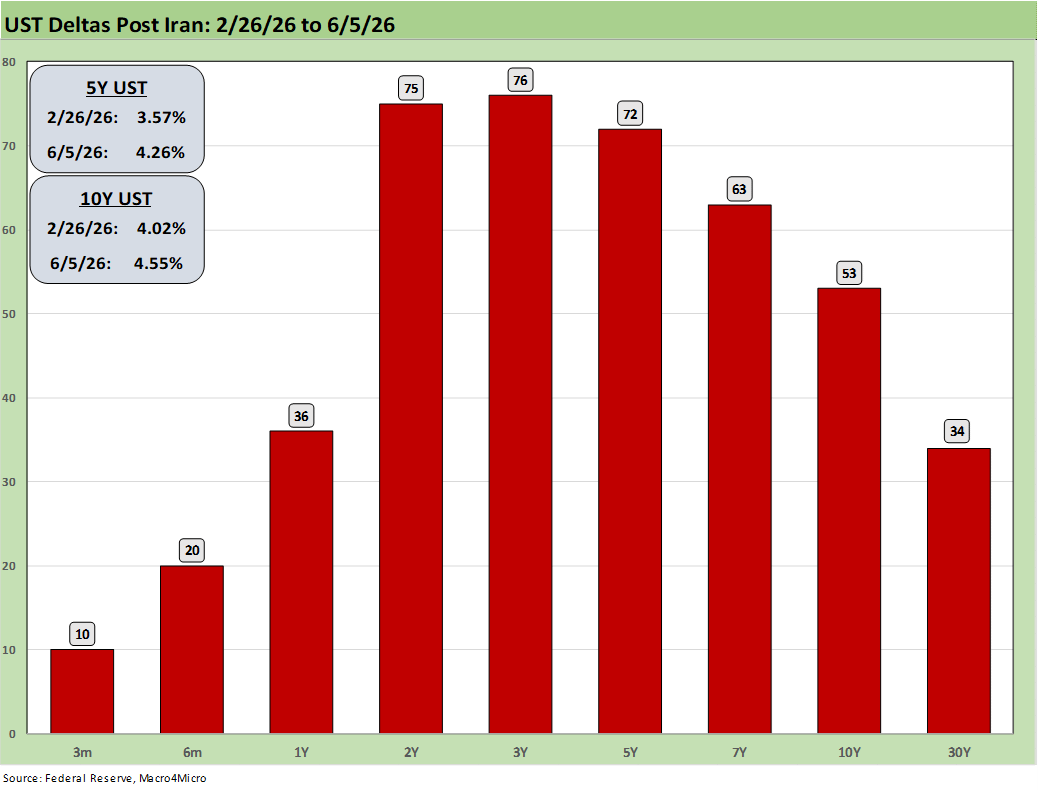
The above UST deltas basically cover the post-Iran moves. We start the timeline two days before the bombing began. The results are obvious enough. The economic talking heads can get into discussions of the economic definition of inflation (monetary only, yada, yada, etc.), but the big question for household economics is the erosion of purchasing power for the “household basket” and what adjustment they need to make in the face of a weaker household cash flow position. The plunge in savings rates may hold a clue (see PCE Inflation: Income and Outlays April 2026 5-28-26).
The Magnificent 7 heavy ETFs…
Some of the benchmarks and industry ETFs we include have issuer concentration elements that leave them wagged by a few names. When looking across some of the bellwether industry and subsector ETFs in the rankings, it is good to keep in mind which narrow ETFs (vs. broad market benchmarks) get wagged more by the “Magnificent 7” including Consumer Discretionary (XLY) with Amazon and Tesla, Tech (XLK) with Microsoft, Apple, and NVIDIA, and Communications Services (XLC) with Alphabet and Meta.
The “Mag 7+3” can be considered a key part of the tech drivers when Broadcom (AVGO), Oracle (ORCL) and Taiwan Semiconductor (TSM) are added to the mix. Those market cap rankings have been moving around across the months, and the growth in names such as Micron ($974 bn market cap 6-5-26) may require some new grouping and tag lines as 2026 proceeds. Oracle is more a software and systems company that has been volatile and has fallen off the pace (ORCL is a holding in the Software ETF, IGV). Taiwan Semi has been consistent, and Broadcom also is in “the trillion plus club” at this point.
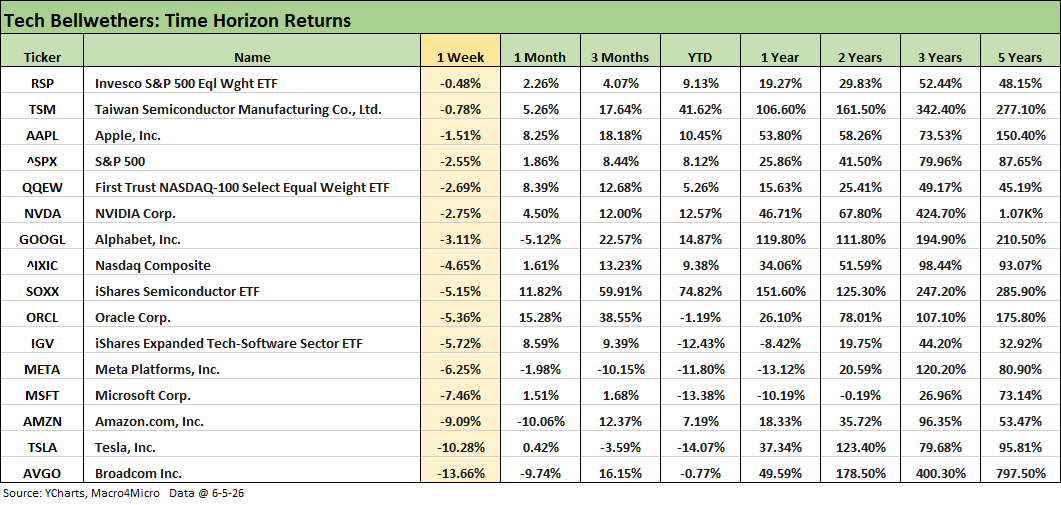
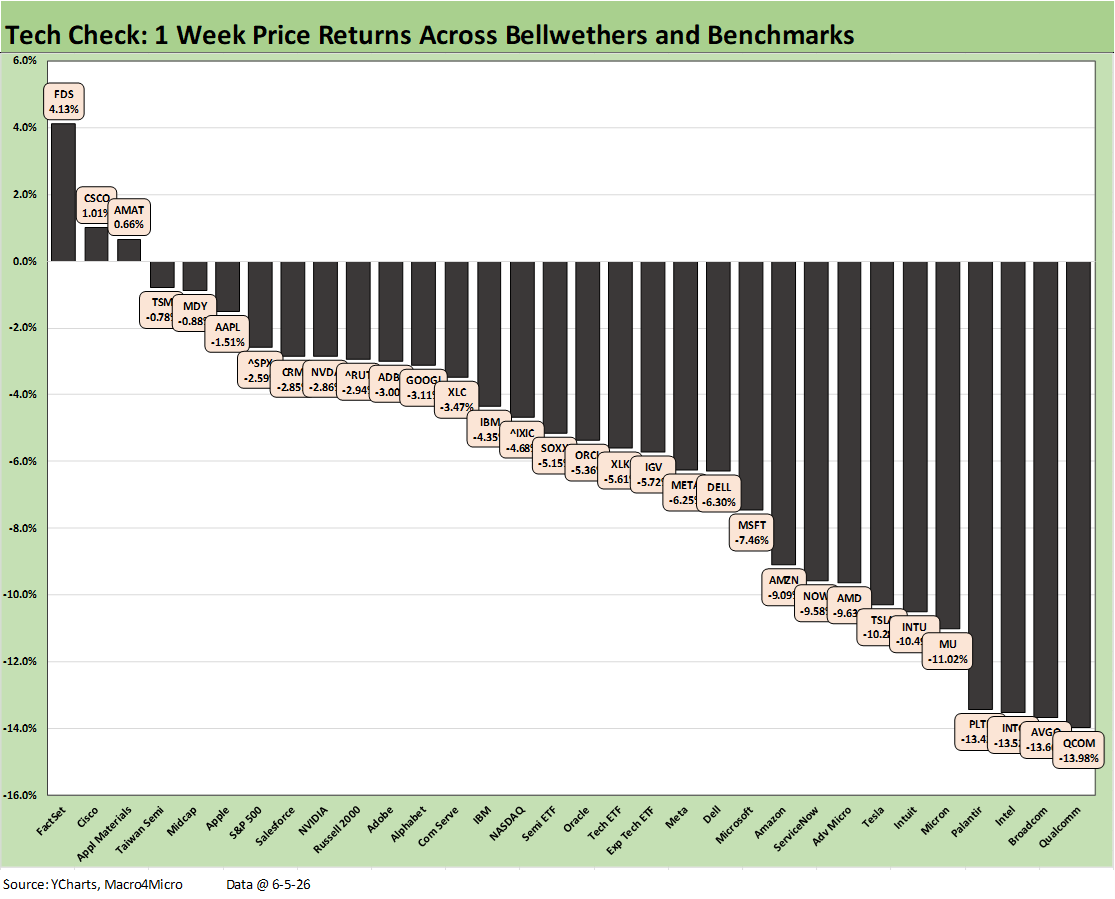
The above table updates the bellwether tech names and some key benchmarks and ETFs for the week. We see a shutout this week with all lines negative. Broadcom sitting on the bottom with -13.7%. We see the Semiconductor ETF (SOXX) at -5.15% and the Software ETF (IGV) at -5.72%. This week Oracle reports earnings as does Adobe.
The attached text was already posted on LinkedIn on Saturday. We update with some edits:
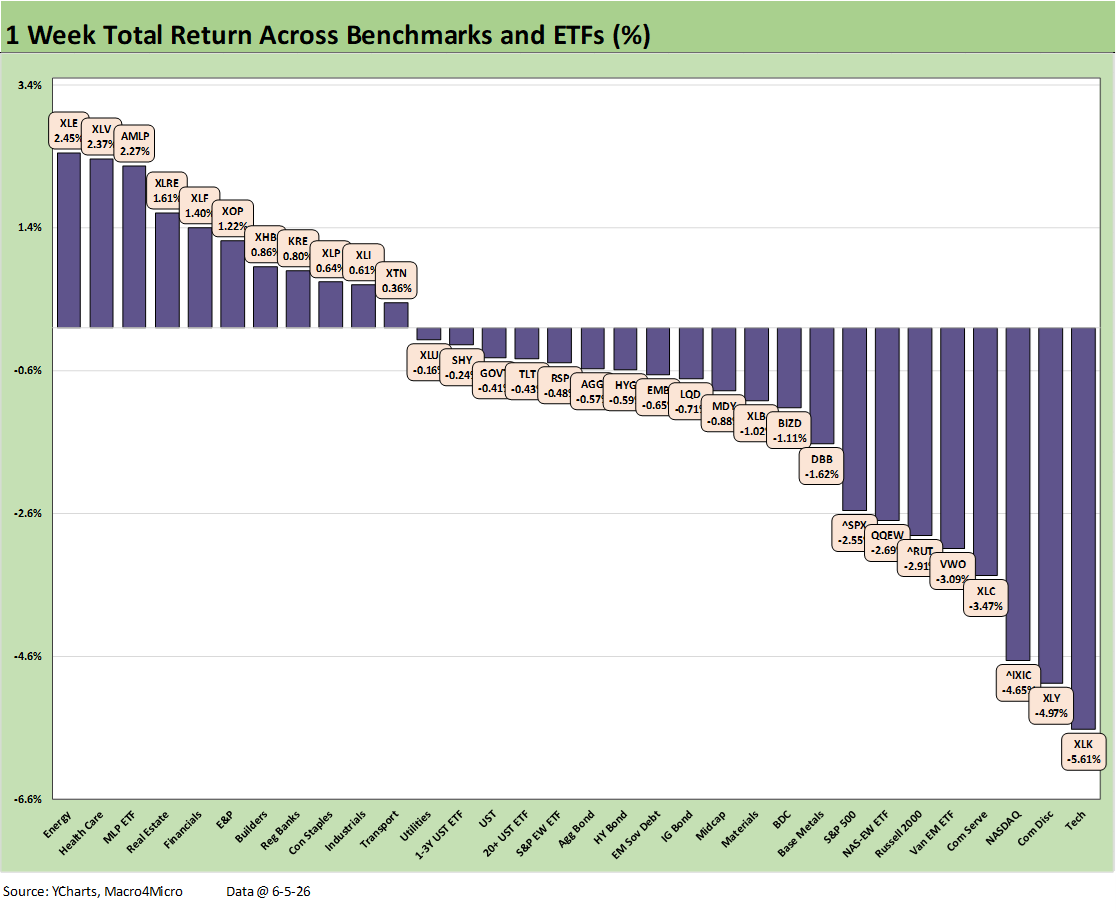
The broader mix of 32 benchmarks and ETFs show some broad-based pain with a positive-negative score of 11-21 that included carnage in tech and all the bond ETFs in the red this past week. The S&P 500, NASDAQ, Russell 2000 small caps and midcaps (MDY) were all negative. We can throw in the Dow as well, but we don’t include that in our checklist of 32 asset lines (30 companies makes it a low value indicator in our view with the Dow more about tradition).
We see the energy ETFs (XLE, AMLP, and XOP) back in the top quartile joined by Health Care (XLV). In a counterintuitive trend when the UST curve was not happy and UST deltas made adverse moves, we saw Financials (XLF), Regional Banks (KRE), Homebuilders (XHB) and Real Estate (XLRE) back in the top quartile. KRE and XHB made the top tier with minimal sub-1% returns, so the bar was low.
The S&P 500 saw its 11 sectors post a 6-5 positive to negative score, but larger sectors took a major hit with Consumer Discretionary at -6.2%, Info Tech at -5.4%, and Communications Services at -3.9%. Those 3 sectors are over half the S&P 500. NASDAQ was blitzed with a -4.7% return on the week with the Friday bloodbath cited as the worst “point drop” (not % drop) in its history.
The problem was clearly not just tech even if tech usually bogarts all the headlines. For example, we saw Ford Motor drop -14.6% on the week after its recent sharp rally that saw it partially close the 1Y return gap with GM. For Ford, it was more idiosyncratic with a major recall on some very popular nameplates (Bronco, Maverick).
More broadly for consumers, the worries around credit card debt total and quality trends have been picking up along with all the fears around Iran fallout. There is also the question of what the FOMC might need to say at its June meeting after this coming week’s CPI and PPI data on top of the solid jobs report.
Iran realities (vs. headline mis/dis-information) are not going as most had hoped. The further we get into the summer, the more the scenarios of oil supply disruptions and oil shock risk will get tested. Questions like “When will China start buying in scale again?” among others keep showing up in the oil trade rags.
Across the 32 asset lines above, we see the Tech ETF (XLK) in dead last and Consumer Discretionary ETF (XLY) just ahead with the NASDAQ 3 off the bottom and Communication Services (XLC) just ahead of EM Equities (VWO) in the bottom 5. The small cap Russell 2000, the Equal Weight NASDAQ 100 ETF (QQEW) and increasingly tech heavy S&P 500 are in the bottom tier. Among some other changes (POOL out, FLEX in), bumping Campbell’s out of the S&P 500 this month for an AI play in Marvell Technology was the end of an era.
The attached text was already posted on LinkedIn on Saturday. We update with some edits:
This week’s Tech Check mix was a contest for who would turn in the worst numbers as financial journalists scrambled for synonyms and other ways to say, “worst since.” The positive vs. negative return score in our Tech Check mix shown in the chart was 3-29 with all the broader benchmarks in the red as covered in a separate post. Beyond the NASDAQ and increasingly tech-heavy S&P 500, we see Russell 2000 also negative on the week. Note: We replaced Zillow with Dell since the Saturday LinkedIn post.
Friday was a brutal day as the headlines covered with the NASDAQ dropping 1,121.5 points for the worst single day in points in its history. For the decline in percentage terms of 4.2%, the drop was the highest since April 2025 in the aftermath of Trump’s reciprocal tariff pitch and ensuing chaos (including the UST market).
Disturbances along the UST curve can serve to undermine the growth stock valuation math, so the broader risk picture (massive, growing deficits, inflation, oil uncertainty, etc.) can weigh on portfolio decisions for those sitting on outsized unrealized gains built into positions.
All the Mag 7 names were in the red spread across each quartile with Apple (AAPL) in the top quartile while NVIDIA (NVDA) and Alphabet (GOOGL) were in the second quartile. Meta (META), Microsoft (MSFT), and Amazon (AMZN) were in the third quartile with Tesla (TSLA) bringing up the rear in the bottom quartile.
The 3 assets in positive range show a mild rally by FactSet (FDS) at #1 after the SaaS-based services equities have been beaten down YTD on fears of AI displacement. Legacy tech stalwarts Cisco (CSCO) and Applied Materials (AMAT) joined the small group of 3 posting positive returns. Of those in the top quartile, we see Midcaps (MDY) and S&P 500. Only Taiwan Semi (TSM) of the major semi names made the top quartile - but with a negative return. Salesforce (CRM) climbed back into the #8 position.
The Semiconductor ETF (SOXX) was at the bottom of the second quartile and Software ETF (IGV) was down in the third quartile. The bottom quartile is heavier on the semiconductor names than usual this past week with some of the usual underperforming software/SaaS suspects (Intuit, Palantir) plus Tesla. Oracle reports this coming week (6-10-26) with its fiscal 4Q earnings report.
The overall profile of returns was grim with 7 asset line items posting negative double-digit returns and the #1 performer (FactSet) at only +4.1% and the #2 performer (CSCO) at 1.0%. No joy for tech for the week and ended on a bad note.
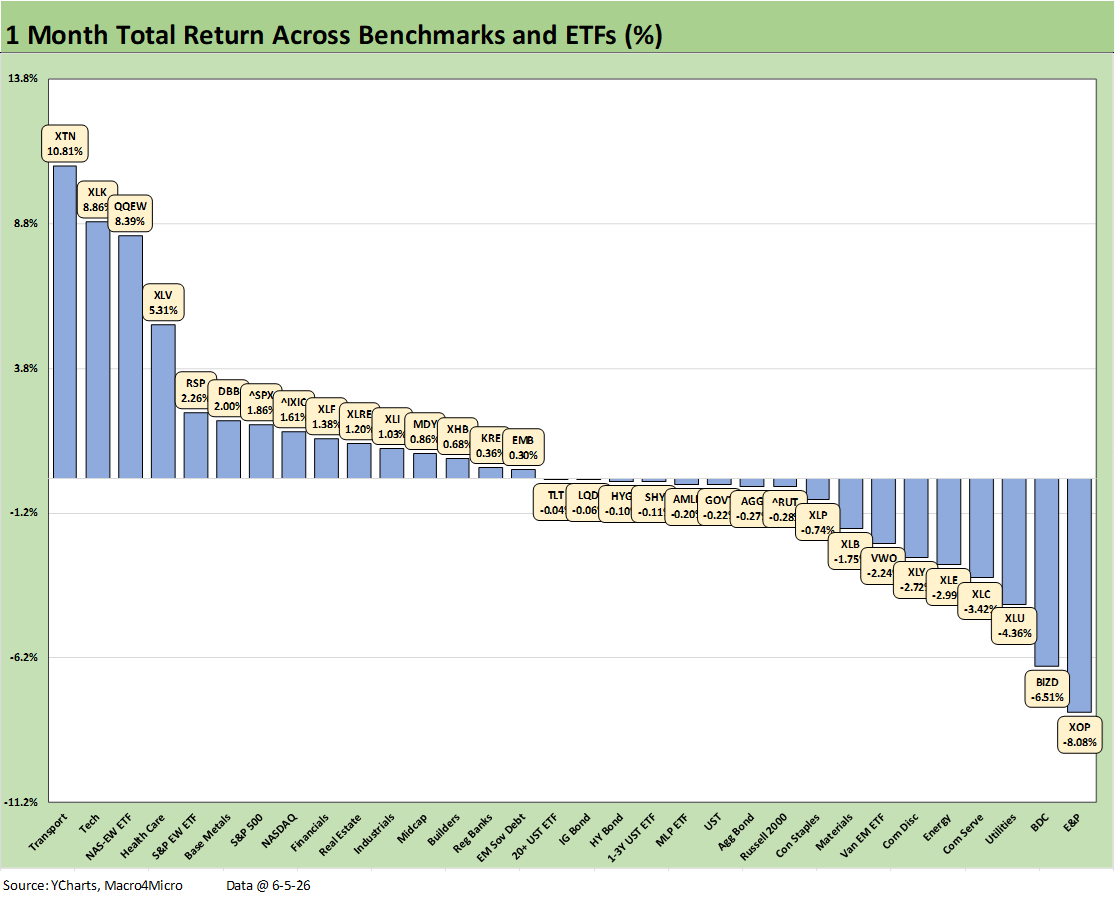
The trailing 1-month timeline trimmed a strong May record with the 24-8 score for 1-month returns last week giving way to a 15-17 positive vs. negative tally this week. We see 5 of 7 bond ETFs in the red in the above with two on the positive side but close to zero.
E&P (XOP) and Energy (XLE) dropped into the bottom quartile while Midstream Energy (AMLP) was slightly negative in the third quartile. BDCs had another bad month at second to last. The important Consumer Discretionary ETF (XLY) and Communications Services ETF (XLC) – among the largest of the 11 S&P Sectors – were in the bottom quartile.
The winners include Transports at #1 and followed closely by Tech (XLK) and the Equal Weight NASDAQ 100 (QQEW) as the bad week in tech did not cut too far in the prior banner weeks. Interestingly, the Equal Weight S&P 500 (RSP) ranked #5 and outperformed the 4 broad market indexes.
The tech drama has really picked up in recent weeks with dramatic swings higher and lower, but the semiconductor and AI ecosystem is overwhelmingly biased higher. The software and SaaS-based service providers have been whipsawed around in the “AI displacement” theories and existential threats to business models (or at least threats to growth rates and “price x volume” threats).
We have covered the big movers in past weekly posts on LinkedIn and Substack (see Market Commentary: Asset Returns 5-31-26). With the search for anything with a direct and/or indirect relationship with AI, the results have been stunning with legacy incumbents such as Dell or Intel running off the charts in some weeks.
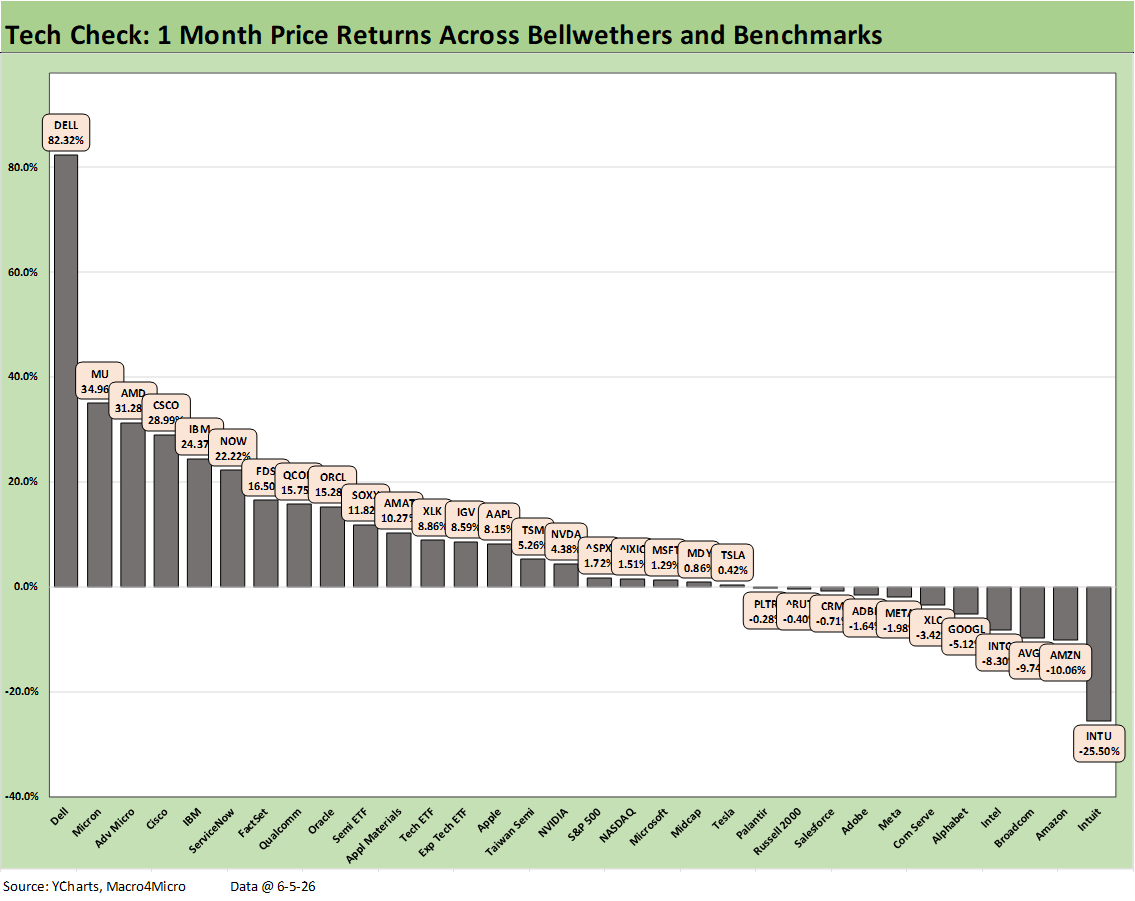
We will get more color from a megacap this week with Oracle (ORCL) earnings. We will also get a fresh round of explanations from Adobe (ADBE), who is posting a YTD return deep in the red zone (-28%). For the railing 1-month, ADBE was slightly negative at -1.64% and trailed the Software ETF (IGV) with its +8.6% return.
The software and SaaS names are still showing a lot of pain in the 1-month chart. We removed Zillow from our tech check mix to make room for Dell, but Intuit (INTU) on the bottom still highlights the “AI threat” effects on the SaaS front.
The 1-month bottom quartile is more mixed now with 3 Mag 7 names in the bottom tier mix (AMZN, GOOGL, META). We also see Broadcom (AVGO) taking a fall for the 1-month period with Intel (INTC) and Communications Services ETF (XLC). These names have been really swinging around.
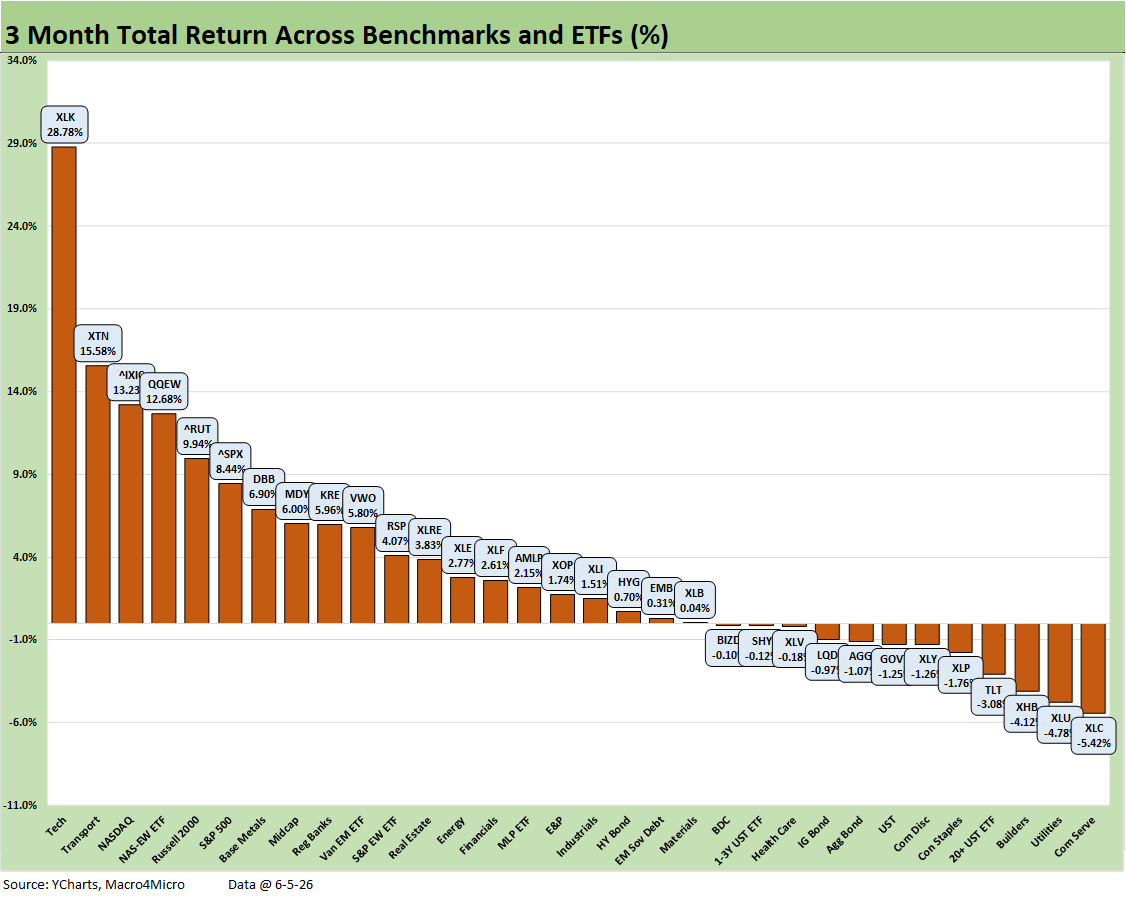
The 3-month horizon gives a better visual on the immediate post-Iran period with the reaction to inflation worries and the UST yield curve and consumer reactions that might unfold. The 20-12 score for the broader mix of 32 asset lines shows resilience. That has been supported by the stock market momentum and a stabilization in jobs numbers – even if the occupational mix lacks the optimal multiplier effects in such areas as manufacturing (see Employment May 2026: Big Rebound, Low Multiplier Bias 6-5-26).
We see 5 of 7 bond ETFs in negative return range with only EM Sovereigns (EMB) and HY (HYG) slightly positive at returns below 1%. Among the weaker lines, we see Homebuilding (XHB) feeling mortgage rates with the dividend-heavy story lines such as Consumer Staples ETF (XLP) and Utilities (XLU) underperforming. The XLP and Discretionary Consumer ETF (XLY) also reflects worries around inflation pressures and how core spending items such as gasoline and electricity bills were going to weigh on personal consumption.
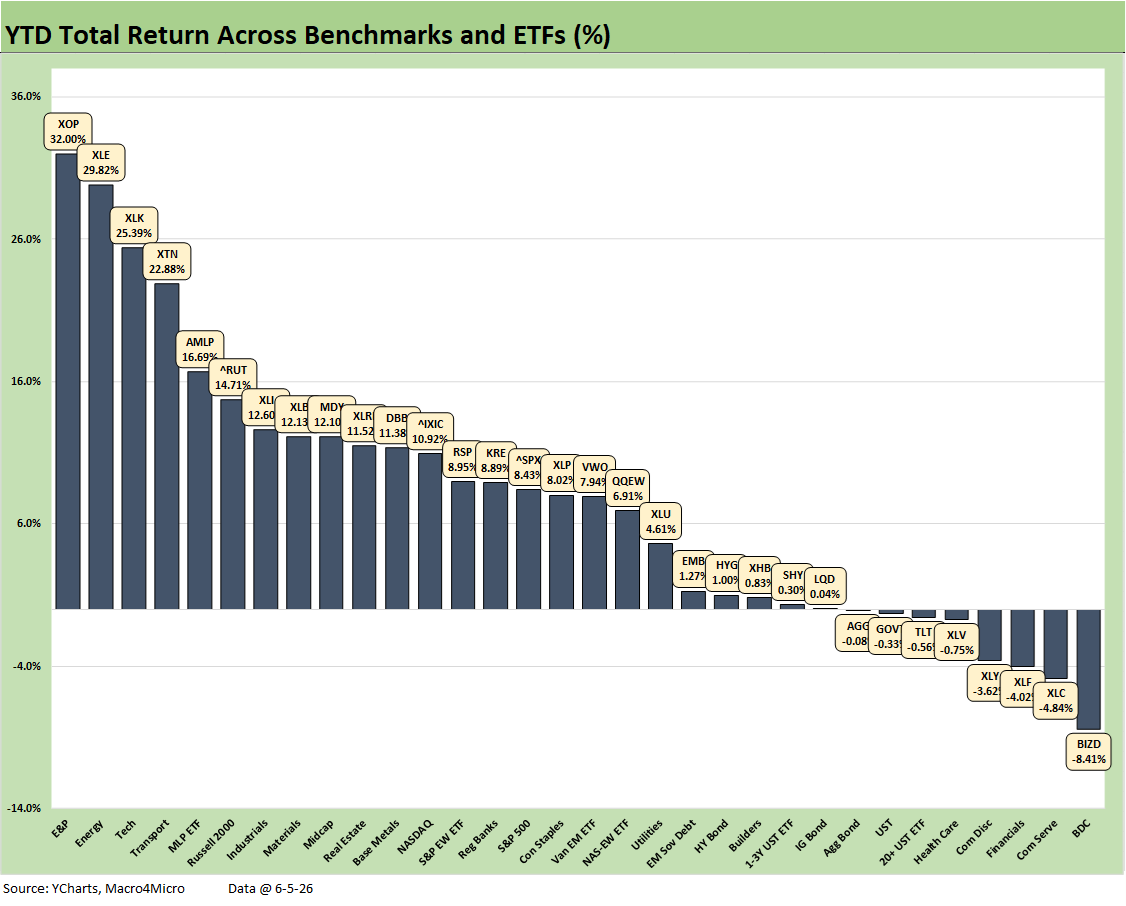
The YTD score for the broader 32 benchmarks and ETFs weighed in at 24-8 YTD with duration only sending 3 bond ETFs into the red zone with 4 bond ETFs just across the line. The easy winners were in energy with XOP at #1, XLE at #2 and AMLP at #5. Tech (XLK) at #3 and Transports (XTN) at #4 rounded out the top 5.
The private credit setbacks show BDCs (BIZD) mired in last place on a combination of high profile headline disaster names (including fraud) and the growing awareness of the very unsurprising reality that leveraged, private loans of smaller cap companies are not liquid in the face of redemption requests. Some earnings releases and efforts to improve transparency helped calm some nerves recently. Asset managers have reminded the market of what a large and diverse mix of borrowers (by quality, industry, and alternative funding options) are in the broadly defined market of “private credit.”
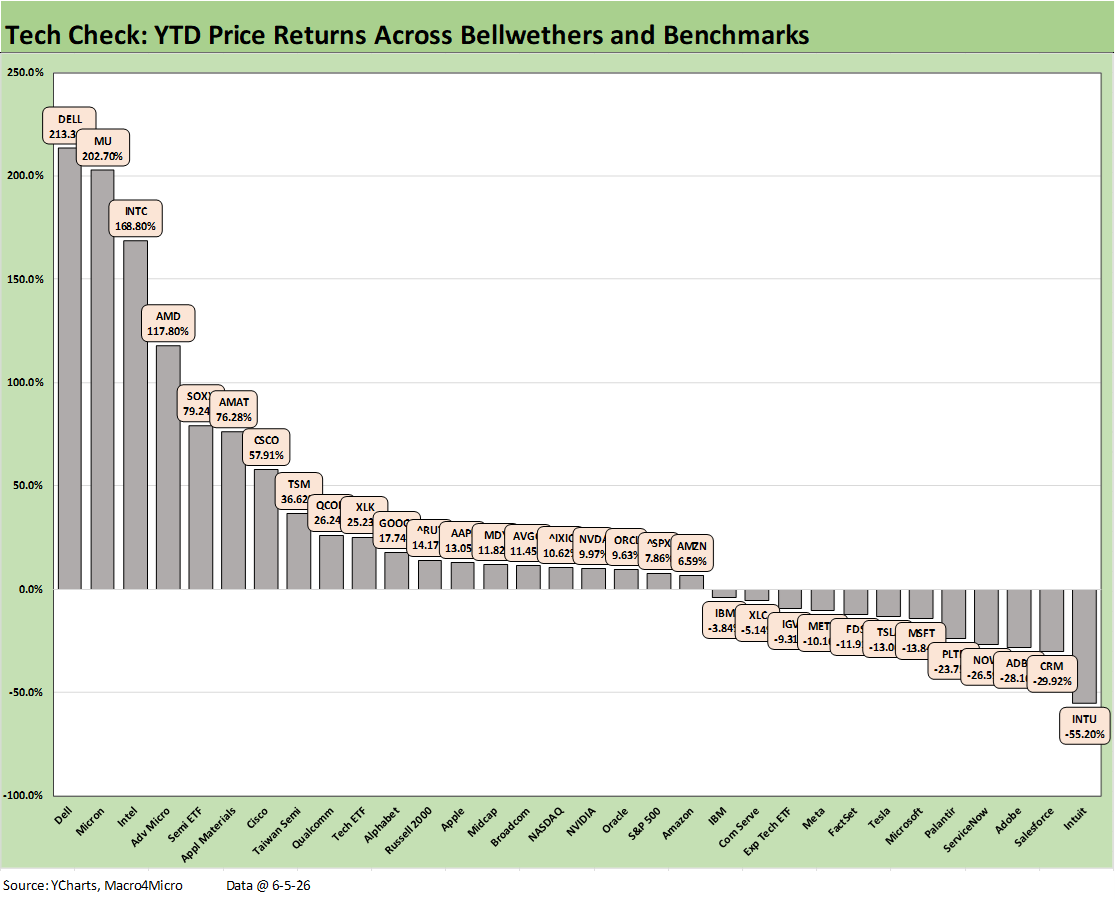
The YTD Tech Check return offers a stark reminder that “tech” covers a wide expanse of names going through rapid secular shifts. Some of the names are on a pure growth and expansion curve while others are exposed to slowing growth or “zero sum” syndrome. The score of 20-12 on the chart reflects that reality with many software and SaaS-based service names taking a beating YTD.
Semiconductors were big winners and “anything AI” and “anything inside the data center” took off with the market suddenly loving Dell in recent weeks. The YTD return of 79.2% on the Semi ETF (SOXX) is in stark contrast with the -9.3% on the Software ETF (IGV). The recent swings in legacy names with more business line diversity such as IBM show investors spreading their exposures across more product subsectors.
The bottom quartile runs from -11.9% for FactSet (FDS) to -55.2% for Intuit (INTU). We had bumped Zillow from our Tech Check list to make room for Dell, but Z is running around -48.6% YTD or modestly better than Intuit.
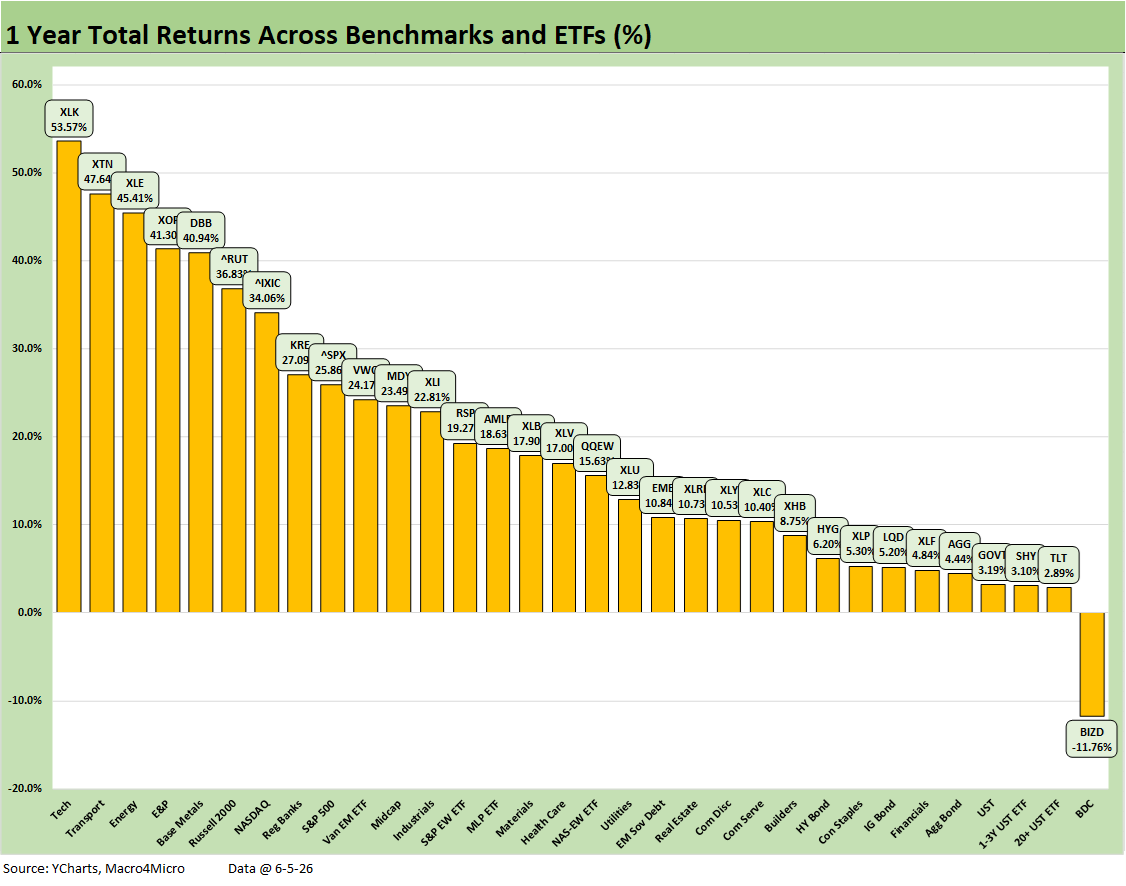
At 31-1 positive vs. negative is clear enough with the Tech ETF at #1 posting a +53.6% return and BDCs (BIZD) sitting in last place with -11.8%. The median return in the mix is around 16.3%. It took 27% to make the top tier.
The bottom tier shows bond ETFs comprising 5 of 8 joined by BIZD, Financials (XLF), and dividend-heavy Consumer Staples (XLP). Financials have been a mixed bag with the struggles of private credit and software exposure as well as potential setbacks in interest margin on cost of funds expectations with FOMC policy now more likely exposed to tightening.
The winners LTM include a mix of tech (XLK, NASDAQ) and Energy (XLE, XOP) with Base Metals (DBB) riding the commodity price wave from Gulf supplier chain disruptions – notably for Aluminum and Copper (via sulfur). Transports (XTN), Russell 2000, and Regional Banks (KRE) rounded out the top tier as we have covered along the way.
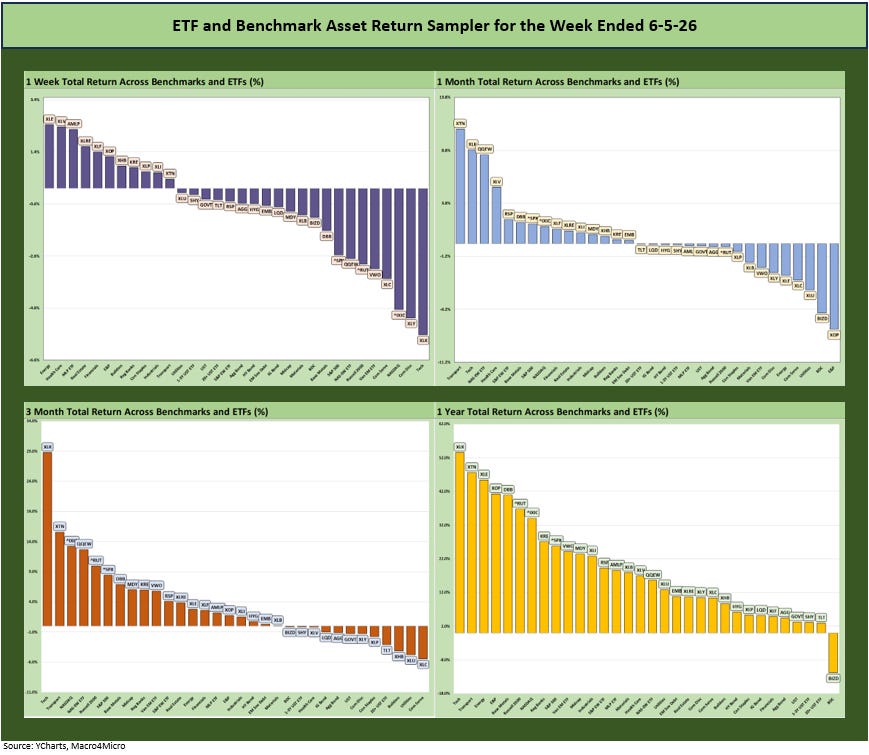
The above chart provides a visual of the positive vs. negative symmetry across the various time horizons. As time marches on, results are arguably going in the wrong direction for breadth despite the dazzling tech numbers.
See also:
Employment May 2026: Big Rebound, Low Multiplier Bias 6-5-26
The Fall of CBS 6-3-26
JOLTS April 2026: A Modestly Positive Turn 6-2-26
Retail Signal Read Part Deux 6-1-26
Market Commentary: Asset Returns 5-31-26
New Home Sales April 2026: Slow Start to Spring 5-28-26
PCE Inflation: Income and Outlays April 2026 5-28-26
GDP 1Q26 Second Estimate: Shrunk in the Dryer 5-28-26
Retail Equity Comps: Looking for Signals 5-26-26
Housing Starts April 2026: Soft Starts in Single Family 5-22-26
D.R. Horton: Financial Powerhouse Despite Cyclical Softening 5-20-26
Taiwan: Stakes are High, US Awareness is Low 5-17-26
Industrial Production April 2026: Bringing a Lift 5-15-26
Existing Home Sales April 2026: Steady or Clinging? 5-14-26
Producer Price Index April 2026: Heat Rising on Cost Inputs 5-13-26
CPI April 2026: 4.1% All Items Less Shelter, 30Y UST 5% 5-12-26