
United Rentals: Another Bellwether Supporting the Macro Health Story
We look at the United Rentals results and guidance as another good lens to view end market health in key verticals for 2024.


United Rentals (URI) capping a year of record revenues, earnings, and cash flow with a record EBITDA quarter reflects the outperformance of URI in its space and presents another good proxy for activity levels in the broader nonresidential and industrial subsectors.
With its broad and diverse equipment base and geographically diverse branch network, URI’s revenue cuts across a wide range of counterparties large and small serving a broad array of end markets in its construction and industry verticals.
Construction is in a very busy period right now in infrastructure and manufacturing, and sustained strength (even if slower growth rates) shows up from macro level indicators down to sea level at service operations such as URI.
URI credit ratings are long overdue for upgrades to full investment grade given the credit metrics but also given how equipment rental should be viewed as presenting a lower business risk at URI relative to other BBB tier industries and issuers.
While the layered capital structure complicates the ratings tier methodologies, we see URI as a solid credit overweight for BBB tier and BB crossover buyers given URI’s strong financial profile and BBB quality metrics.
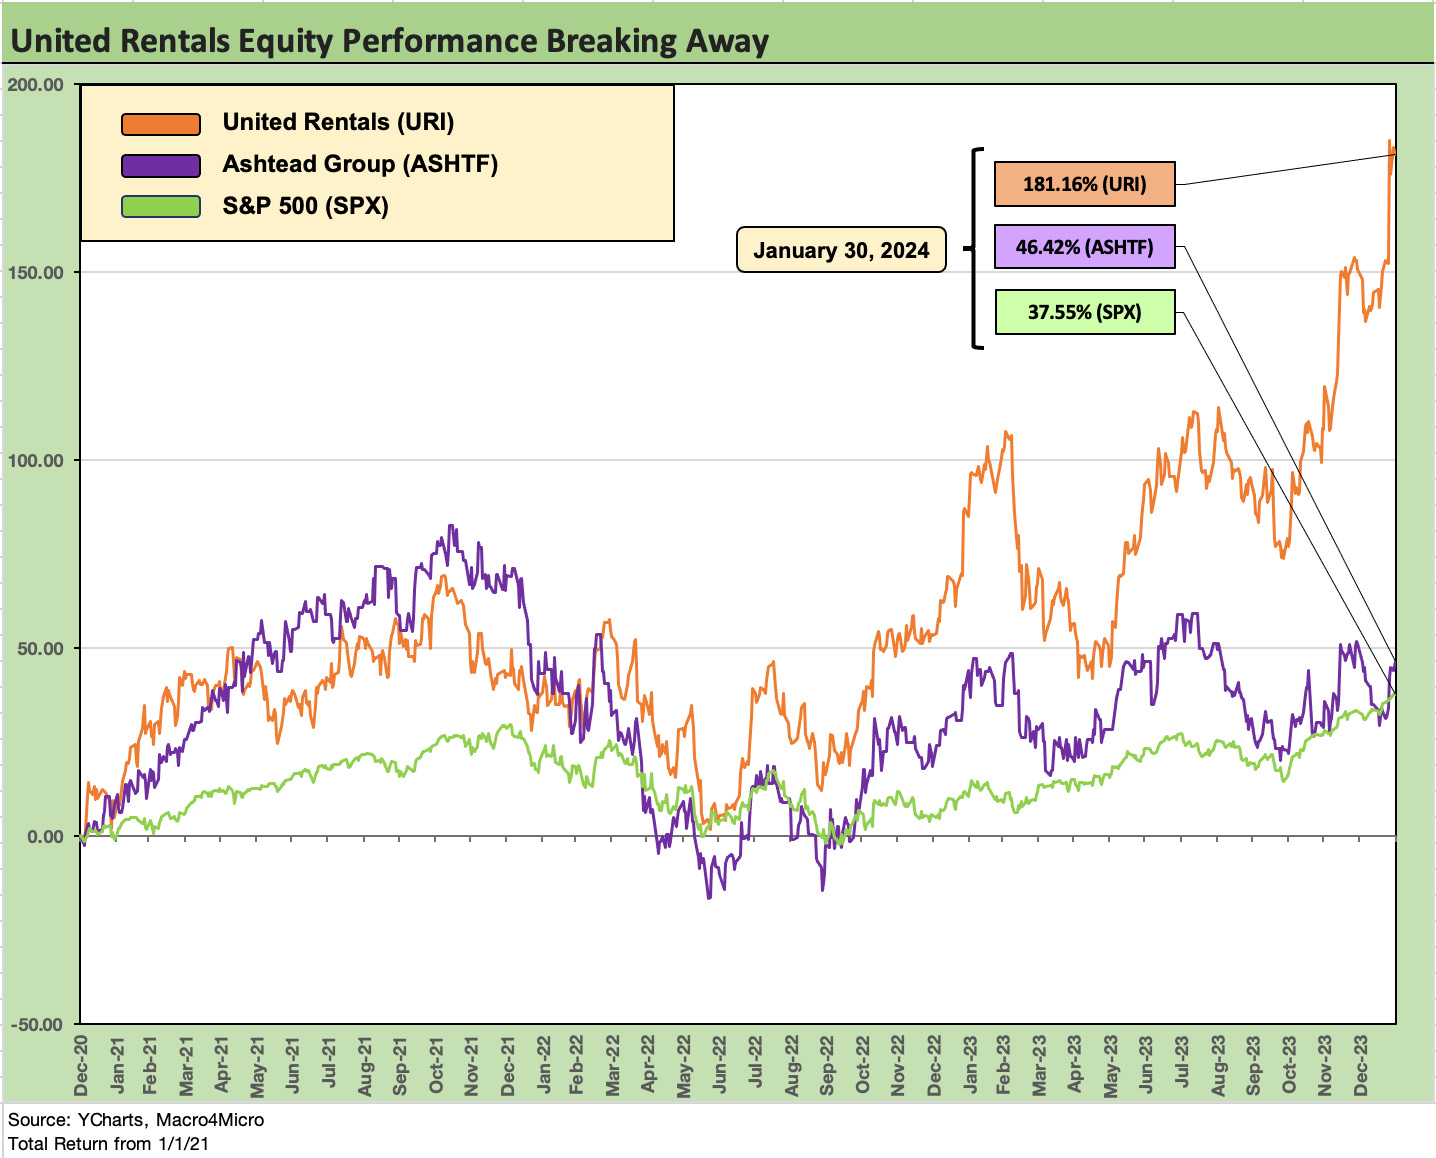
The above chart hammers home how well URI had framed up across the post-COVID period after earlier demonstrating its financial resilience (yet again) during a very volatile period. Recent years saw supplier chain disruptions, volatile energy markets, inflation spiking, and severe monetary tightening, but URI saw its equity pull away from the peer group leaders in equipment leasing while the company was making more major acquisitions and integrating those deals. URI stock outperformed the major bellwether equipment OEMs as well as other lessors.
All the while, URI initiated a dividend while sustaining a high rate of buybacks and lowering its target leverage range. URI is down at the low end of the new 1.5x to 2.5x range for Net debt/EBITDA and 2024 leverage ended substantially lower than in 2019. A 10% dividend increase was announced with 4Q23 earnings. URI is guiding to $1.5 bn in buybacks in 2024.
There is no shortage of extra buzz around mega-projects (semis, battery plants, LNG, broader infrastructure plans in the public sector, etc.) with multiyear tailwinds, so any setbacks in those will be worth monitoring on how much growth or pricing power and used equipment assumptions the stock players want to build into valuations. When a company stock diverges from peers so materially, the equity valuation jitters will remain high on any more signs of growth slowing. The sheer rate of activity that URI can cite as it expands its fleet tells a good story for the soft-landing advocates.
From the standpoint of credit quality, even a tapering of growth expectations still leaves URI as a major free cash flow generator at $2 bn or higher with a lot of options to adjust its fleet and plan any combination of M&A and/or buyback adjustments.
We looked at URI in the context of BBB tier spreads and framed vs. Ashtead on the high end and Iron Mountain and Service Corp among larger issuers in the BB tier that get crossover attention. URI looks to be fairly priced if ratings do not move, but we believe the move to higher credit ratings is overdue for the secured and unsecured bonds in 2024 given the size of the balance sheet layers and performance of the company. We see the less cyclical services names as better credit comps for business risk even if we like to also frame URI equity vs. the equipment OEMs as proxies for demand.
So we stick with an overweight on the credit.
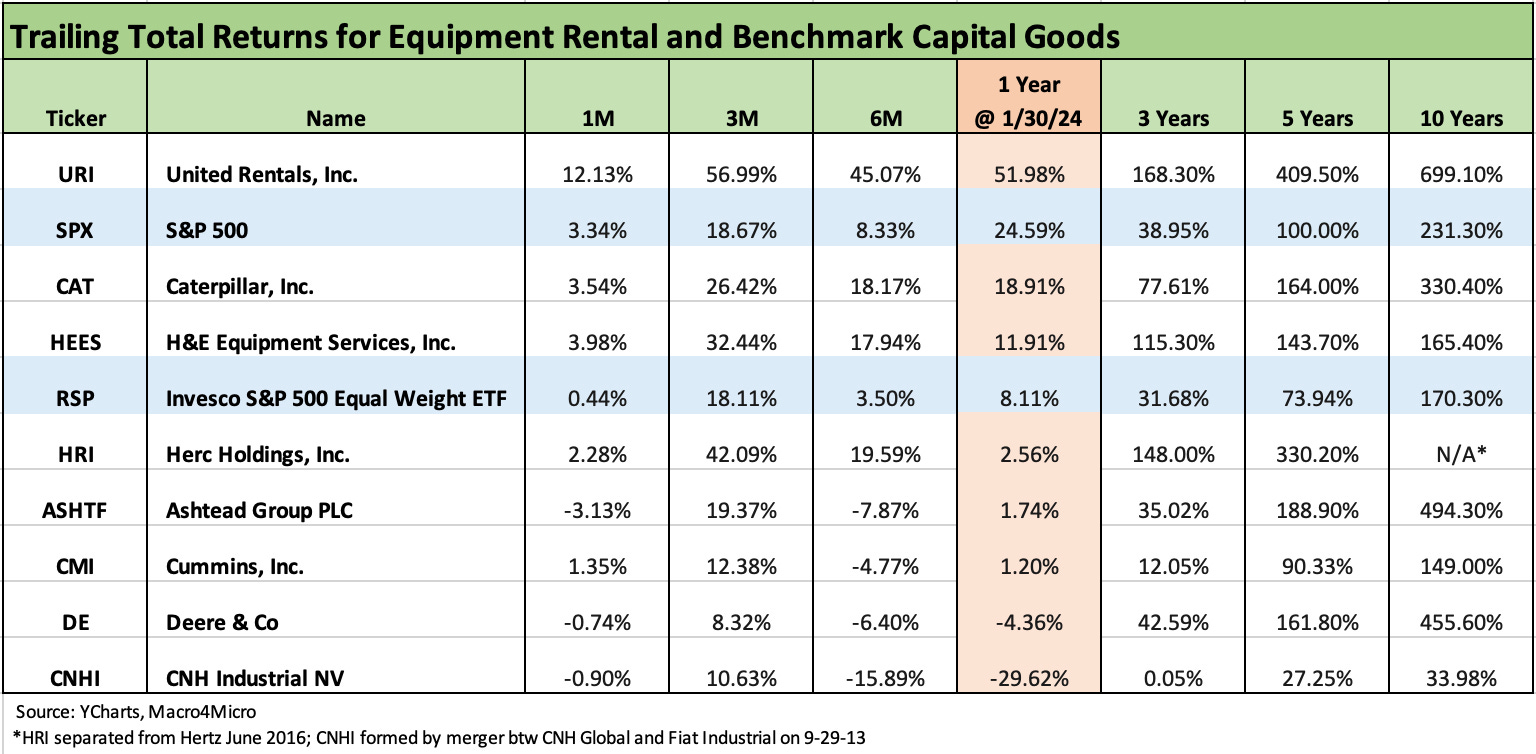
The above chart tells a similarly bullish story about URI across more time horizons. The peer group in the chart for leasing includes Ashtead (Sunbelt brand) as the strong #2 in the space (see Ashtead 4Q23/FY 2023 - Company Comment 6-14-23), Herc Rentals (ticker HRI) as the #3 player spun off by Hertz back in 2016, and H&E Equipment Services (ticker HEES). We also drop in CAT, CNHI, DE, and Cummins as heavy cyclical comps. Those names are useful proxies for the machinery and equipment end markets and related cycles.
Just look at the URI return at the top and scroll down in the column for each time horizon and the conclusion is pretty clear on relative performance. Recent periods have benefited from a mix of cyclical recovery in equipment demand with GDP growth showing solid fixed asset investment rates. We also see booming construction markets broadly tied to government policy and incentives for the private sector (see Construction Spending: Timing is Everything 12-1-23, Construction: Project Economics Drive Nonresidential 10-2-23).
The US has not had this type of infrastructure focus underway for decades, and that was a choice of how Biden could use his bullets in the inevitable 2-year window. As we have looked at in earlier comments, Trump used his “window” for tax cuts (Dec 2017) and trade battles (2018). Obama used his two years for health care (ACA) and financial reform (Dodd-Frank). Choices matter, and they have economic impacts. URI has been a big winner with both Trump’s tax plan and energy promotion (notably pipelines) while Biden’s focal points (CHIPs, EVs, infrastructure) turbocharged URI results across a range of verticals. URI had a bipartisan double header.
A busy decade for URI…
The 10-year period includes an energy spike and crash followed by some trade battles and then a pandemic. We saw record moves lower in corporate tax rates after the Dec 2017 tax bill designed to encourage equipment investment. That game plan had some rough patches that led the Fed to ease 3 times in 2019 on weak fixed asset investment. URI kept on investing, but many companies faded on the trade uncertainty. In other words, that was a wide range of macro backdrops even if it was part of the longest expansion in history. In that mix of leasing companies and capital goods manufacturers, URI came out on top in returns for 10 years and again for 5 years.
The expanse of those 10 years was a secular growth period in the shift toward leasing over owning. The equipment leasing service operators in the mix rode that tailwind. The increased use of leasing was a matter of cost (lease vs. buy economics, who buys equipment in bulk, etc.), utilization, financial flexibility, the complexity of equipment and personnel needs, reduced risks on repair downtime, and a growing mix of connected equipment that can complicate fleet replacement cycles.
We have watched United Rentals directly or indirectly from a research management seat for over two decades since its IPO and active HY bond issuance as a “ramp-up roll-up.” URI has shown their mettle across some very volatile periods and many billions of M&A and successful integration exercises after acquisitions – including the most recent Ahern deal.
What used to look like a major deal for the company now qualifies as a bolt-on. The most memorable megadeal was $4.2 bn for RSC when URI was a much smaller company back in 2011 (deal closed in early 2012). They never looked back, and the deals kept coming. As an aside, the RSC deal was 60-40 cash and stock. These days they write a check for multibillion dollar deals.
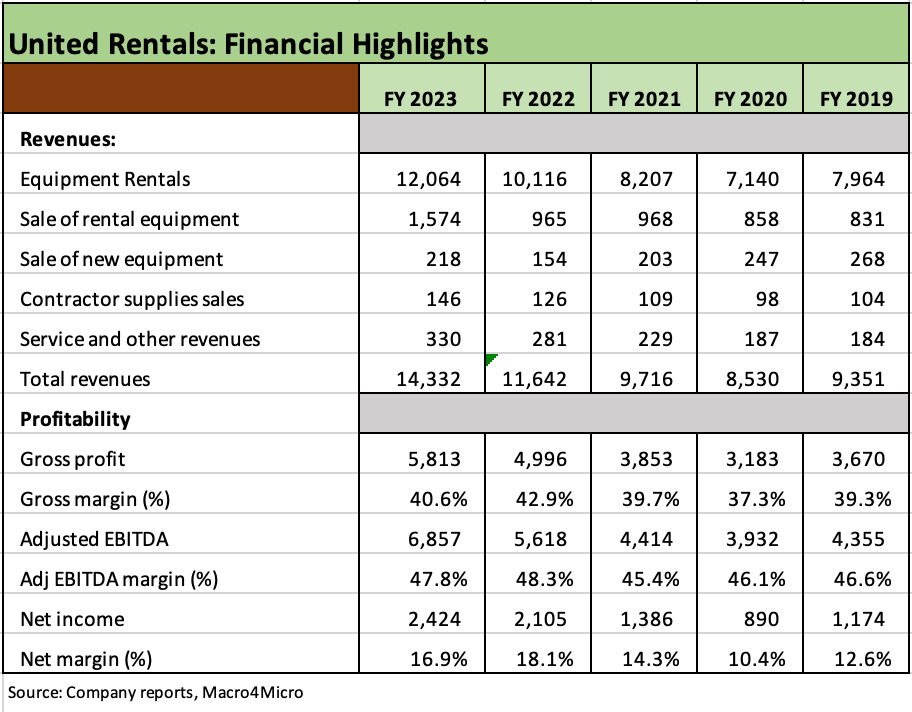
The above chart runs through the revenue mix and trend line since 2019 ahead of the COVID turmoil. We also post the gross margin, EBITDA margin and net margin lines. URI posted strong growth in revenues at the total revenue line and equipment rental line on steady growth and more M&A including the Dec 2022 Ahern Rentals acquisition.
The excitement around the sheer magnitude of the EBITDA margins needs to be tempered by the reality that such fleet assets need to be replaced. In some ways, that super high EBITDA margin has some similarities to E&P companies given the intrinsic need to replace what you deplete (or in URI’s case depreciate). That EBITDA and capex relationship is favorable, and the free cash flow schedule further below documents how URI has been and will remain a strong free cash flow generator after all the moving parts (including equipment dispositions) are sorted out.
The “net capex” and used equipment quirks in fleet management…
The very deep, used equipment market has been more important across the post-COVID period given the supplier chain problems. These equipment availability issues were addressed at length on the earnings call as the original equipment cost recovery rate on a used equipment sale had risen sharply during the post-pandemic period into the 70% range and is now back down to the 60% handle range as life gets back to normal. The pre-pandemic period was in the 50% handle range. That is on the short list of negative trends, but it was part of a “pandemic asterisk” that was out of line with historical relationships.
The dominant income statement lines will always be rental revenues, but the sale of used equipment is a core activity and standard part of URI’s fleet management process. The quality and mix of equipment as well as fleet sizing practices is an important part of the URI advantage across cycles as URI balances its growth rates and replacement cycles with an eye on broader pricing power (or pressure) and end market demand.
“Net capex” and the mix of fleet expansion vs. fleet replacement is part of the exercise across the cycles. In the most extreme example, you can see fleet liquidation where sales of equipment exceed gross capex. That has been rare across the decades but has briefly happened during crisis periods.
As noted above, the used equipment market resulted in some favorable distortions that are now “normalizing” (which is “Wall Street speak” for going lower and less favorable). URI cited original equipment cost recovery on used sales was expected to be around 60% in 2024, down from 66% in 2023 vs. the more normalized historical rate of 50% to 55%. The supplier chain problems during COVID put the equipment rental companies in an interesting position since they had the fleets that many needed. Used fleet values remained strong but will now settle in to more realistic levels.
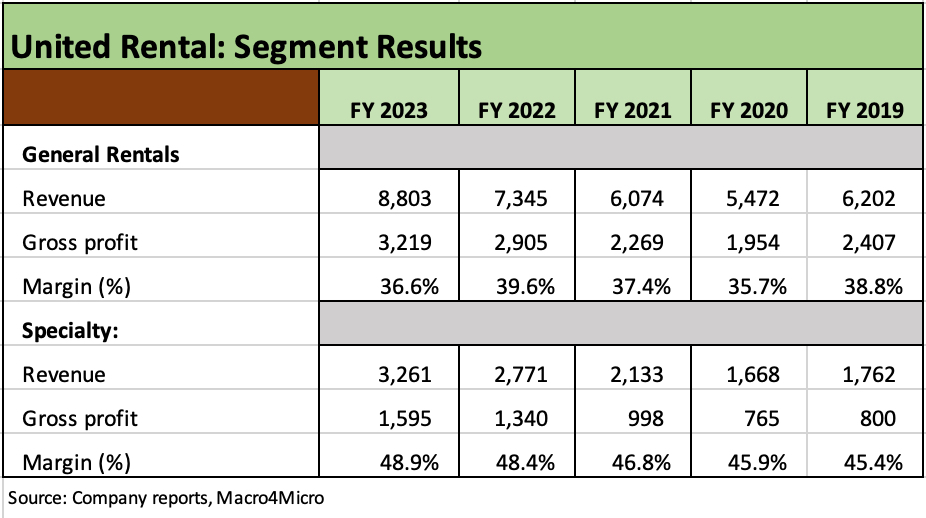
The above chart updates the two reporting segments which are simply broken into General equipment and higher margin Specialty equipment. Both are very much a core part of the business given the range of projects served by URI. The company has emphasized how some of the lower priced and lower margin equipment types can offer very attractive returns over time based on their role in longer term large scale mega projects where URI can field a very complete set of equipment types. This is notably the case in some of the multiyear mega-projects.
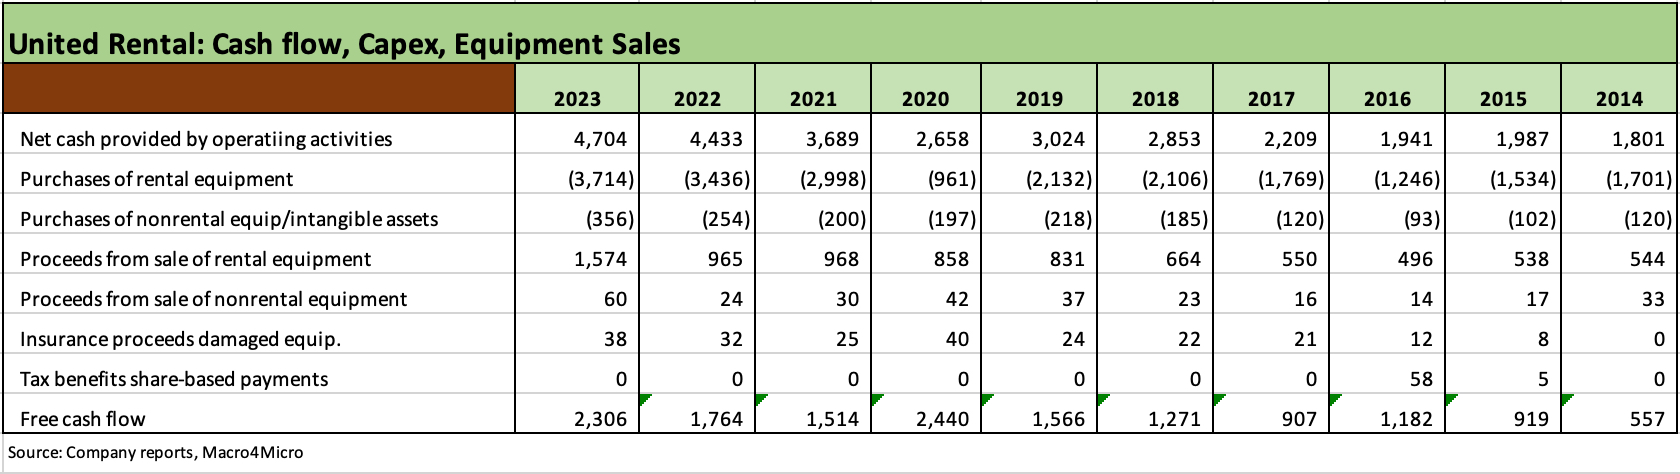
The above chart looks back across the longer time frame from 2014 through 2023 for a 10-year history. The timeline provided each quarter by URI offers a good visual that captures the growth across cash flow metrics and capex (both gross and net of equipment sales). The free cash flow line can move around with the capex and fleet expansion programs and extensive array of acquisitions. URI is guiding to another good free cash flow year in 2024 with expectations in the $2 bn to $2.2 bn area.
We did not include the “purchases of other companies net of cash acquired” in the above FCF chart to keep it more locked in on the normal course of business. URI has been buying companies big and small across the cycles with the most recent major deal being Ahern Rentals (a Top 5 player at the time) for $2 bn in cash. M&A integration risk is always a factor as operations are rolled in and rationalized, but URI has done so many successfully that the integration risk can now be called “very low.”
The Ahearn deal at $2 bn was a size that URI could easily absorb at this point in its history. The years 2021 to 2023 saw that acquisition line in the funds flow statement at $1.44 bn for 2021, $2.34 bn for 2022, and $574 mn for 2023. That’s a total of $4.35 bn in 3 years.
Despite that deal flow, leverage has declined over that time to 1.6x at year end 2023. The equipment rental industry is still somewhat fragmented while growing as an industry. North American market share stats see URI at a 15% share, Ashtead (Sunbelt brand) at 11% and Herc Rentals at 4%. That leaves a lot of room for more deals and expansion.
Anyone who has followed URI for any length of time is familiar with the billion and multi-billion acquisitions that routinely come up. The funding mechanism is using high quality ABL lines to fund part and immediately tapping the unsecured bond market. In recent years URI diversified its funding base with IG 1L bonds and along the way a 2L also was layered in. That has complicated the ratings picture and perhaps held back more upgrades when an all-unsecured bond stack could have worked well over time in tandem with the secured ABL lines.
The hook for those watching credit quality is the intrinsic ability of URI to adjust fleet as desired to manage cash flow. The shorter lead time on equipment orders and fleet expansion also reduces risks in markets that go through shocks. For the chart above, note the 2020 swings in purchases and how it framed up vs. proceeds from sale. The free cash flow line in a pandemic was $2.44 bn. Then note the ramp-up in capex in 2021-2023 with very healthy free cash flow generation.

The above chart wraps the update with a look at the balance sheet as the new 1.5x to 2.5x leverage target (lowered from 2.0x to 3.0x) is already at the low end. That net debt level of just over $11 bn frames up well against over $43 billion in market value of equity.
The shareholder enhancement practices at URI are always a priority for management with buybacks now being joined by the initiation of dividends this past year ($407 mn in total for 2023 vs. zero in 2022). The balancing act has been successful for shareholders and credit quality. Leverage is down and average fleet size – the primary earning asset base – is up materially along with cash flow.
We saw $1.1 bn in stock repurchases the past year and $1.1 bn in 2022 after minimal buybacks in 2021. During 2021, URI was gearing up to get back into growing its capex and getting ready for a fresh round of M&A planning in 2021 and 2022. URI has a history of easing the focus on buybacks during acquisition and integration periods. During 2021, URI acquired General Finance in a cash acquisition of $1.03 bn that closed in May 2021 before the Ahern deal in Dec 2022 for $2 bn in cash.
Capex vs. M&A in the asset protection story line…
While some investors like to look at net rental equipment vs. total debt level as an asset protection metric (net rental equipment exceeds total debt at URI), that understates the extreme level of excess asset value protection that URI boasts since much of its history has focused on M&A and buying local branch and business line operations. Those branch and local market share assets bring a stream of cash flow that pays off as it expands its revenue line, earnings, and cash flow while building out URIs customer base. Those accretive M&A strategies show up in the goodwill line.
The acquisitive players rolling up a fragmented industry group could add local pricing power to that list of virtues, but companies are not allowed to say that with their outside voice. The “clustering” of branches in local and regional markets is a proven strategy used by industry leaders URI and Ashtead.
The branch network with so many customers and equipment types make URI one of the best indicators of what is going on in the trenches in its verticals and notably in nonresidential construction and industrial and manufacturing activity. At the same time, URI routinely surveys its customers as part of its fleet and branch expansion planning. That makes for good color on earnings calls and Investor Days.
Summary: still growing in 2024
As we look at the totality of the URI numbers and the steady demand in the markets discussed on the earnings call and in Q&A, the easy macro comment to take away is when the CEO wrapped up near the end of Q&A with the snippet “it is still a growth environment.”
Whether the growth slows is another variable to handicap as 2024 unfolds, but the flexibility of URI to adjust to almost any set of conditions is clear. After watching URI grow across a post-TMT meltdown, a systemic credit crisis, and a pandemic since its IPO days, I cringe to think of what would derail it. That of course would need to be put in portfolio context, and there is a long line ahead of URI that would feel it worse.
URI discussed its customer surveys on growth expectations, and the output signaled growth but more mixed across local markets, national market customers, and the mega projects and infrastructure demand expectations. It still blended up to modest growth framed against a very good 2023.
One item cited was the infrastructure projects that are on the White House website. The Investing in America 2023 Top 10 was referenced near the end of the call with the bridges and tunnels from the infrastructure goals part of the mega-project backdrop. URI cited the fact that most of those have not even “broken ground.” Of course, in an election year of malice, ill will, bad intent, and dysfunctional House funding battles, those ground- breaking questions on timing will linger.
See also:
GDP and Fixed Investment: Into the Weeds 1-25-24
Construction Spending: Timing is Everything 12-1-23
Fixed Investment in GDP: The Capex Journey10-30-23
Rental Equipment: A Cyclical Confidence Booster 9-15-23
Credit Crib Notes: United Rentals (URI) 9-12-23
Ashtead 4Q23/FY 2023 - Company Comment 6-14-23
United Rentals: Investor Day Backs Up Bulls 6-11-23
Caterpillar: CAT and United Rentals for Some Capex Color 4-30-23