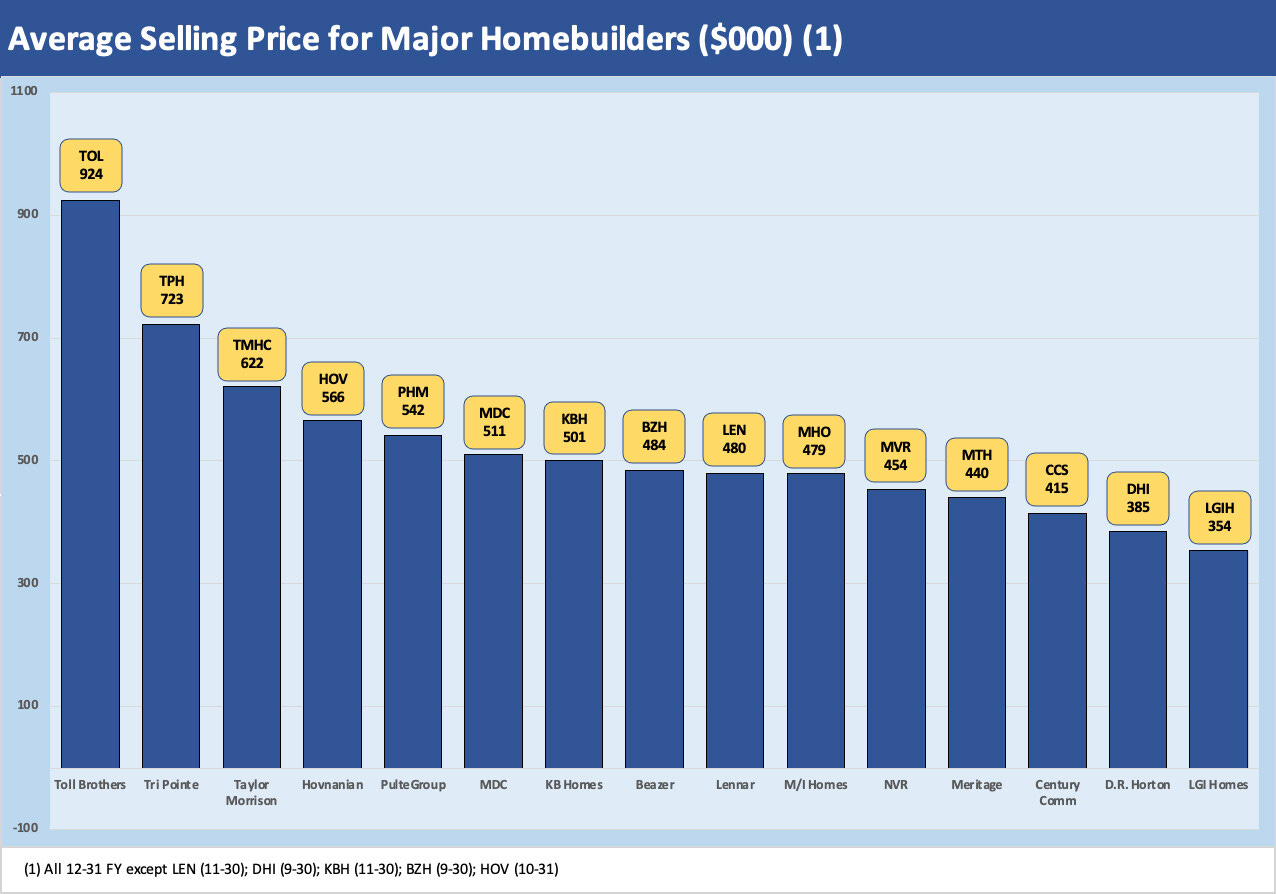
Homebuilders: Average Selling Prices by Company
We look at the average selling prices (ASPs) of the leading publicly traded builders with its very wide Hi-Lo range.
When it is time to frame how much of a struggle the homebuilders face since the upward mortgage spiral and ensuing volatility unfolded, it is always a good idea to go back to the builders themselves. Below we plot the average selling prices for 15 major builders. We include the FY 2022 for each builder from the most recent fiscal year. The homebuilder earnings for the December fiscal year are almost done with LGI Homes (LGIH) and Tri Pointe (TPH) slated for Tuesday, Feb 21. In the chart, we use the 3Q22 ASP as a placeholder for LGIH and TPH.
We highlight that some builders use closings or contracts for their ASP disclosure and some use deliveries, but the general concept remains the same in substance. It is worth flagging that Toll Brothers has now cracked $1 million if they used contracts vs. deliveries.
The range in prices is striking but serves as a reminder that it is hard to generalize too much about builders when they serve such a wide range of buyers across so many regions and product offerings. Toll Brothers may be an extreme example at $924K for FY 2022, but the idea of the “regional economy” is not lost or forgotten despite the correlation of just about everything back in the housing bubble and ensuing systemic meltdown. Some builders have more exposure than others to major markets such as energy, tech, or manufacturing but much less so than in earlier cycles. It is not hard to discern from the list who has high exposure to California (even if Toll is expensive everywhere).
The national level brush still works (for now) to describe conditions in that low unemployment and mortgage rates are common factors. As we covered in other commentaries, mortgage rates are in the zone of the bubble years and are not alien economic backdrops. The 6% range does bring a swing factor, however, and that swing is ASP levels to mitigate some of the affordability strain. The ASPs above have a lot of better times reflected in the contracts in build-to-order revenue streams for many.
The pricing strategy from here gets back to the cost structure, community planning and product segment targets of the homebuilders. Their margin expectations may also get lowered as part of the current reality. The builders have been there before and more than once.
To date, the inventory planning has been drawing praise from the equity markets. The credit markets also can sleep well “being long” most of these names in their portfolio. Most have not had to struggle with more creative liability management solutions (yet), and there are plenty of balance sheet management actions available we will be looking at along the way if the industry recession gets worse into 2024.
The waves of news around selling prices and home values will not see much certainty on expectations for a while. A lot of input lies ahead with more rounds of Fed decisions, inflation handicapping exercises, and mortgage repricing drills off the 10Y UST. For the builders, there will be some continued tests from the real world on what sells by region, by MSA, or by individual community projects. How much house your dollar can buy is not an exact science. For now, the new home sales and existing home sales data keeps on rolling out and the various indexes from Case-Shiller to the FHFA to whatever Zillow and Redfin generate will keep the color commentary busy.
We plan to expand coverage of most of these names over the near term (we may skip Hovnanian just given the idiosyncrasies of that name) given the up-close and personal views they have on the market trends by region and metro. The stocks and bonds are sitting in a lot of portfolios, and the differences in risk profile of this sector (as in much lower) relative to the housing crisis years is much easier to demonstrate at the company level.


